. 2020 Jun 4;11(1):2802.
doi: 10.1038/s41467-020-16631-9.

Emergent constraints on future projections of the western North Pacific Subtropical High

Affiliations

Emergent constraints on future projections of the western North Pacific Subtropical High

Xiaolong Chen et al. Nat Commun. .

Abstract

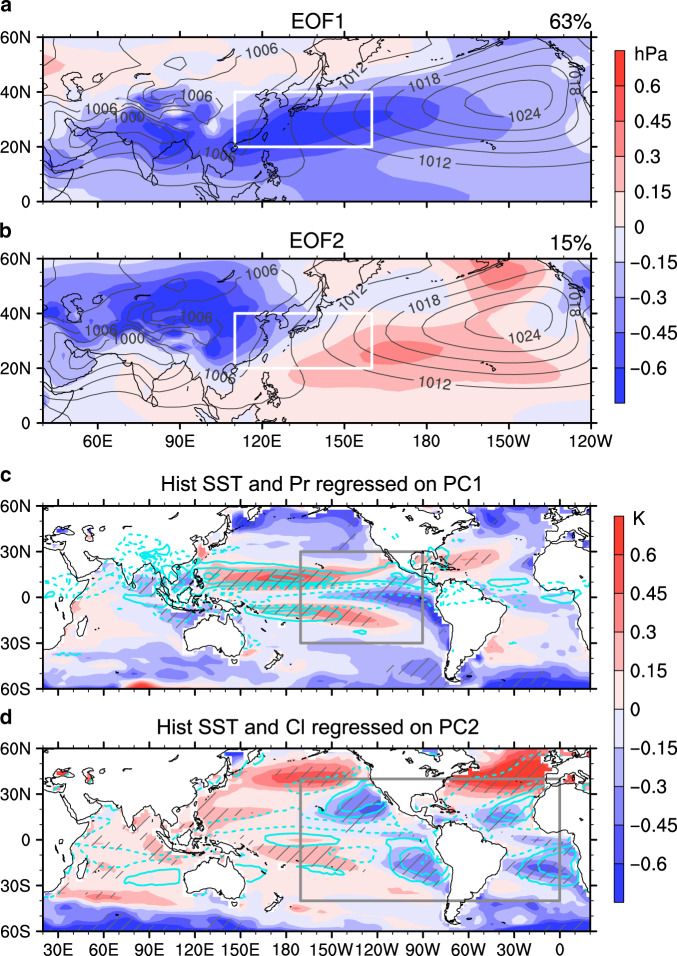
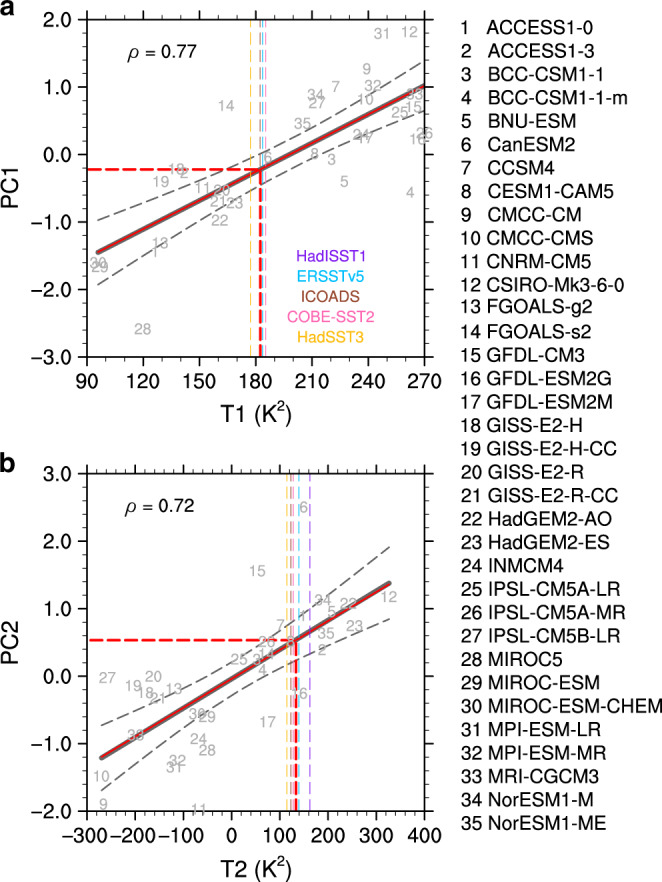
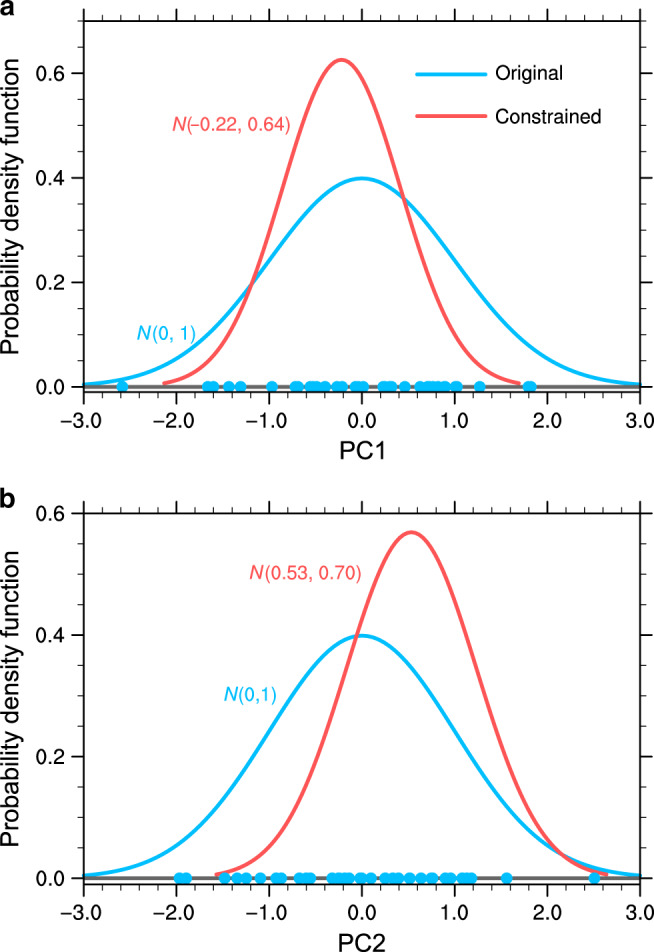
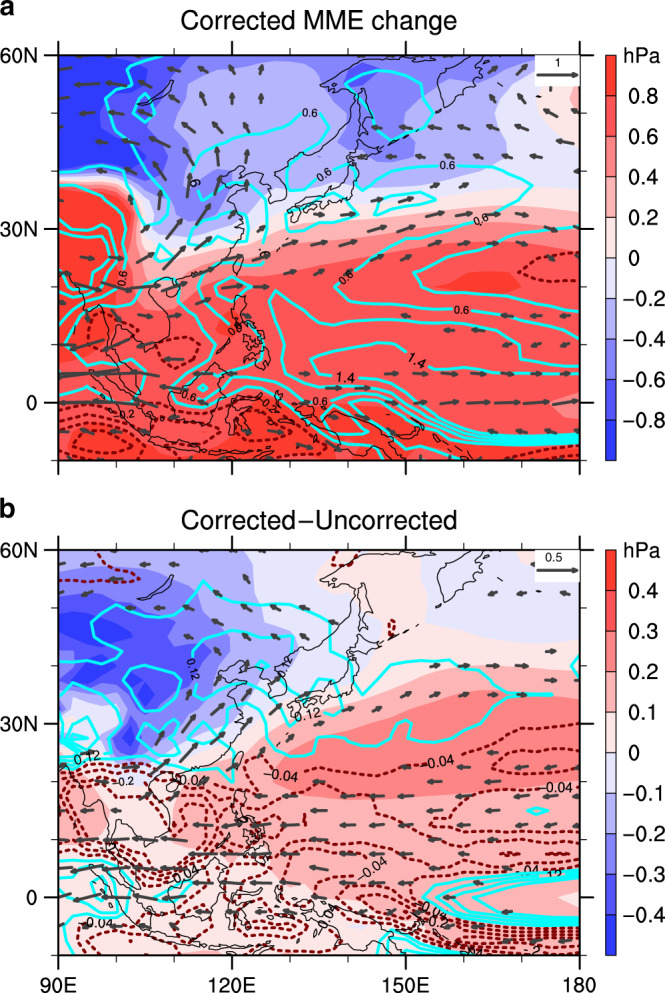
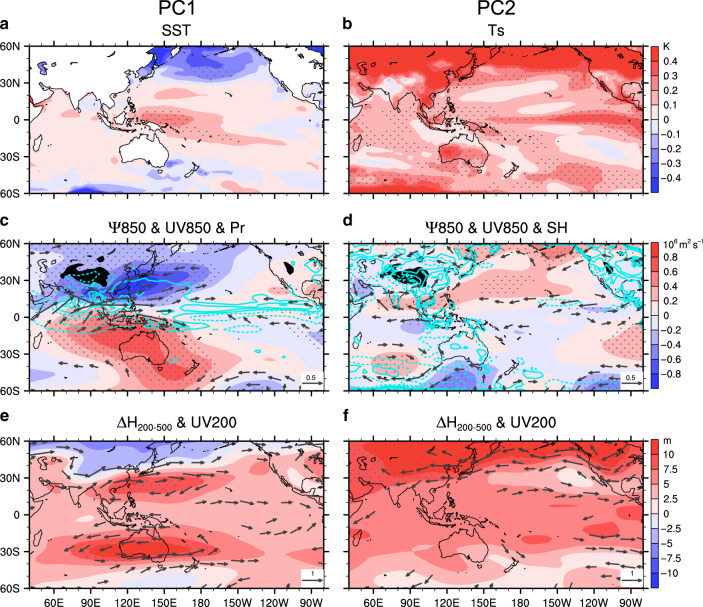
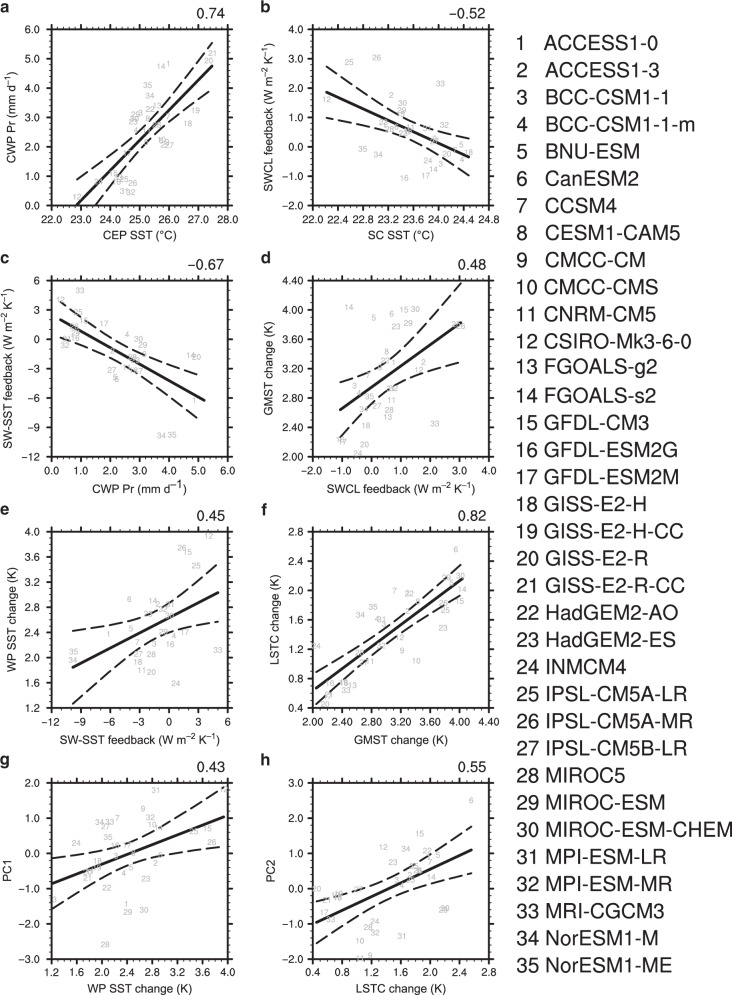
The western North Pacific Subtropical High (WNPSH) is a key circulation system controlling the summer monsoon and typhoon activities over the western Pacific, but future projections of its changes remain hugely uncertain. Here we find two leading modes that account for nearly 80% intermodel spread in its future projection under a high emission scenario. They are linked to a cold-tongue-like bias in the central-eastern tropical Pacific and a warm bias beneath the marine stratocumulus, respectively. Observational constraints using sea surface temperature patterns reduce the uncertainties by 45% and indicate a robust intensification of the WNPSH due to suppressed warming in the western Pacific and enhanced land-sea thermal contrast, leading to 28% more rainfall projected in East China and 36% less rainfall in Southeast Asia than suggested by the multi-model mean. The intensification of the WNPSH implies more future monsoon rainfall and heatwaves but less typhoon landfalls over East Asia.


Conflict of interest statement

The authors declare no competing interests.

Figures

Fig. 1
Fig. 1. Projected leading uncertainty modes and related historical spread patterns.
a, b The two leading modes (EOF1 and EOF2) derived from intermodel empirical orthogonal function (EOF) analysis on projected changes of the western North Pacific Subtropical High (white box) under a high emission scenario (RCP8.5; see details in “Methods”), showing anomalous sea level pressure (SLP; shadings; hPa) by regressing onto the corresponding first and second normalized principal components (PC1 and PC2; Supplementary Fig. 2), overlaid by climatological SLP (contours; hPa). Value on the top-right corner is explained intermodel variance by corresponding mode. c Historical model spread patterns of sea surface temperature (SST; shading; K) and precipitation (Pr; contours drawn for ±0.4, ±1.2, and ±2.0 mm day−1) associated with PC1, and d the patterns of SST (shading; K) and cloud fraction (Cl; contours drawn for ±2, ±6, and ±10%) associated with PC2. To exclude the influence of global-scale bias in SST simulation, the mean SST in 30°S–30°N is subtracted in each model before regressed onto the PCs. Gray boxes in (c) and (d) are used to define SST pattern indices to constrain the PCs (“Methods”). Hatched regions are statistically significant at the 5% level under Student t-test.
Fig. 2
Fig. 2. Relationship between spreads in projection and historical temperature pattern.
T1 in (a) and T2 in (b) (K2) measure how the sea surface temperature (SST) patterns in gray boxes in Fig. 1c, d are simulated in a model’s historical climate, respectively (see Eqs. (2) and (3)). T1 and T2 well explain the first and second principal components (PC1 and PC2), respectively, the two leading uncertainty modes of projected changes in the western North Pacific Subtropical High, with high correlation coefficients (ρ) statistically significant at the 1% level under Student t-test. Bold gray fitting line is obtained by the least square method while thin red line is an observational correction based on Eq. (5). Gray dashed curves denote the 95% confidence range of the linear regression. T1 and T2 indices from five observational SST datasets (HadISSTv1.1, ERSSTv5, ICOADS, COBE-SST2, and HadSST3; vertical thin dashed lines) are used to constrain the values of PCs. Mean of the five observational results yield the optimal constraint (red dashed line).
Fig. 3
Fig. 3. Probability density function of original and constrained principal components.
a, b Probability density functions of the first and second principal components (PC1 and PC2; Supplementary Fig. 2) are generated under Gaussian assumption. The PCs represent the leading intermodel uncertainty modes of the projected changes in the western North Pacific Subtropical High. The values in parentheses are mean and standard deviation of the Gaussian distribution. Dots denote the PC values of each model.
Fig. 4
Fig. 4. Corrected projections and differences from the uncorrected.
a Corrected sea level pressure projection (shadings; hPa) and related changes in 850 hPa wind (vectors drawn for larger than 0.2 m s−1) and precipitation (contours; mm day−1) over the western North Pacific region in the multi-model ensemble mean (MME) based on the best-estimated principal components (see details in “Methods”). b The difference between corrected and uncorrected results, which is reconstructed by the two constrained leading uncertainty modes (Supplementary Fig. 5). Corrected results show an enhanced western North Pacific Subtropical High, stronger monsoon circulation, and rainfall band in East Asia which are underestimated in the original MME.
Fig. 5
Fig. 5. Physical mechanisms related to model uncertainties in projection.
a, c, e Intermodel spread in projected changes associated with the first principal component (PC1) and b, d, f those associated with the second principal component (PC2). a, b Sea surface temperature (SST; shadings; K) and surface temperature (Ts; shadings; K), respectively. c, d Stream function (ψ850; shadings; 106 m2 s−1) and wind (UV850; vectors drawn for larger than 0.2 m s−1) at 850 hPa, precipitation (Pr; contours in (c) drawn for ±0.2, ±0.6, and ±1.0 mm day−1), and sensible heat flux (SH; contours in (d) drawn for ±0.6, ±1.8, and ±3.0 W m−2). e, f Thickness (ΔH200–500; shadings; m) between 200 and 500 hPa and wind (UV200; vectors drawn for larger than 1 m s−1) at 200 hPa. Dotted shadings are statistically significant at the 5% level under Student t-test. Uncertainty in the equatorial western Pacific warming in (a) leads to the first uncertainty mode through the Gill-type response in (c) and (e) by triggering convective heating over the western Pacific in (c). Uncertainty related to changes in land–sea thermal contrast in (b) and associated sensible heating in (d) are responsible for the second uncertainty mode. Weakened subtropical jet stream in (f) is also manifested as a result of enhanced land–sea thermal contrast.
Fig. 6
Fig. 6. Pipelining physical links between historical and projected spreads.
a, c, e, g Intermodel relationship among the central-eastern Pacific (CEP) sea surface temperature (SST), central-western Pacific (CWP) precipitation, cloud shortwave-SST (SW-SST) feedback, western Pacific (WP) SST change, and the first principal component (PC1). b, d, f, h Intermodel relationship among SST beneath the marine stratocumulus (SC), shortwave cloud (SWCL) feedback, global mean surface air temperature (GMST) change, land–sea thermal contrast (LSTC) change, and the second principal component (PC2). The indices above are defined in “Methods”. Solid fitting line is obtained by the least square method. Dashed curves denote the 95% confidence range of the linear regression. Value on the top-right corner of each subplot is correlation coefficient. All the correlation coefficients are statistically significant at the 5% level under Student t-test.
Fig. 7
Fig. 7. Physical processes backing emergent constraints on uncertain modes.
Solid boxes denote processes in the historical period and dashed boxes for future projection. Red: a process is larger/stronger in observation than historical simulation in multi-model ensemble mean (MME) or it should be larger/stronger in future changes than original projection in MME. Blue: opposite to the red. Percentages on the top are reduced variances after constrained by observational sea surface temperature (SST) for the two leading intermodel empirical orthogonal function (EOF) modes (EOF1 and EOF2) of projected changes in the western North Pacific Subtropical High (WNPSH). The constrained results for both the two modes favor an enhanced western North Pacific Subtropical High in future, represented by a negative value of the first principal component (PC1) and a positive value of the second principal component (PC2).

References

    1. Wang B, Wu R, Lau KM. Interannual variability of the Asian summer monsoon: contrasts between the Indian and the western North Pacific-East Asian Monsoon. J. Clim. 2001;14:4073–4090.
    1. Wu B, Zhou T, Li T. Seasonally evolving dominant interannual variability modes of East Asian climate. J. Clim. 2009;22:2992–3005.
    1. Kosaka Y, Xie S-P, Lau N-C, Vecchi GA. Origin of seasonal predictability for summer climate over the Northwestern Pacific. Proc. Natl. Acad. Sci. USA. 2013;110:7574–7579. - PMC - PubMed
    1. Wang B, Xiang B, Lee J-Y. Subtropical High predictability establishes a promising way for monsoon and tropical storm predictions. Proc. Natl. Acad. Sci. USA. 2013;110:2718–2722. - PMC - PubMed
    1. Wang B, Yang J, Zhou T, Wang B. Interdecadal changes in the major modes of Asian–Australian monsoon variability: strengthening relationship with ENSO since the late 1970s. J. Clim. 2008;21:1771–1789.

Publication types