. 2020 Jun 4;11(1):2815.
doi: 10.1038/s41467-020-16485-1.

Whole-genome resequencing of wild and domestic sheep identifies genes associated with morphological and agronomic traits

Affiliations

Whole-genome resequencing of wild and domestic sheep identifies genes associated with morphological and agronomic traits

Xin Li et al. Nat Commun. .

Abstract

Understanding the genetic changes underlying phenotypic variation in sheep (Ovis aries) may facilitate our efforts towards further improvement. Here, we report the deep resequencing of 248 sheep including the wild ancestor (O. orientalis), landraces, and improved breeds. We explored the sheep variome and selection signatures. We detected genomic regions harboring genes associated with distinct morphological and agronomic traits, which may be past and potential future targets of domestication, breeding, and selection. Furthermore, we found non-synonymous mutations in a set of plausible candidate genes and significant differences in their allele frequency distributions across breeds. We identified PDGFD as a likely causal gene for fat deposition in the tails of sheep through transcriptome, RT-PCR, qPCR, and Western blot analyses. Our results provide insights into the demographic history of sheep and a valuable genomic resource for future genetic studies and improved genome-assisted breeding of sheep and other domestic animals.


Conflict of interest statement

The authors declare no competing interests.

Figures

Fig. 1
Fig. 1. Geographic distribution and genetic structure of domestic and wild sheep.
a The geographic distribution of Asiatic mouflon, 36 landraces, and six improved breeds, which are represented by blue, red, and green dots on the world map, respectively. MOU, Asiatic mouflon; AFH, Afshari; AFS, Afar; ALS, Altay; AWA, Awassi; BOG, Bonga; BSB, Bashibai; CAM, Cameroon; CLS, Celle Black; DJI, Djallonké; DLS, Duolang; DPS, Dorper (WDP, white head; BDP, black head); DRS, Drenthe Heathen; EFR, East Friesian Dairy; FIN, Finnsheep; GHE, Ghezel; GOT, Gotland; GSS, Gray-Shiraz; HAS, Hamdani; HDW, Large-tailed Han; HUS, Hu; KAR, Karakul; MAK, Makui; MAZ, Mazekh; MBS, Mbororo; MFW, Chinese Merino (fine wool); MOH, Moghani; MOS, Mossi; MSF, Chinese Merino (super-fine wool); OUE, Ouessant; SAH, Sahelian; SFK, Suffolk; SHA, Shal; SHE, Shetland; SOL, Solognote; SSS, Sishui Fur; SXW, Small-tailed Han; TAN, Tan; UDA, Uda; WAD, West African Dwarf; WDS, Wadi; WGR, Waggir; and YAN, Yankasa. b Neighbor-joining (NJ) tree of the 248 individuals constructed using the p-distances between individuals, with Asiatic mouflon as an outgroup. c Plots of principal components 1 and 2 for the 248 individuals. d Decay of linkage disequilibrium in the Asiatic mouflon, landraces, and improved breeds. e Neighbor-joining tree of five genetic groups based on the Reynolds genetic distances. Red numbers beside divergence nodes are bootstrap values based on 1,000 replications. A scale bar represents branch length in terms of percent divergences (%). Source data are provided as a Source Data file.
Fig. 2
Fig. 2. Venn diagrams summarize unique and common variants among groups.
Venn diagrams represent unique and shared SNPs, Indels, CNVs, and SVs among landraces, improved breeds, and Asiatic mouflon.
Fig. 3
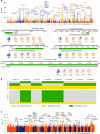
Fig. 3. Genome-wide annotations during sheep domestication and improvement.
a Whole-genome screening for selected regions during domestication by comparing five old landrace populations (Drenthe Heathen (DRS) in Europe, Altay (ALS) in Central Asia, Hu sheep (HUS) in East Asia, Djallonké sheep (DJI) in Africa, and Karakul sheep (KAR) in the Middle East) with Asiatic mouflon (MOU) through the XP-CLR. The black horizontal dashed line corresponds to the genome-wide significance threshold (XP-CLR = 26.96). Candidate genes overlapping with regions which were significantly selected by XP-CLR & ln(π ratio)/ln(2), XP-CLR & ln(π ratio)/ln(2) & iHS, XP-CLR & ln(π ratio)/ln(2) & HKA, and XP-CLR & ln(π ratio)/ln(2) & iHS & HKA are marked by gray, orange, blue, and red colors, respectively. Below this plot genes near the peaks are indicated by green boxes. The pie charts represent the spectrum of allele frequencies at the non-synonymous loci of the focused genes PDE6B, BCO2, NKX2-1, ADAMTSL3, and LOC101108252 in Asiatic mouflon and the five old landraces. The type of variant allele is indicated in blue, whereas the reference allele in pink. b The patterns of genotypes of the LOC101108252 gene region among Asiatic mouflon and the five old landraces based on eight SNPs. c Genome-wide distribution of global FST, which is measured by the average value for each SNP across all 42 domestic breeds. The significance threshold (FST = 0.27) is denoted by black dashed line. Source data are provided as a Source Data file.
Fig. 4
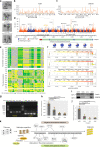
Fig. 4. Genome-wide screening and genetic basis of PDGFD for tail configuration.
a Different phenotypes in tail configurations; picture credit: Xin Li. b, c Statistic VST is plotted for selected CNVs through pairwise comparison on chromosomes 7 b and 14 c with same threshold VST value ≥ 0.64. d Selective regions associated with tail configuration by XP-CLR using the SNP data with the threshold XP-CLR ≥ 8.26. Candidate genes overlapping with the regions, which are significantly selected by XP-CLR & ln(π ratio)/ln(2), XP-CLR & ln(π ratio)/ln(2) & iHS, and XP-CLR & ln(π ratio)/ln(2) & HKA are marked by gray, orange, and blue colors, respectively. Below this plot, genes near the peaks are indicated by green boxes. The pie charts represent the spectrum of allele frequencies at the non-synonymous loci of PDGFD in populations of different tail configurations. The type of variant allele is indicated in blue, while the reference allele in pink. e Genotype patterns for the promoter region of PDGFD among 11 fat-tailed/rumped, 11 thin-tailed sheep, and Asiatic mouflon. f Structures and expression levels of four isoforms of PDGFD. Expression levels are shown in varying shades of yellow color. g, i Expression pattern of control gene β-actin and target gene PDGFD in tail fat examined by RT-PCR g and western blot analysis i. h, j The relative expressions of PDGFD in tail fat by real-time PCR (qPCR) h and western blot analysis j. k Adipogenesis signaling pathway and the inhibitory function of PDGFD in differentiation of white adipocytes by activating PDGFRβ signaling. All experiments were repeated three times with similar results. Samples derived from the same experiment and the blots were processed in parallel. gj Experiments were performed with the control sample (the thin-tailed sheep; MFW) and target samples (long fat-tailed sheep (HDW), fat-rumped sheep (ALS) and short fat-tailed sheep (SXW)). The data in h and j are presented as the mean ± SD, n = 3 biologically independent samples; groups with significant differences (*P < 0.05; **P < 0.01) were performed by two-tailed unpaired t-test. Source data are provided as a Source Data file.
Fig. 5
Fig. 5. Selective and association signatures for sheep horn number.
a Different phenotypes of horn types between Sishui Fur sheep (SSS), Small-tailed Han sheep (SXW), and Hu sheep (HUS); picture credit: Meng-Hua Li. b, c Manhattan plot and quantile–quantile plot of association signals for the number of horns based on whole-genome CNV data b and SNPs c. The horizontal dashed lines correspond to the genome-wide significance thresholds (−log10(0.05/Total CNVs) = 5.29 for CNVs and −log10(P value) = 6 for SNPs). d Manhattan plot of selective sweeps for polycerate trait (SSS versus SXW) on chromosome 2. Allele frequency distribution of one non-synonymous SNP at the downstream of HOXD1 gene in one polycerate breed (SSS), two two-horned breeds (SXW and TAN) and one polled breed (HUS). The horizontal dashed line corresponds to the genome-wide significance threshold (XP-CLR = 5.17). e Manhattan plot of selective sweeps for polled trait (HUS versus SXW) on chromosome 10. Allele frequency distribution of one non-synonymous SNP at the downstream of RXFP2 gene in one polycerate breed (SSS), two two-horned breeds (SXW and TAN) and one polled breed (HUS). The horizontal dashed line corresponds to the genome-wide significance threshold (XP-CLR = 4.49). In all pie chart figures, the variant allele is indicated in blue, whereas the reference allele is indicated in pink. f Genotype patterns of the genes HOXD3 and HOXD8 among one polycerate breed and three two-horned breeds. g Genotype patterns of the gene RXFP2 among four horned breeds and seven polled breeds. Source data are provided as a Source Data file.
Fig. 6
Fig. 6. Average contributions of loci to phenotypic variances of three traits.
The identified genetic loci are located within ±20 kb of 25 candidate selected genes of the traits of litter size and numbers of horns and nipples. The number of significant loci within each gene is indicated at the top of each bar and the data are presented as the mean ± SD. The proportion of the phenotypic variation explained for each significant locus is listed in Supplementary Data 48.

References

    1. Alberto FJ, et al. Convergent genomic signatures of domestication in sheep and goats. Nat. Commun. 2018;9:813. - PMC - PubMed
    1. Naval-Sanchez M, et al. Sheep genome functional annotation reveals proximal regulatory elements contributed to the evolution of modern breeds. Nat. Commun. 2018;9:859. - PMC - PubMed
    1. Xu SS, Li MH. Recent advances in understanding genetic variants associated with economically important traits in sheep (Ovis aries) revealed by high-throughput screening technologies. Front. Agr. Sci. Eng. 2017;4:279–288.
    1. Meyer RS, et al. Domestication history and geographical adaptation inferred from a SNP map of African rice. Nat. Genet. 2016;48:1083–1088. - PubMed
    1. Zhou Z, et al. Resequencing 302 wild and cultivated accessions identifies genes related to domestication and improvement in soybean. Nat. Biotechnol. 2015;33:408–414. - PubMed

Publication types

MeSH terms

Substances