. 2020 Jun;582(7811):259-264.
doi: 10.1038/s41586-020-2222-z. Epub 2020 Apr 22.

Notch signalling drives synovial fibroblast identity and arthritis pathology

Collaborators, Affiliations

Notch signalling drives synovial fibroblast identity and arthritis pathology

Kevin Wei et al. Nature. 2020 Jun.

Abstract

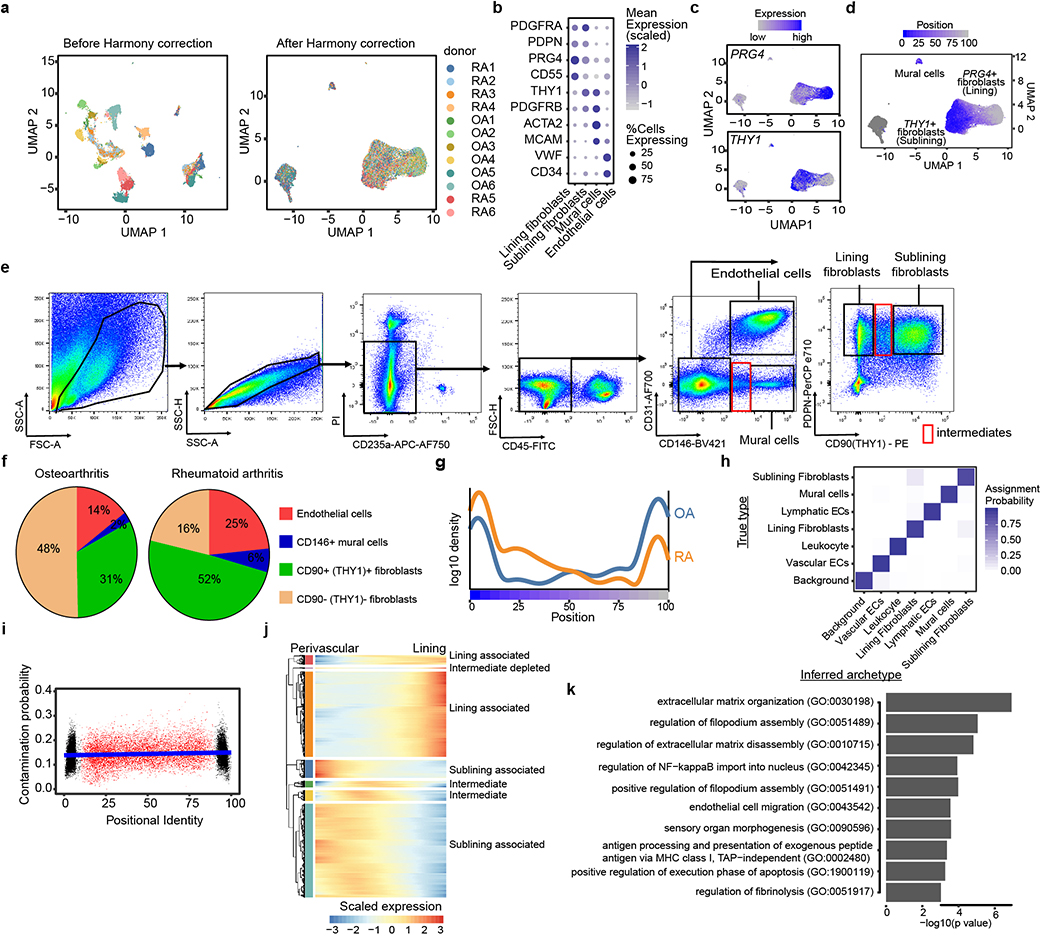
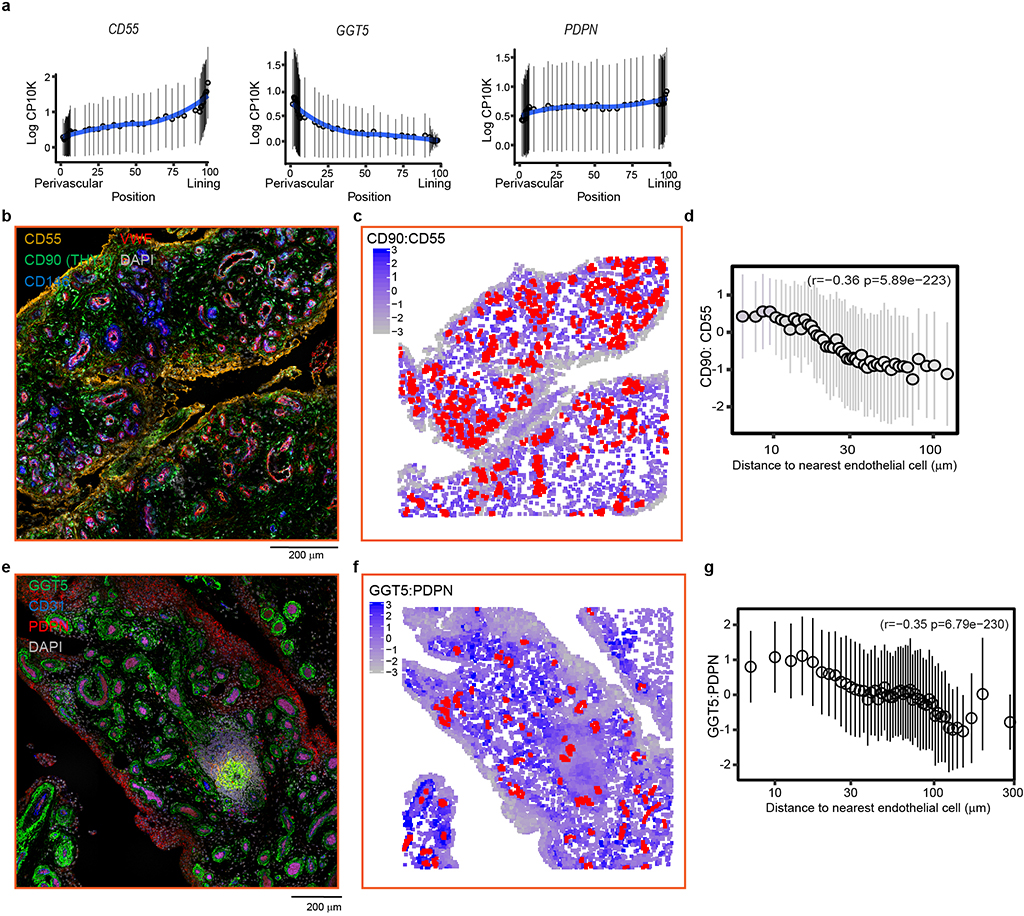
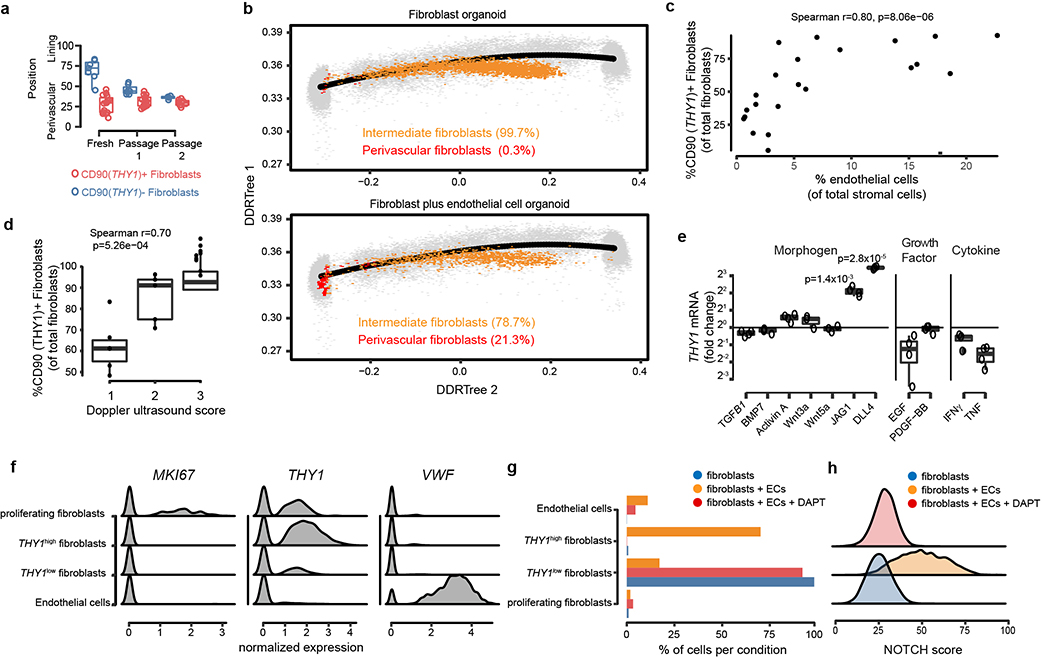
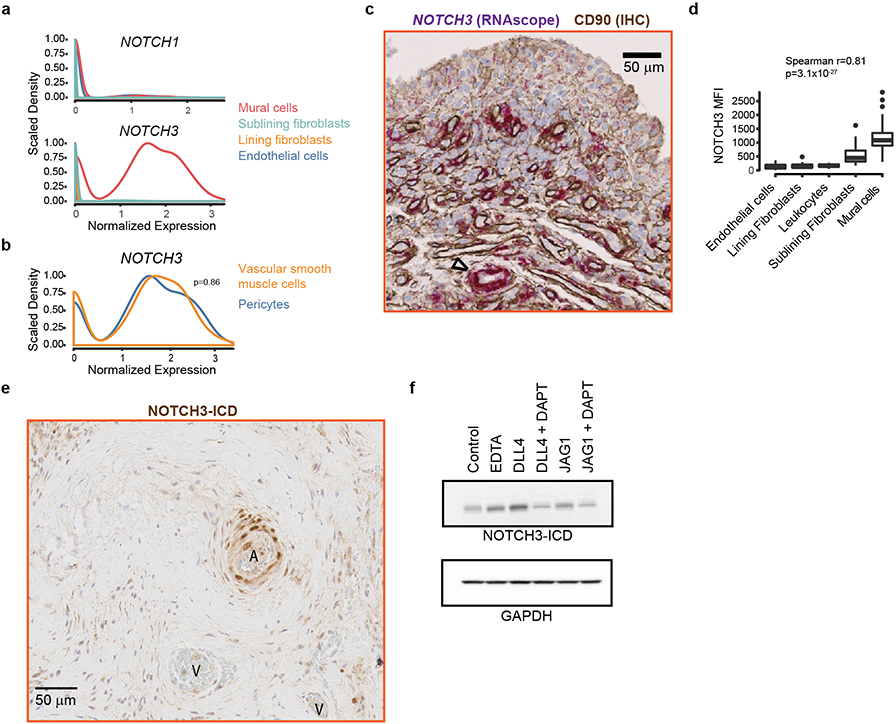
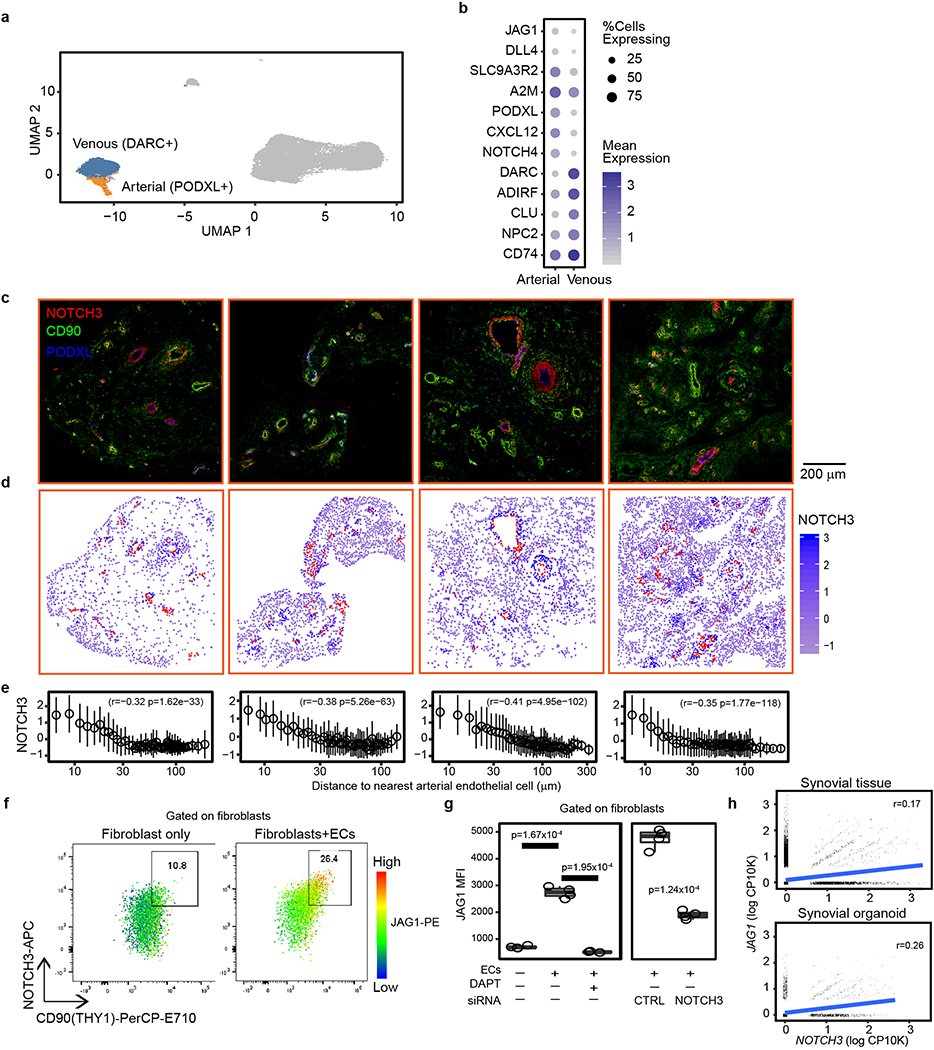
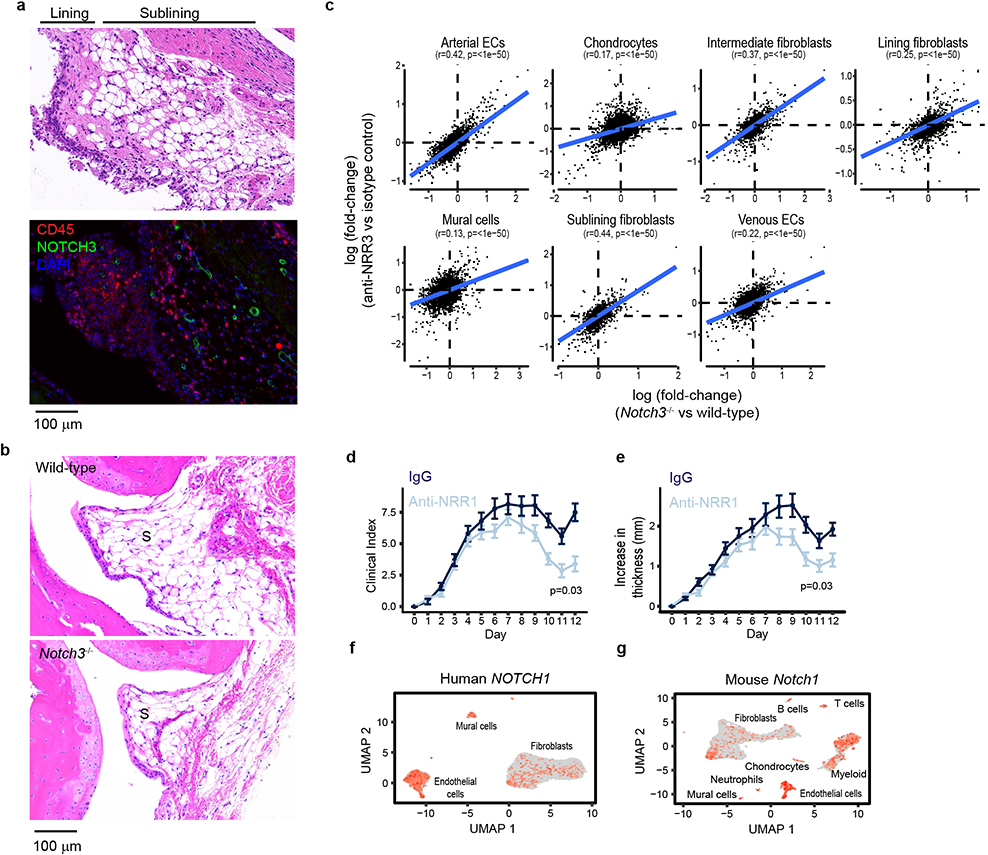
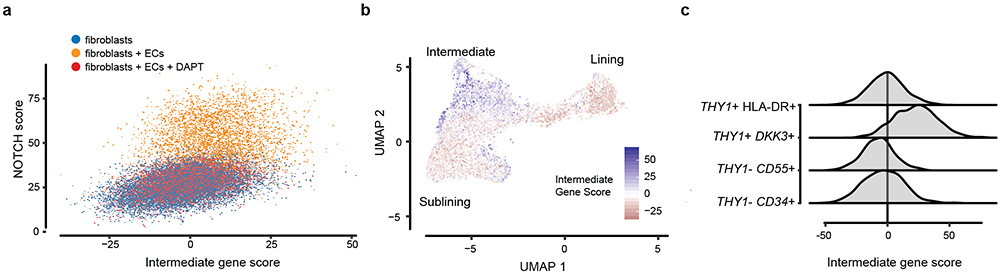
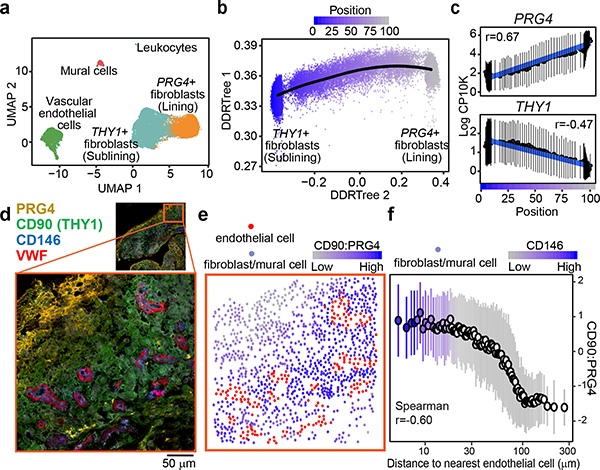
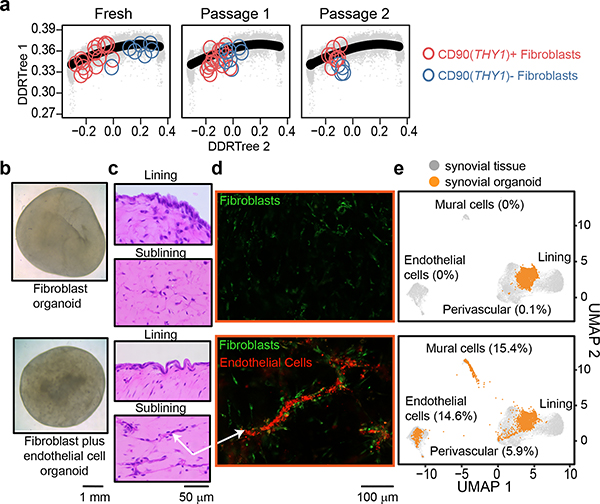
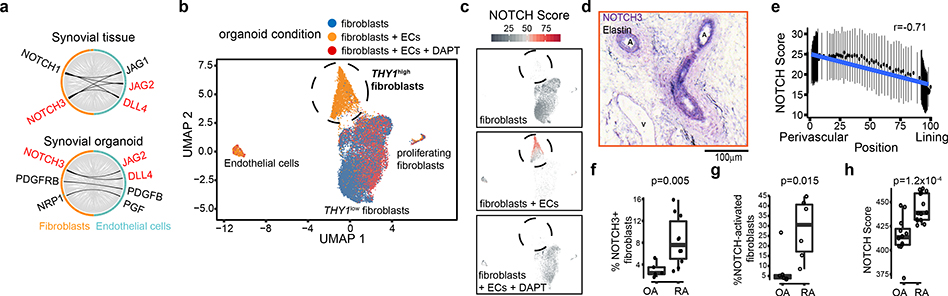
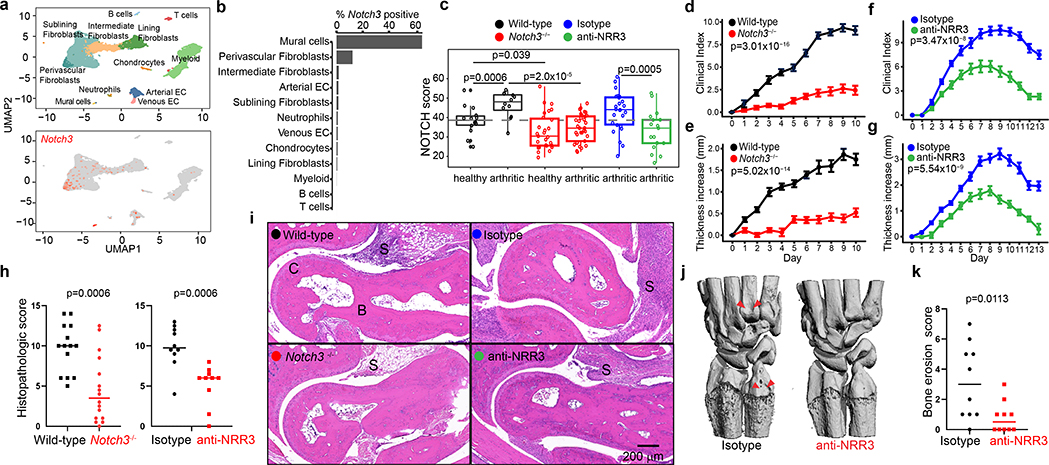
The synovium is a mesenchymal tissue composed mainly of fibroblasts, with a lining and sublining that surround the joints. In rheumatoid arthritis the synovial tissue undergoes marked hyperplasia, becomes inflamed and invasive, and destroys the joint1,2. It has recently been shown that a subset of fibroblasts in the sublining undergoes a major expansion in rheumatoid arthritis that is linked to disease activity3-5; however, the molecular mechanism by which these fibroblasts differentiate and expand is unknown. Here we identify a critical role for NOTCH3 signalling in the differentiation of perivascular and sublining fibroblasts that express CD90 (encoded by THY1). Using single-cell RNA sequencing and synovial tissue organoids, we found that NOTCH3 signalling drives both transcriptional and spatial gradients-emanating from vascular endothelial cells outwards-in fibroblasts. In active rheumatoid arthritis, NOTCH3 and Notch target genes are markedly upregulated in synovial fibroblasts. In mice, the genetic deletion of Notch3 or the blockade of NOTCH3 signalling attenuates inflammation and prevents joint damage in inflammatory arthritis. Our results indicate that synovial fibroblasts exhibit a positional identity that is regulated by endothelium-derived Notch signalling, and that this stromal crosstalk pathway underlies inflammation and pathology in inflammatory arthritis.


Conflict of interest statement

COMPETING INTERESTS

The authors have no competing financial interests.

Figures

Extended Data Figure 1.
Extended Data Figure 1.. Characterization of synovial stromal cells by single cell RNAseq and flow cytometry.
a, UMAP projection of single cell RNA-seq data of 35,153 stromal synovial cells from 12 donors before Harmony integration (left) and after Harmony integration (right). Each cell is coloured by donor source. b, Mean expression (colour) and percentage (size) of stromal markers among lining fibroblasts, sublining fibroblasts, mural cells, and endothelial cells. c, Expression of lining marker PRG4 and sublining marker THY1 in UMAP projection. d, UMAP embedding of fibroblasts and mural cells coloured by their positional identity (grey to blue). e, Representative flow cytometric gating scheme for analysis of synovial stromal cells. Intact cells are identified based on forward scatter (FSC-A) and side scatter (SSC-A) characteristics. Dead cells (PI+), red blood cells (CD235a+) and leukocytes (CD45+) are excluded from analysis. Endothelial cells (CD31+ CD146+) and mural cells (CD31- CD146+) can be distinguished from synovial fibroblasts based on CD146. Within CD31-CD146- gate, lining fibroblasts (PDPN+CD90-) and sublining fibroblasts (PDPN+ CD90+) can be identified. Red window indicates intermediates between cell types. f, Flow cytometric quantification of stromal cell populations in RA (n = 9) and OA (n = 11) synovia. Shown are mean percentage of endothelial cells (red), mural cells (blue), lining fibroblasts (tan), and sublining fibroblasts (green) of total stromal (CD45-) cells. g, Density plot of fibroblast composition in RA (orange) and OA (blue) synovia (n = 6) along positional axis. h, Archetypal analysis assigned each cell a probability distribution over the 6 biologically defined archetypes as well as the archetype representing ambient mRNA (background). Confusion matrix represents the probability that a cell with known type (y-axis) is assigned to one of 7 archetypes (x-axis). Each row is normalized to sum to 1. i, The positional identity (x-axis) of each fibroblast plotted against the probability that the cell was classified to the ambient RNA archetype (y-axis). j, heatmap visualization of transcriptional gradients along positional axis. k, pathway enrichment of 71 genes in the Intermediate group in (j), using GO biological process terms.
Extended Data Figure 2.
Extended Data Figure 2.. Spatial analysis of synovial fibroblast positional markers.
a, Normalized expression (log counts-per-ten-thousand) of position-associated fibroblast markers CD55 (left), GGT5 (middle) and PDPN (right) along positional axis. b, Representative microscopic images of synovial tissues where CD55 (yellow), CD90(THY1) (green), CD146(blue), and VWF (red) are visualized by immunofluorescence staining. c, Cells labeled as endothelial cells were coloured in red and fibroblasts were coloured from low CD90:CD55 ratio (grey) to high CD90:CD55 ratio (blue). d, Spatial correlation between fibroblast CD90:CD55 ratio and distance from nearest endothelial cell. e, Representative microscopic image of synovial tissues whwere Podoplanin(PDPN) (red), Gamma-glutamyltransferase-5(GGT5) (green), and CD31 (blue) are visualized by immunofluorescence staining. f, Cells labeled as endothelial cells were coloured in red and fibroblasts were coloured from low GGT5:PDPN (grey) ratio to high GGT5:PDPN(blue) ratio. g, Spatial correlation between fibroblast GGT5:PDPN ratio and distance from nearest endothelial cells. For b-d, n = 4 RA and n= 5 OA synovial tissues were analyzed. For e-g, n = 7 RA synovial tissues were analyzed. See Supplementary data for individual images and spatial analysis. For d and g, Spearman correlation values and significance were computed with the base R cor.test function. Cells were binned by frequency into groups of 50 cells along the x-axis and summarized by their mean (dot) and standard deviation (line).
Extended Data Figure 3.
Extended Data Figure 3.. Endothelial cells mediate differentiation of CD90 (THY1)+ fibroblasts.
a, Fibroblast positional identity scores of CD90(THY1)+ (red) and CD90(THY1)- (blue) fibroblasts at indicated passage number (Fresh: n = 7 and n = 15, passage 1: n = 7 and n = 16, passage 2: n = 4 and n = 8). Boxplots summarize the median, interquartile range, and 95% quantiles of the positional values. b, Positional identity of fibroblasts from the fibroblast-only (top, n = 4,336 cells) and fibroblast plus endothelial cell (Bottom, n = 2,076 cells) organoids. Cells are colored by inferred position along positional axis from 0 (perivascular pole) to 100 (lining pole). Perivascular fibroblasts (red) were defined as cells in position less than 20, while intermediate fibroblasts were defined as position between 20 and 80. c, Flow cytometric quantification of synovial CD90(THY1)+ fibroblasts and CD31+ endothelial cells from 22 synovial tissues. d, Percent of CD90(THY1)+ fibroblasts based on Doppler ultrasound scores of RA patients (n = 20) from the AMP-RA/SLE consortium. e, THY1 expression measured by RT-qPCR in fibroblasts after stimulation with indicated recombinant protein (n = 3 replicates for Wnt3a and Wnt5a, n = 4 replicates for other conditions). THY1 expression shown as fold-change over vehicle control for each condition. Significance determined by one-sample t-test. f-h, scRNAseq analysis of synovial organoids (n = 22,164 cells from 3 technical replicates). f, Normalized expression of defining marker gene for cell types: MKI67 for proliferating fibroblasts, VWF for endothelial cells, and THY1 for the THY1high and THY1low fibroblast groups. g, Representation of 4 major cell types, by proportion of cells in each organoid condition. h, NOTCH activation score in fibroblast derived from organoids, separated by organoid condition. ECs = endothelial cells. DAPT = organoids cultured in the presence of 10uM γ-secretase inhibitor DAPT. Significance determined by spearman correlation (c, d) and one-sample t-test (e).
Extended Data Figure 4.
Extended Data Figure 4.. NOTCH3 signaling in synovial fibroblasts and mural cells.
a-b, scRNAseq analysis in NOTCH1 and NOTCH3 expression in synovial stromal cells. a, Expression of NOTCH1 (top) and NOTCH3 (bottom) in lining fibroblasts (orange), mural cells (red), sublining fibroblasts (green), and endothelial cells (blue) from human primary synovial tissue scRNAseq data set (n = 35,153 cells from 6 RA and 6 OA synovial tissues). b, Mural cells were subdivided into 2 major mural subpopulations: vascular smooth muscle cells (orange) and pericytes (blue). No difference in expression of NOTCH3 observed (Wilcoxon rank sum test p=0.86) between pericytes and vascular smooth muscle cells. c, Representative synovial tissue sections (n = 6) showing RNAscope staining for NOTCH3 in purple, immunohistochemistry staining (IHC) for CD90 in brown and nuclei in blue. Arteriole marked by ∆. d, Summary of flow cytometric analysis of NOTCH3 mean fluorescence intensity (MFI) on synovial mural cells (n = 18), sublining fibroblasts (n = 40), lining fibroblasts (n = 20), endothelial cells (n = 15) and leukocytes (n = 19). Boxplot summarize the median, interquartile range, and 95% quantile range. Significance determined by spearman correlation. e, Representative immunohistochemistry staining of NOTCH3-intracellular domain (NOTCH3-ICD) in RA synovial tissue (n = 3). A = arterial endothelium. V = venous endothelium. f, Immunoblot of synovial fibroblast lysates probed with antibody against NOTCH3 intracellular domain (NICD3) (top) or GAPDH (bottom). Treatments: 10mmol/EDTA (Notch activation), plate-coated DLL4 (5ug/ml), or plate-coated JAG1 (5ug/ml), in the presence or absence of 10uM DAPT (γ-secretase inhibitor). n = 3 independent experiments. For gel source data, see Supplementary Data 1.
Extended Data Figure 5.
Extended Data Figure 5.. Endothelial cells induce fibroblast NOTCH3 and JAG1 expression.
a, Fine-cluster analysis of synovial tissue endothelial cell scRNAseq: Arterial PODXL+ (orange) and venous DARC+ (blue) subtypes highlighted in UMAP projection. All non-vascular endothelial cells colored grey. n = 35,153 cells from 6 RA and 6 OA synovial tissues. b, Mean expression (colour) and percentage of cells with non-zero expression (size) of top gene markers distinguishing arterial and venous endothelial cells. c, Confocal microscopy images of synovial tissues where NOTCH3 (red), CD90(THY1) (green), and PODXL(blue) were visualized by immunofluorescence staining. d, Images from above (c) were then processed to segment cells and output their spatial location and mean intensity of all 3 markers. d, Cells labeled as arterial vascular endothelial cells were coloured in red. Non-arterial endothelial cells were coloured according to NOTCH3 expression, from low (grey) to high (blue). e, Spatial correlation between NOTCH3 expression and distance from nearest arterial vascular endothelial cell. Non-arterial cells in each image were used to analyze the function between arterial distance, measured by distance to nearest arterial vascular endothelial cells, and NOTCH3 expression. Spearman correlation values and significance were computed with the base R cor.test function. Cells were binned by frequency into groups of 50 cells along the x-axis. f-g, Flow cytometric analysis of fibroblasts and endothelial cell co-culture experiments. Cells are gated on CD31- CD90+ fibroblasts to exclude endothelial cells (n = 4 replicates). f, Representative flow plot of NOTCH3, CD90 (THY1), and JAG1 expression in fibroblast-only (left) and fibroblasts plus endothelial cells (ECs) co-culture (right). Colour indicates fibroblast expression level of JAG1. g, Mean fluorescence intensity (MFI) of fibroblast JAG1 expression in the presence and absence of endothelial cells (EC), gamma-secretase inhibitor DAPT, or pre-treatment with siRNA against control (si-CTRL) or NOTCH3 (si-NOTCH3). Boxplots summarize the median, interquartile range, and 95% quantile range. h, Biaxial plots of normalized JAG1 and NOTCH3 expression in CP10K from scRNAseq of synovial tissues (top, n = 12 donors) and synovial organoids (bottom, n = 3 organoids).
Extended Data Figure 6.
Extended Data Figure 6.. NOTCH3 expression in mouse synovia and the effects of NOTCH3 or NOTCH1 inhibition.
a, Serial sections of arthritic mouse synovia (n = 5 mice) showing representative hematoxylin and eosin staining (top) and immunofluorescence staining (bottom) of CD45 (red), NOTCH3 (green) and DAPI (blue). b, Representative hematoxylin and eosin staining of mouse joints from wild-type (top, n = 6) and Notch3−/− mice (bottom, n = 6). S = synovium. c, scRNAseq of wild-type, Notch3−/−, isotype control-, or anti-NRR3- treated mouse synovial cells (total of 18,491 cells from n = 5 mice per group). Cells were clustered and labeled in a joint analysis. In the 7 identified stromal populations, differential gene expression was performed for anti-NRR3 vs isotype control and for Notch3−/− vs wildtype. Each gene was plotted as a dot, representing the log fold-change. ECs = endothelial cells. Clinical index (d) and paw swelling (e) in IgG control antibody (dark blue, n = 20) or anti-NRR1 (light blue, n = 20) treated mice after K/BxN serum transfer. Significance of each treatment was determined by mixed effects linear models, controlling for time as a categorical fixed effect and mouse as a random effect. UMAP projections of normalized expression of (f) NOTCH1 in human primary tissue scRNAseq data (35,153 cells) and (g) Notch1 in mouse scRNAseq data (n = 18,491 cells)
Extended Data Figure 7.
Extended Data Figure 7.. Characterization of intermediate fibroblast positional gene signature.
a, Gene enrichment scores for intermediate position-specific genes (x) vs NOTCH activation score (y) in synovial organoids (22,164 cells; n = 3 organoids per condition). ECs = endothelial cells. DAPT = organoids cultured in the presence of 10uM γ-secretase inhibitor DAPT. Fibroblast plus endothelial cell organoids (yellow) show evidence of increased NOTCH signaling but little enrichment in intermediate zone genes, as compared to fibroblasts that were cultured alone (blue) or co-cultured in the presence of DAPT (red). b, Enrichment of intermediate gene score in mouse synovial fibroblasts. Enrichment is lowest (red) in the previously identified lining and sublining zones and highest (blue) in the fibroblasts positioned in between the two zones, in the intermediate zone. c, Enrichment of pre-defined synovial fibroblast populations in the AMP-RA/SLE scRNAseq dataset (n = 1,844 cells).
Figure 1.
Figure 1.. Single-cell RNA-seq reveals fibroblast positional identity.
a, UMAP projection of 35,153 synovial cells from RA (n = 6) and OA (n = 6) patients. b, Trajectory analysis of synovial fibroblasts. Black line represents the trajectory and fibroblasts are coloured by their position from sublining (blue, position 0) to lining (grey, position 100). c, Expression of lining markers PRG4 (top) and sublining marker THY1 (bottom) along positional axis. d-f, Representative spatial analysis of synovial fibroblasts (n = 5 RA, n = 5 OA). d, Immunofluorescence microscopy showing VWF+ endothelial cells, CD146+ mural cells, PRG4+ lining and CD90 (THY1)+ sublining fibroblasts. e, Cells from d were segmented and abstracted spatially by their centroids (Methods). Endothelial cells were marked red and fibroblasts were colored by their CD90:PRG4 ratio (grey (low) to blue (high)). f, Fibroblast CD90:PRG4 ratio as a function of distance to the nearest endothelial cell. Cell aggregates were colored by their mean CD146 expression. In c and f, individual cells were binned by frequency (n = 100) along the x-axis and summarized by their mean (circle) and standard deviation (line). Significance determined by spearman correlation. See Supplementary Data for all images and spatial analysis performed.
Figure 2.
Figure 2.. Endothelial cells establish sublining fibroblast positional identity.
a, RNAseq profiles of CD90(THY1)- (blue) and CD90(THY1)+ (red) fibroblasts at indicated passage number (Fresh: n = 7 and n = 15, passage 1: n = 7 and n = 16, passage 2: n = 4 and n = 8) projected onto the scRNAseq trajectory embedding of fresh fibroblasts (black line). b, Apical view of a fibroblast organoid (top) and a fibroblast plus endothelial cell organoid (bottom). c, Representative hematoxylin and eosin staining of synovial organoids (n =4) demonstrating synovial lining (top) and sublining (bottom). d, Confocal microscopy images of organoids (n = 3) where fibroblasts were stained with PKH67 (green) and endothelial cells stained with PKH26 (red). Arrow indicate endothelial tubules with surrounding fibroblasts. e, Projection of scRNAseq profiles of fibroblast organoids (top, 4,336 cells) and fibroblasts plus endothelial cell organoids (bottom, 2,076 cells) onto the UMAP embedding of synovial tissue cells. Cells derived from organoids were coloured in orange and cells from synovial tissue (n = 35,153 cells) were coloured in grey.
Figure 3.
Figure 3.. NOTCH signaling drives CD90/THY1+ fibroblast differentiation.
a, Ligand-receptor analysis in synovial tissue (top) and organoid (bottom) scRNAseq datasets. Black lines indicate highly expressed ligands in endothelial cells (cyan) and receptors in fibroblasts (orange). Ligand-receptor pairs identified in both datasets were highlighted in red. b-c scRNAseq analysis of synovial organoids (n = 22,164 cells from 3 replicates). b, UMAP projection of organoid cells where each cell is coloured by culture condition: fibroblast only (blue), fibroblast plus endothelial cells (ECs, orange), fibroblasts plus endothelial cells treated with 10uM DAPT (red). c, NOTCH activation score (grey (low) to red (high)) in organoid cells. Each organoid condition was projected separately. Circle = THY1high fibroblasts. d, Immunohistochemistry staining of NOTCH3 (purple) and Elastin (black) in synovial tissue (n = 5 RA and 5 OA). A = arterial endothelium, V = venous endothelium. e, NOTCH activation score of synovial tissue fibroblasts. Individual cells were binned by frequency (n =100) along the x-axis and summarized by their mean (circle) and standard deviation (line). f, Percentage of NOTCH3+ fibroblasts in OA (n = 5) and RA (n = 10) synovia determined by flow cytometry. g, Percentage of NOTCH-activated fibroblasts in OA and RA (n = 6). h, NOTCH activation scores from bulk RNAseq profiles of RA (n = 14) and OA (n = 12) fibroblasts. Significance determined by spearman correlation (e), two-tailed t-test (f, g), and two-tailed Wilcoxon rank sum test (h). All boxplots summarize the median, interquartile range, and 95% quantile range.
Figure 4.
Figure 4.. NOTCH3 blockade attenuates inflammatory arthritis.
a-c, scRNAseq analysis of mouse synovium. a, UMAP projection of 18,491 synovial cells where cells are colored by cell type (top) or Notch3 expression (bottom). b, Percentage of cells with non-zero Notch3 expression. c, NOTCH activation score in mural cells in mice of indicated group (n = 10 mice). Dotted grey line represents median NOTCH score from healthy wild-type mice. Clinical index (d) and paw swelling (e) in wild-type (n = 14) and Notch3−/− mice (n = 16) after serum transfer. Clinical index (f) and paw swelling (g) in isotype control antibody- (n = 20) or anti-NRR3- (n = 20) treated mice after serum transfer. Quantification (h) of cumulative joint histology score and representative hematoxylin and eosin staining (i) from wild-type (n = 14), Notch3−/− (n = 16), isotype control- (n = 10), or anti-NRR3- (n = 10) treated mice. S = synovium. B = bone. C = cartilage. Representative micro-CT image (j) and quantification of erosion scores (k) of joints from isotype control antibody- (n =10) or anti-NRR3- (n = 10) treated mice. Red arrows mark bone erosion. All boxplots summarize the median, interquartile range, and 95% quantile range. d-g, Mean and standard deviation (line) shown. Significance was determined by linear mixed effects models (d-g) and two-tailed t-test (h, k).

Comment in

References

    1. McInnes IB & Schett G The pathogenesis of rheumatoid arthritis. N. Engl. J. Med 365, 2205–2219 (2011). - PubMed
    1. Dakin SG et al. Pathogenic stromal cells as therapeutic targets in joint inflammation. Nat. Rev. Rheumatol 14, 714–726 (2018). - PubMed
    1. Zhang F et al. Defining inflammatory cell states in rheumatoid arthritis joint synovial tissues by integrating single-cell transcriptomics and mass cytometry. Nature Immunology vol. 20 928–942 (2019). - PMC - PubMed
    1. Mizoguchi F et al. Functionally distinct disease-associated fibroblast subsets in rheumatoid arthritis. Nat. Commun 9, 789 (2018). - PMC - PubMed
    1. Croft AP et al. Distinct fibroblast subsets drive inflammation and damage in arthritis. Nature 570, 246–251 (2019). - PMC - PubMed

METHODS REFERENCES

    1. Donlin LT et al. Methods for high-dimensonal analysis of cells dissociated from cyropreserved synovial tissue. Arthritis Res. Ther 20, 139 (2018). - PMC - PubMed
    1. Stoeckius M et al. Cell Hashing with barcoded antibodies enables multiplexing and doublet detection for single cell genomics. Genome Biology vol. 19 (2018). - PMC - PubMed
    1. Picelli S et al. Full-length RNA-seq from single cells using Smart-seq2. Nat. Protoc 9, 171–181 (2014). - PubMed
    1. McInnes L & Healy J UMAP: Uniform Manifold Approximation and Projection for Dimension Reduction. arXiv [stat.ML] (2018). https://arxiv.org/pdf/1802.03426.pdf
    1. Choy L et al. Constitutive NOTCH3 Signaling Promotes the Growth of Basal Breast Cancers. Cancer Res. 77, 1439–1452 (2017). - PubMed

Publication types

MeSH terms