. 2020 Jun;582(7811):271-276.
doi: 10.1038/s41586-020-2228-6. Epub 2020 Apr 22.

A calcineurin-Hoxb13 axis regulates growth mode of mammalian cardiomyocytes

Affiliations

A calcineurin-Hoxb13 axis regulates growth mode of mammalian cardiomyocytes

Ngoc Uyen Nhi Nguyen et al. Nature. 2020 Jun.

Abstract

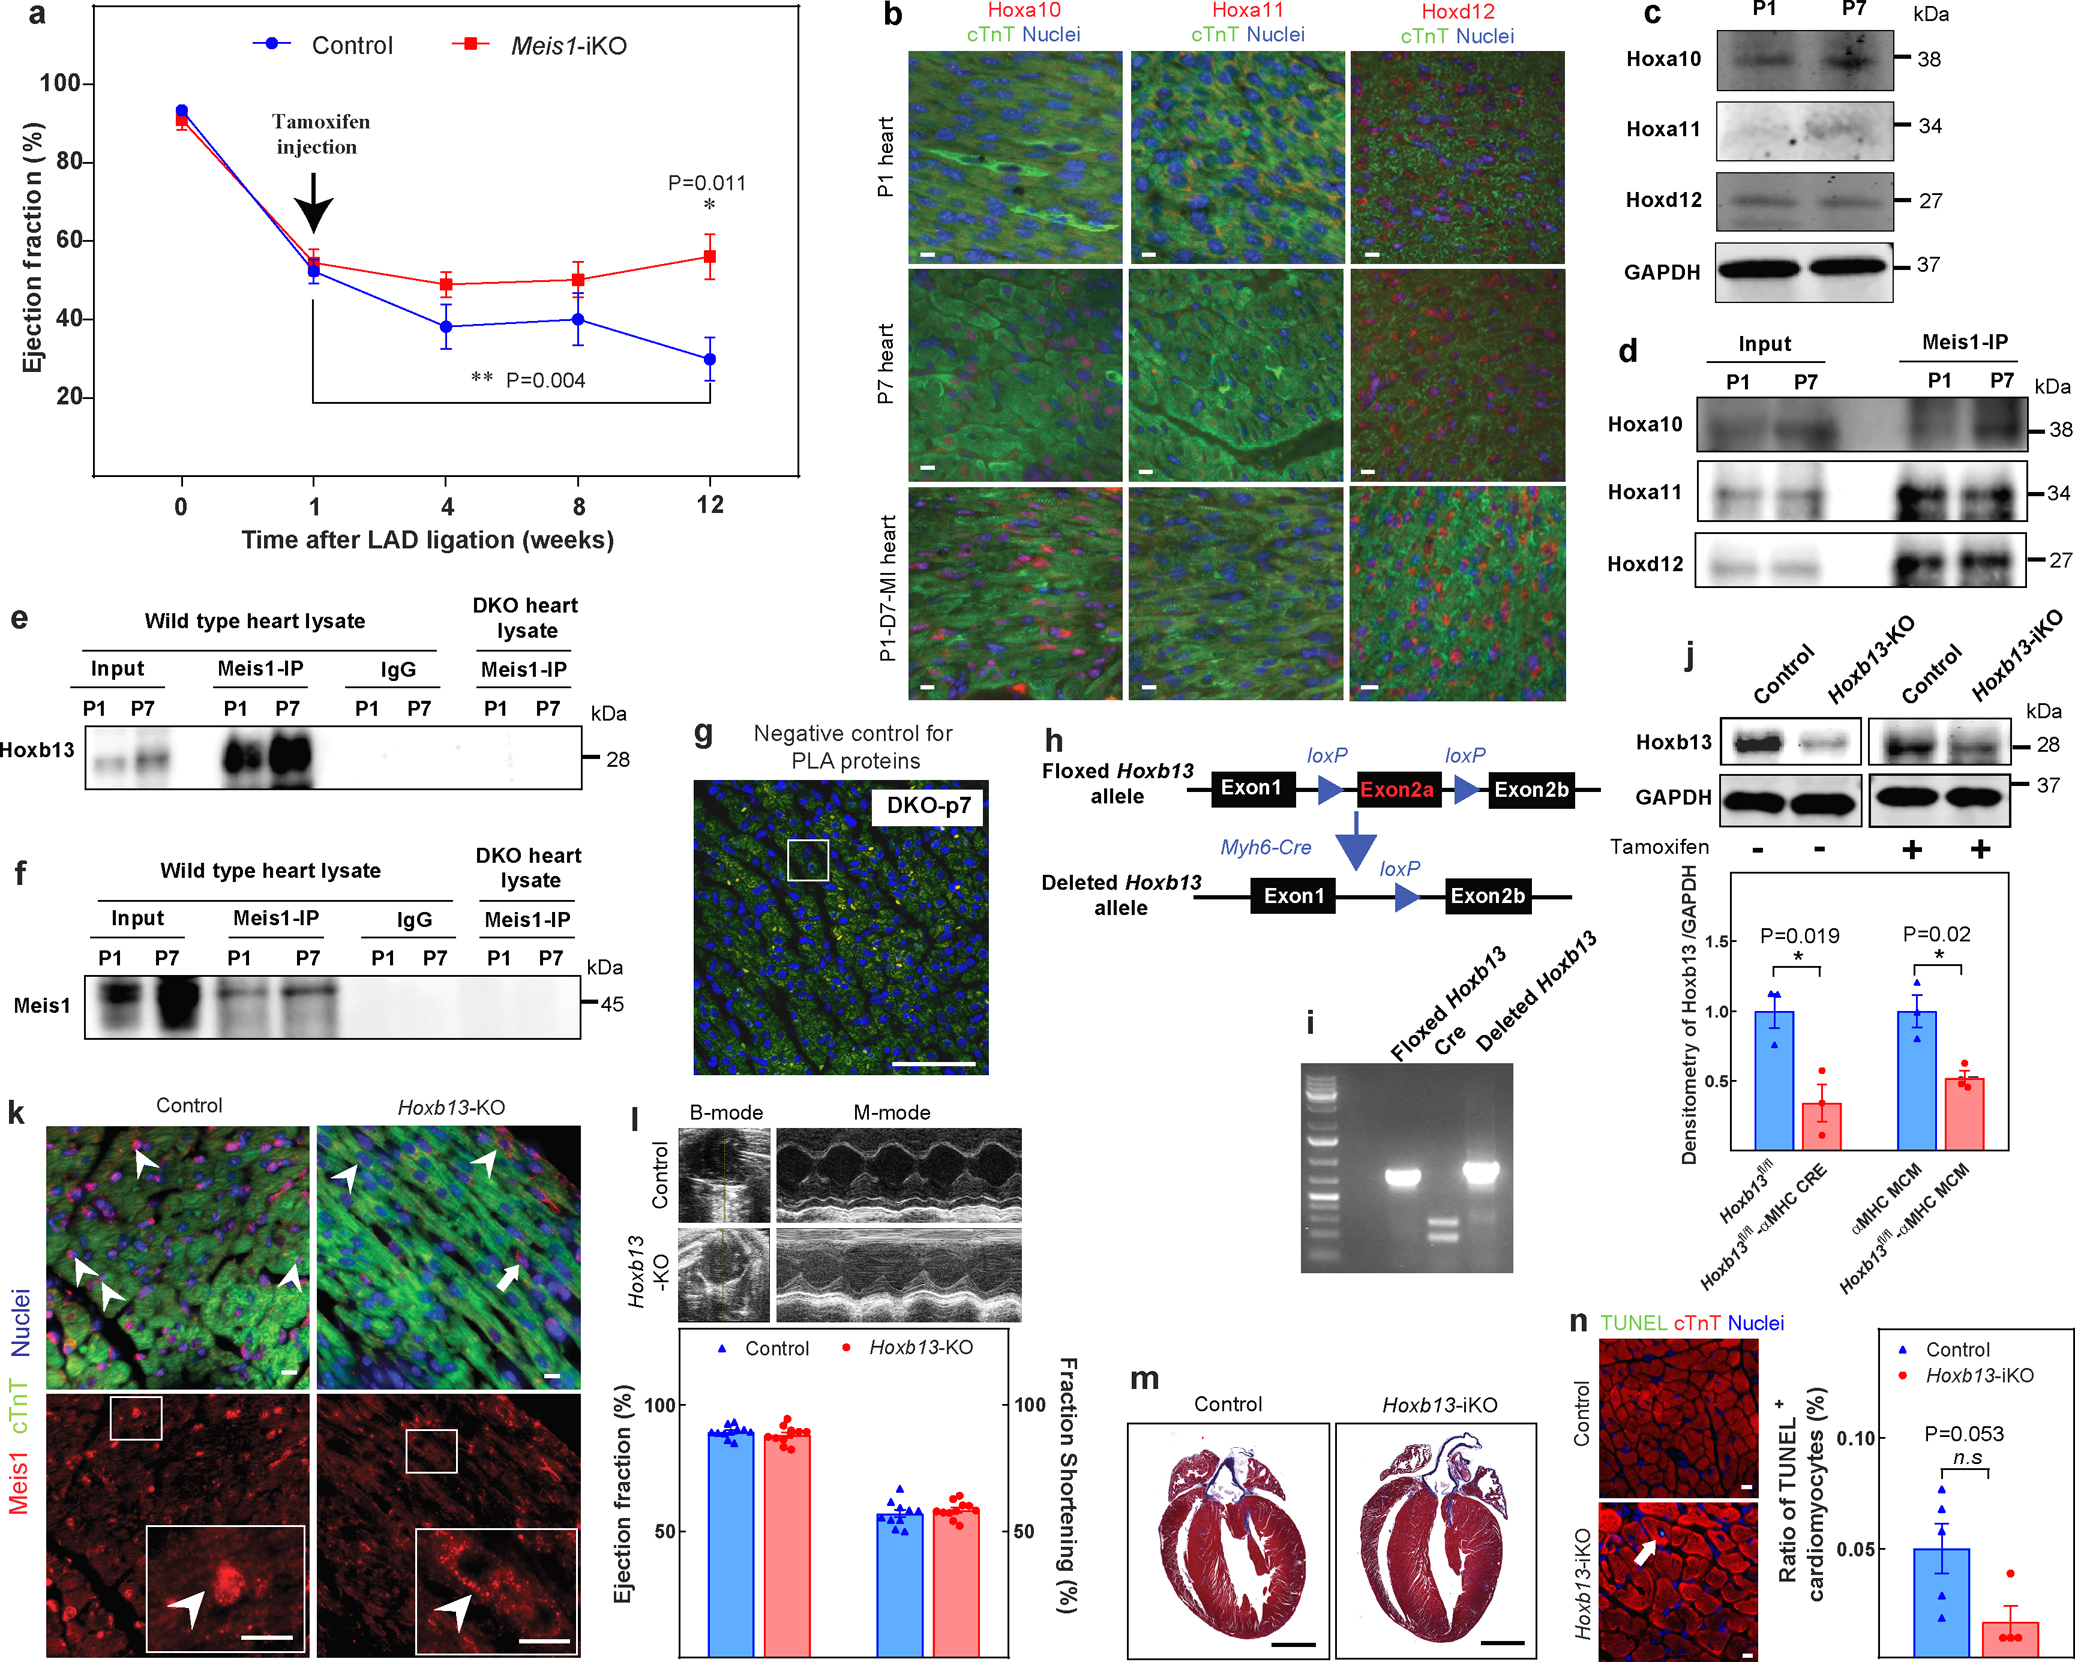
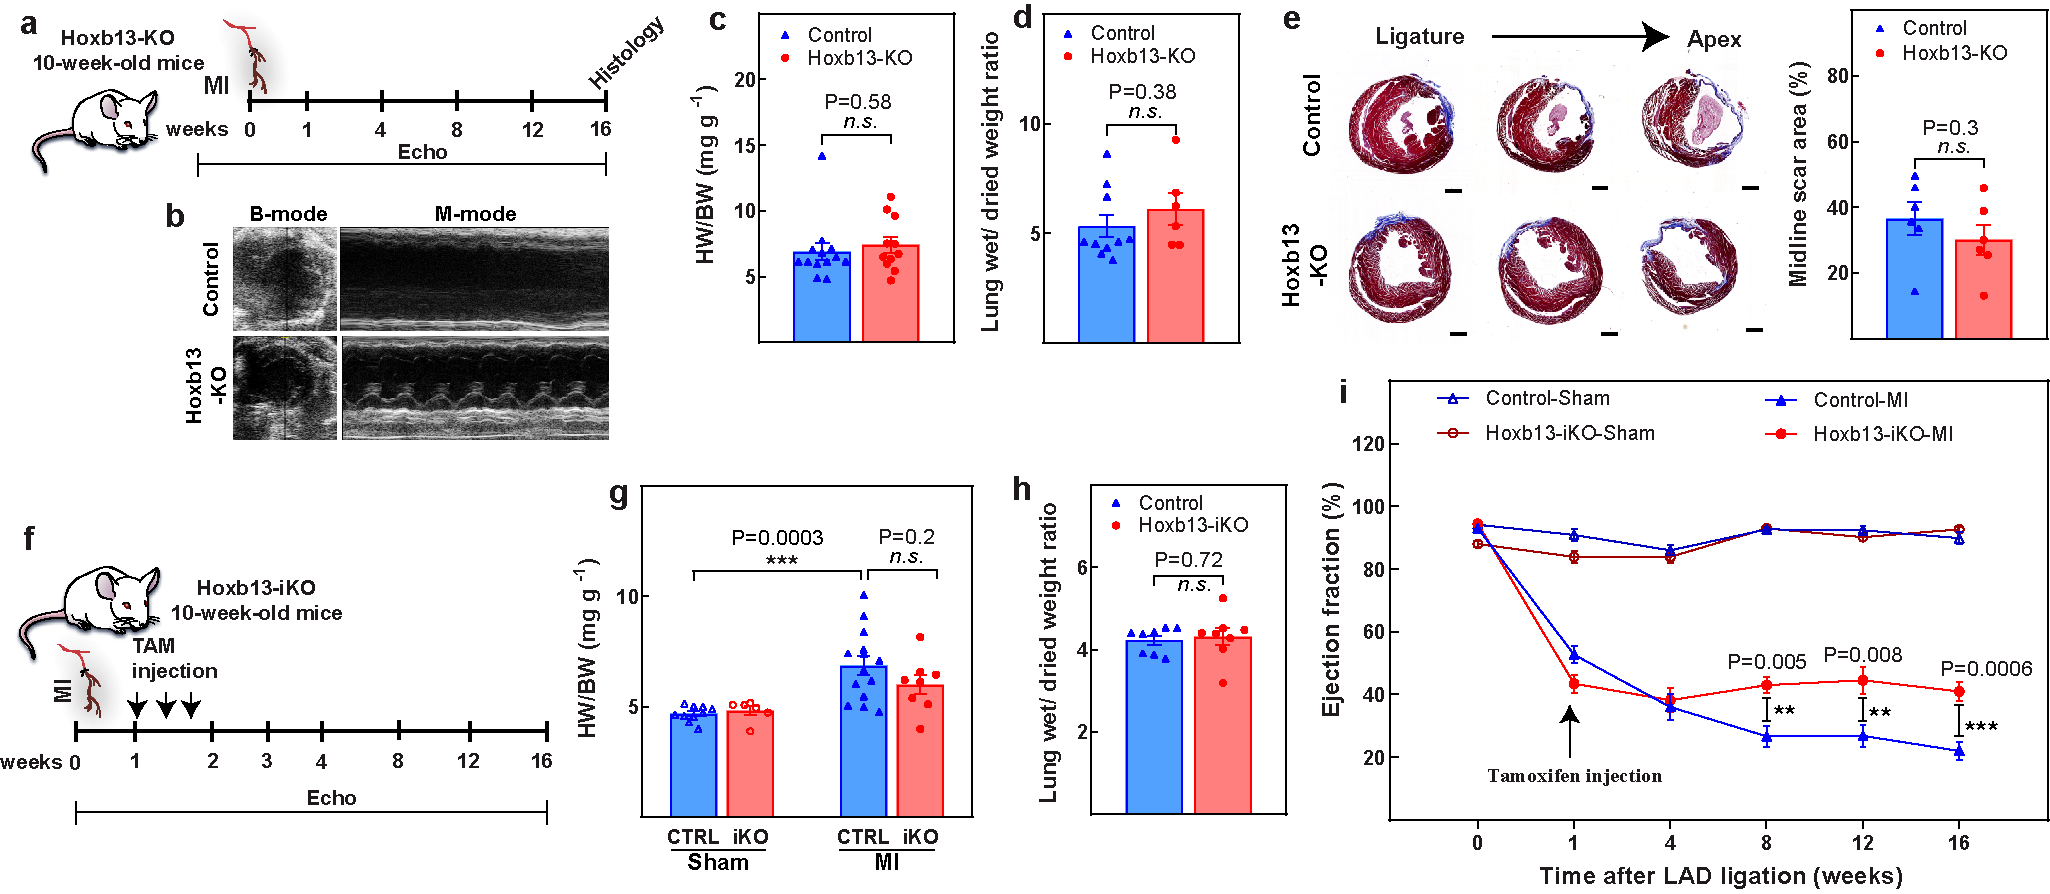
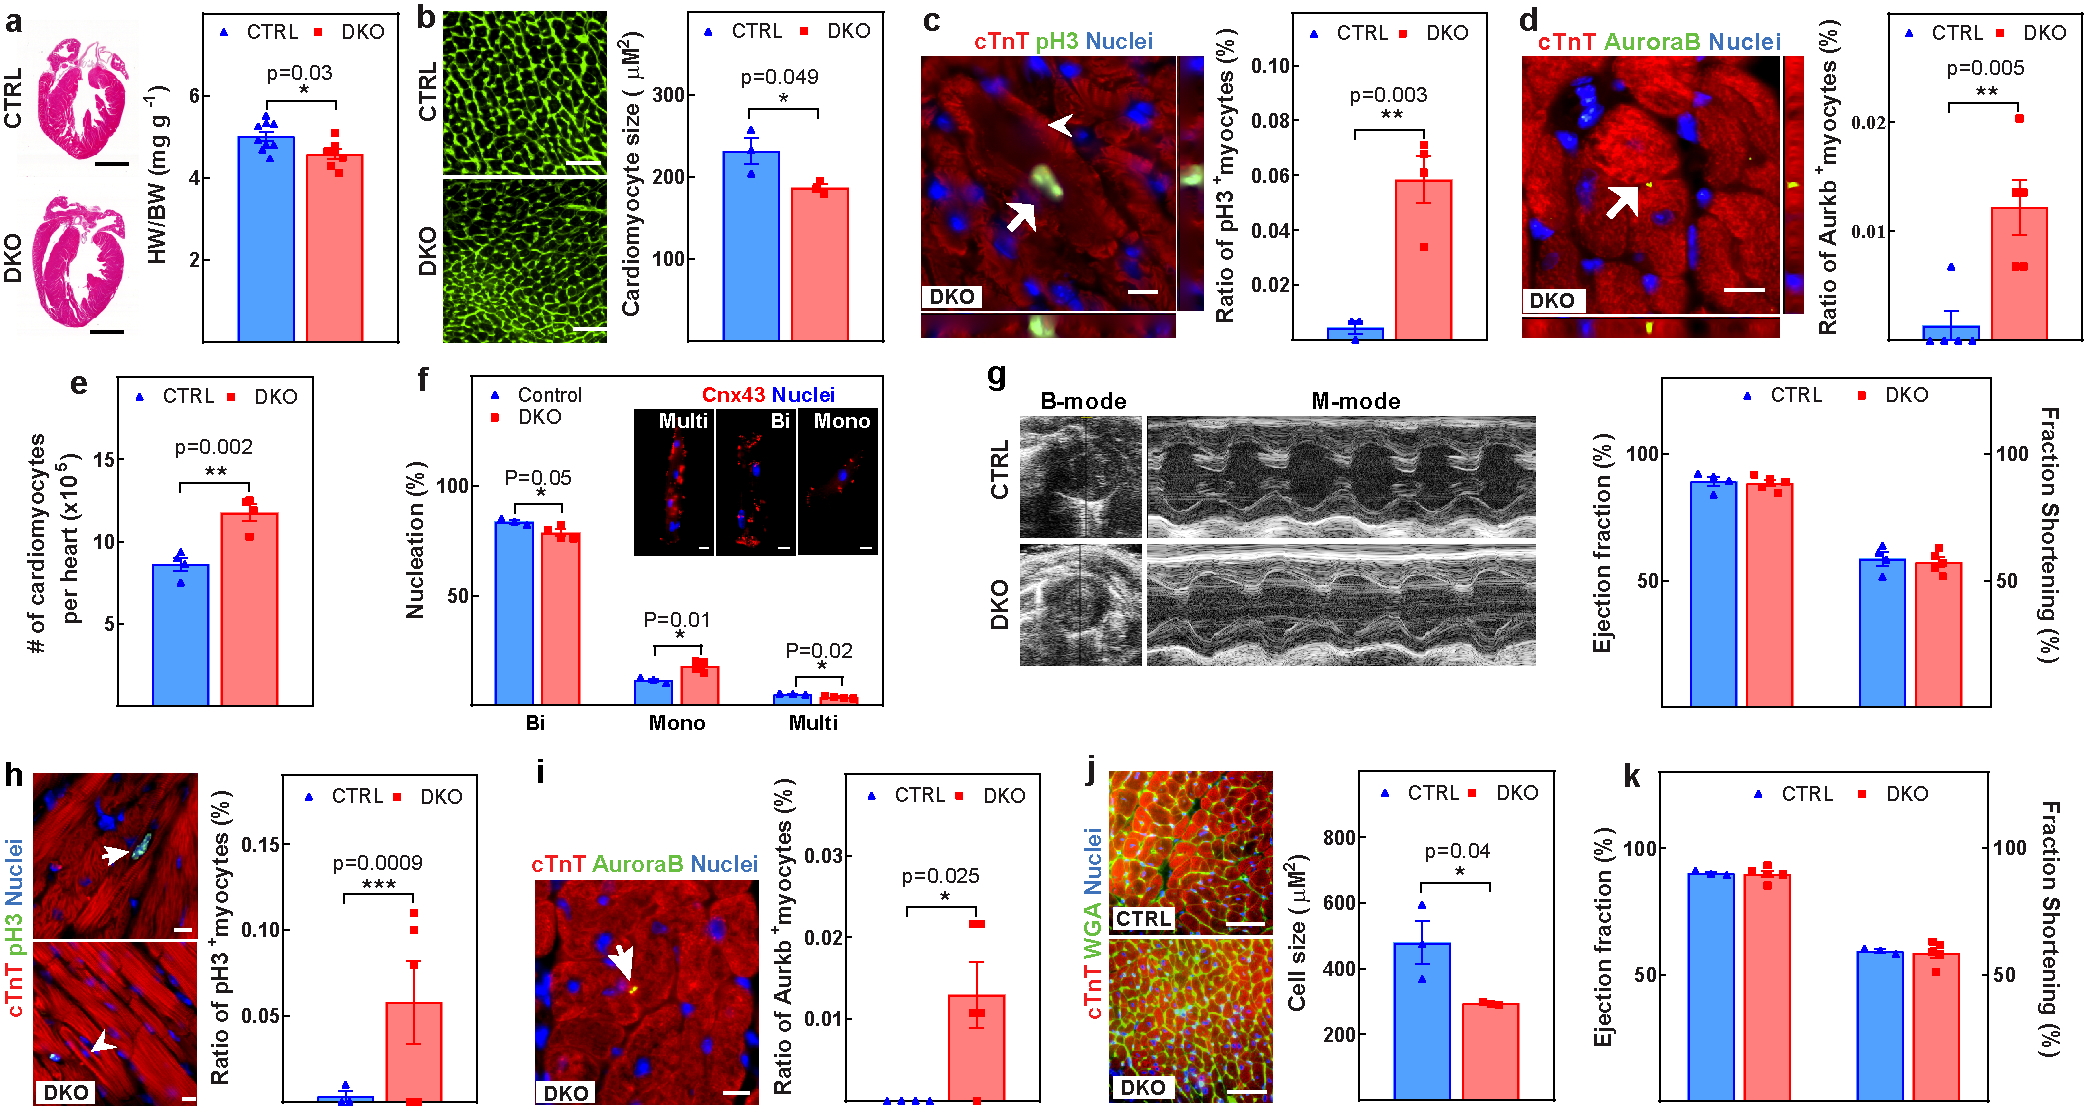
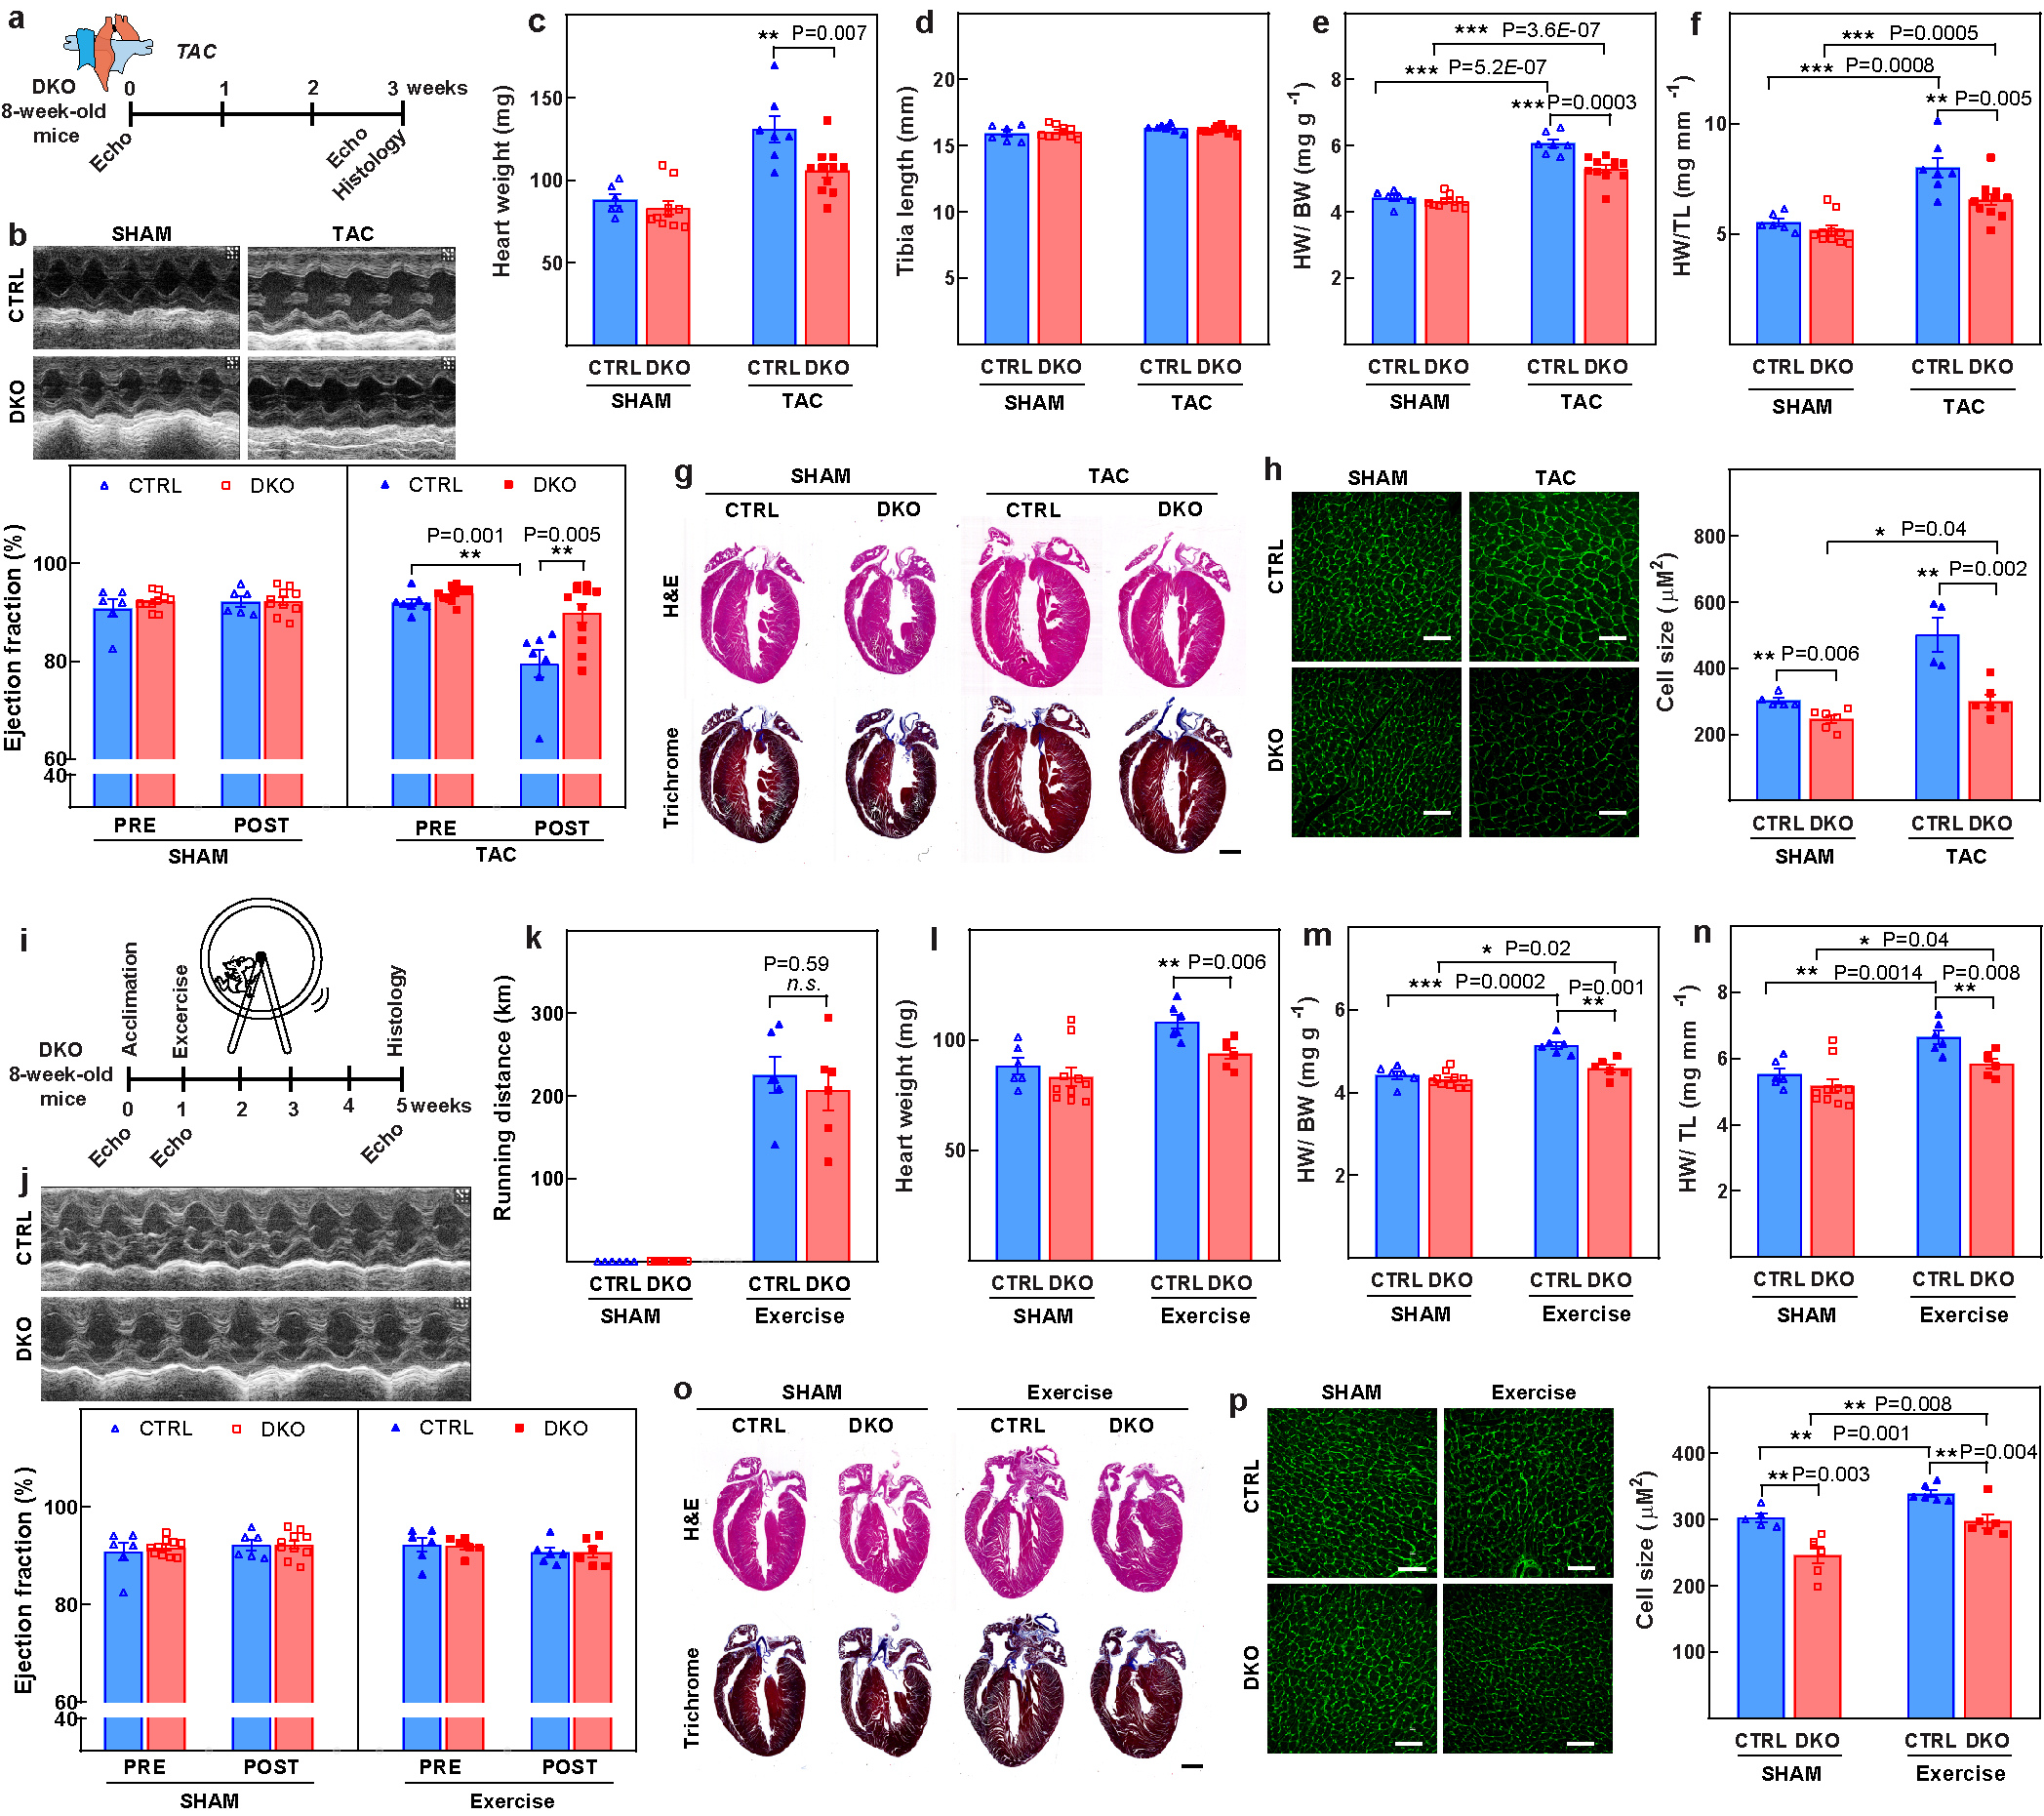
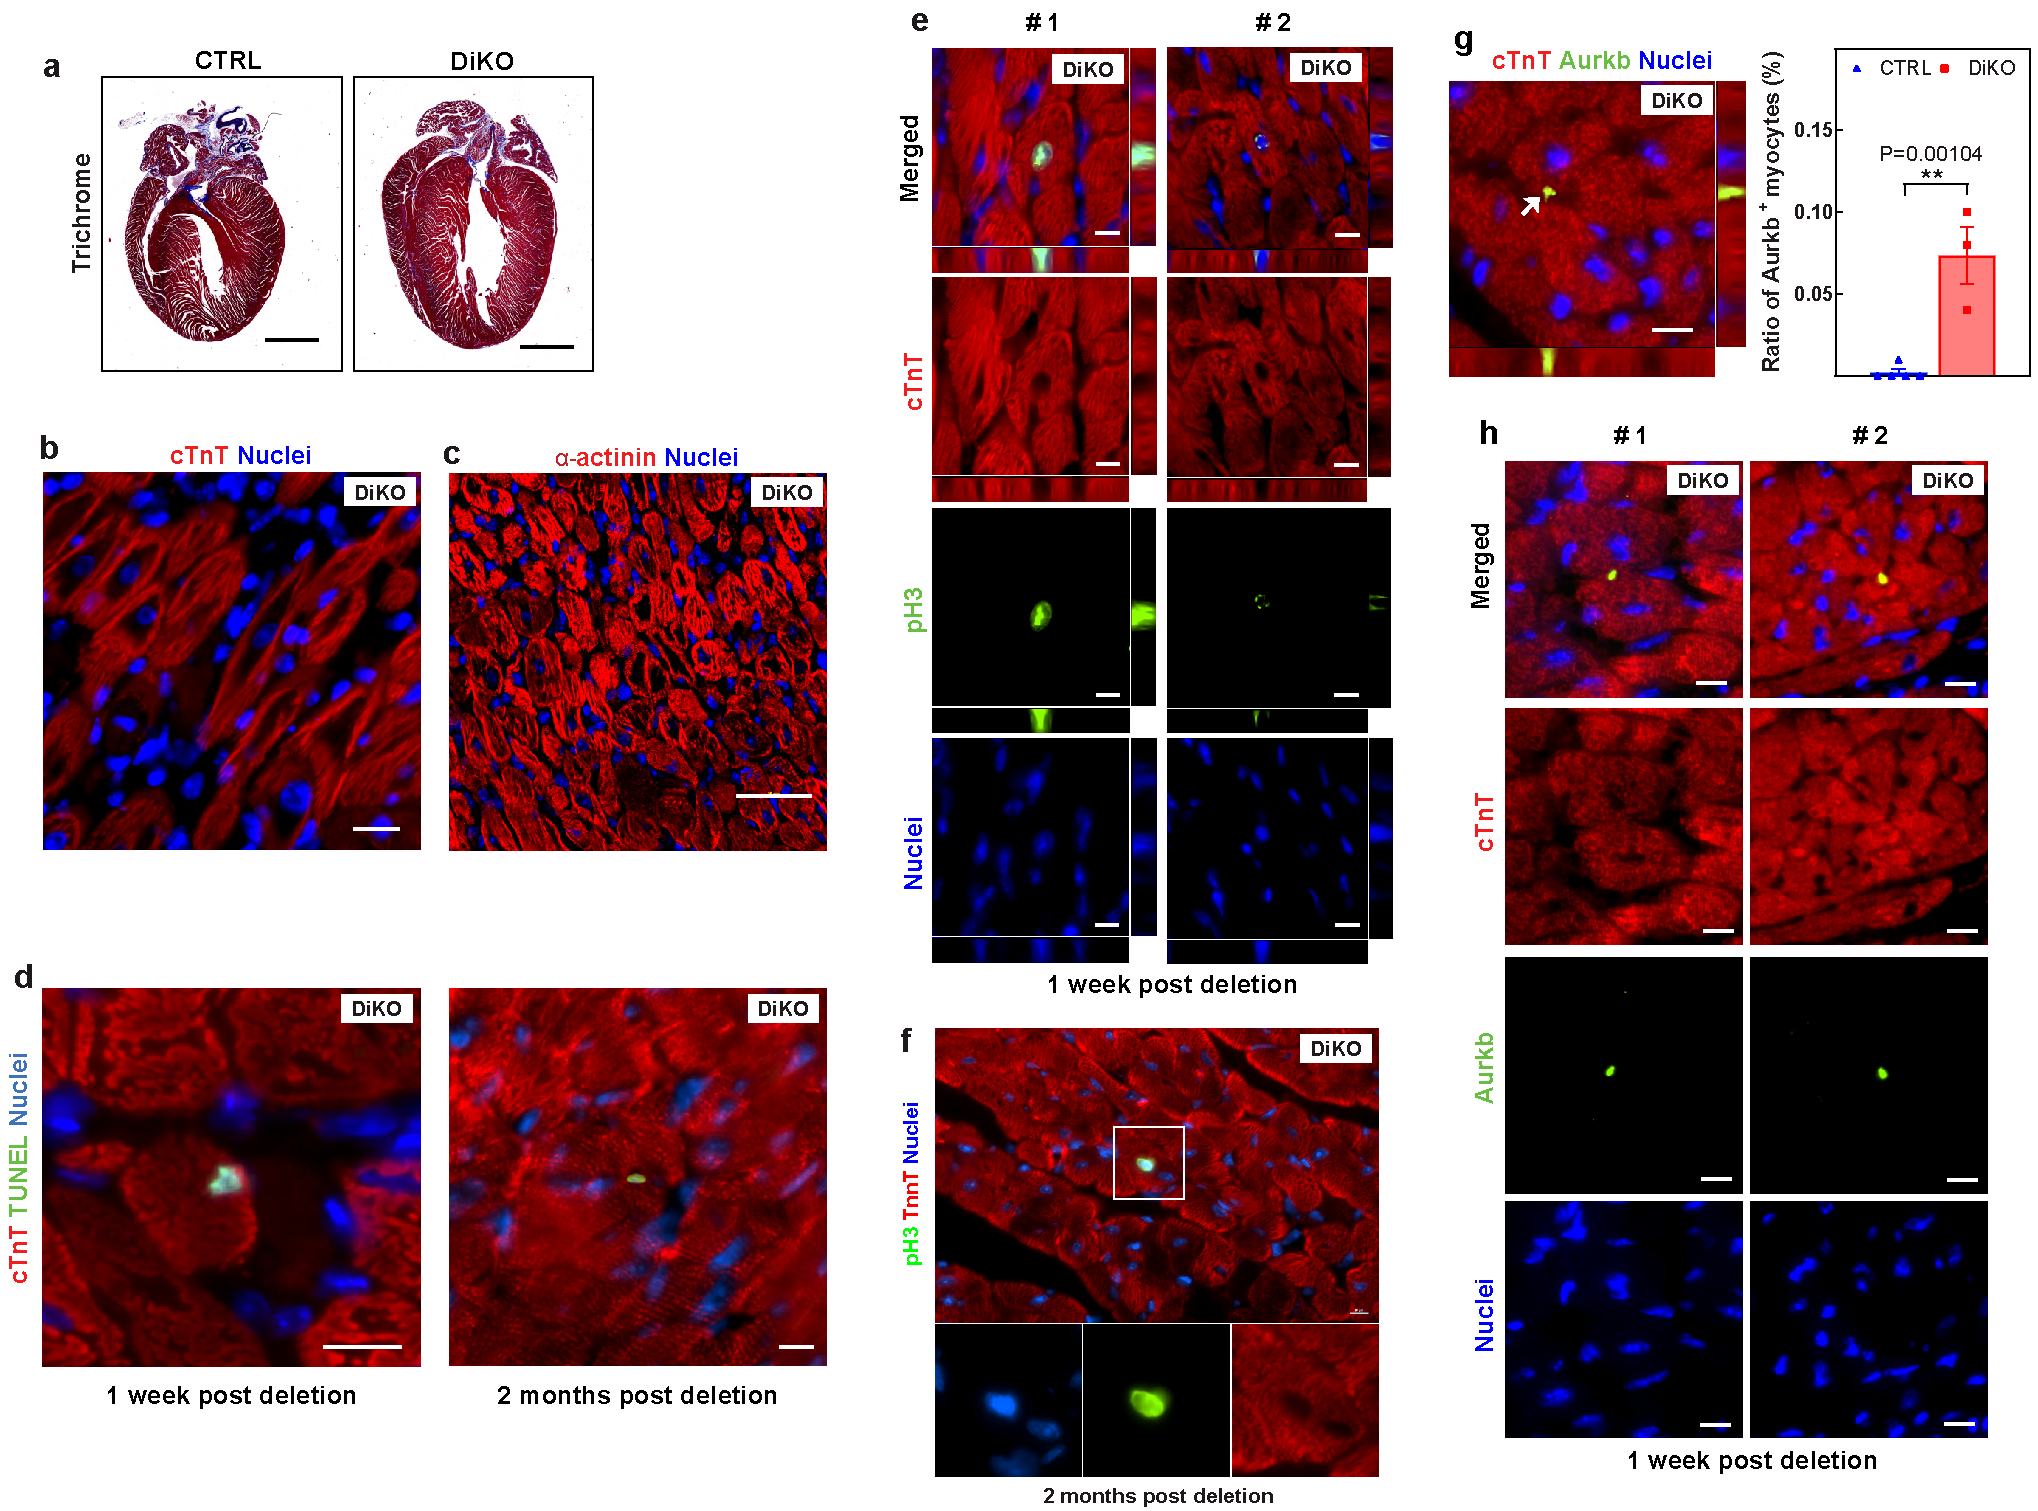
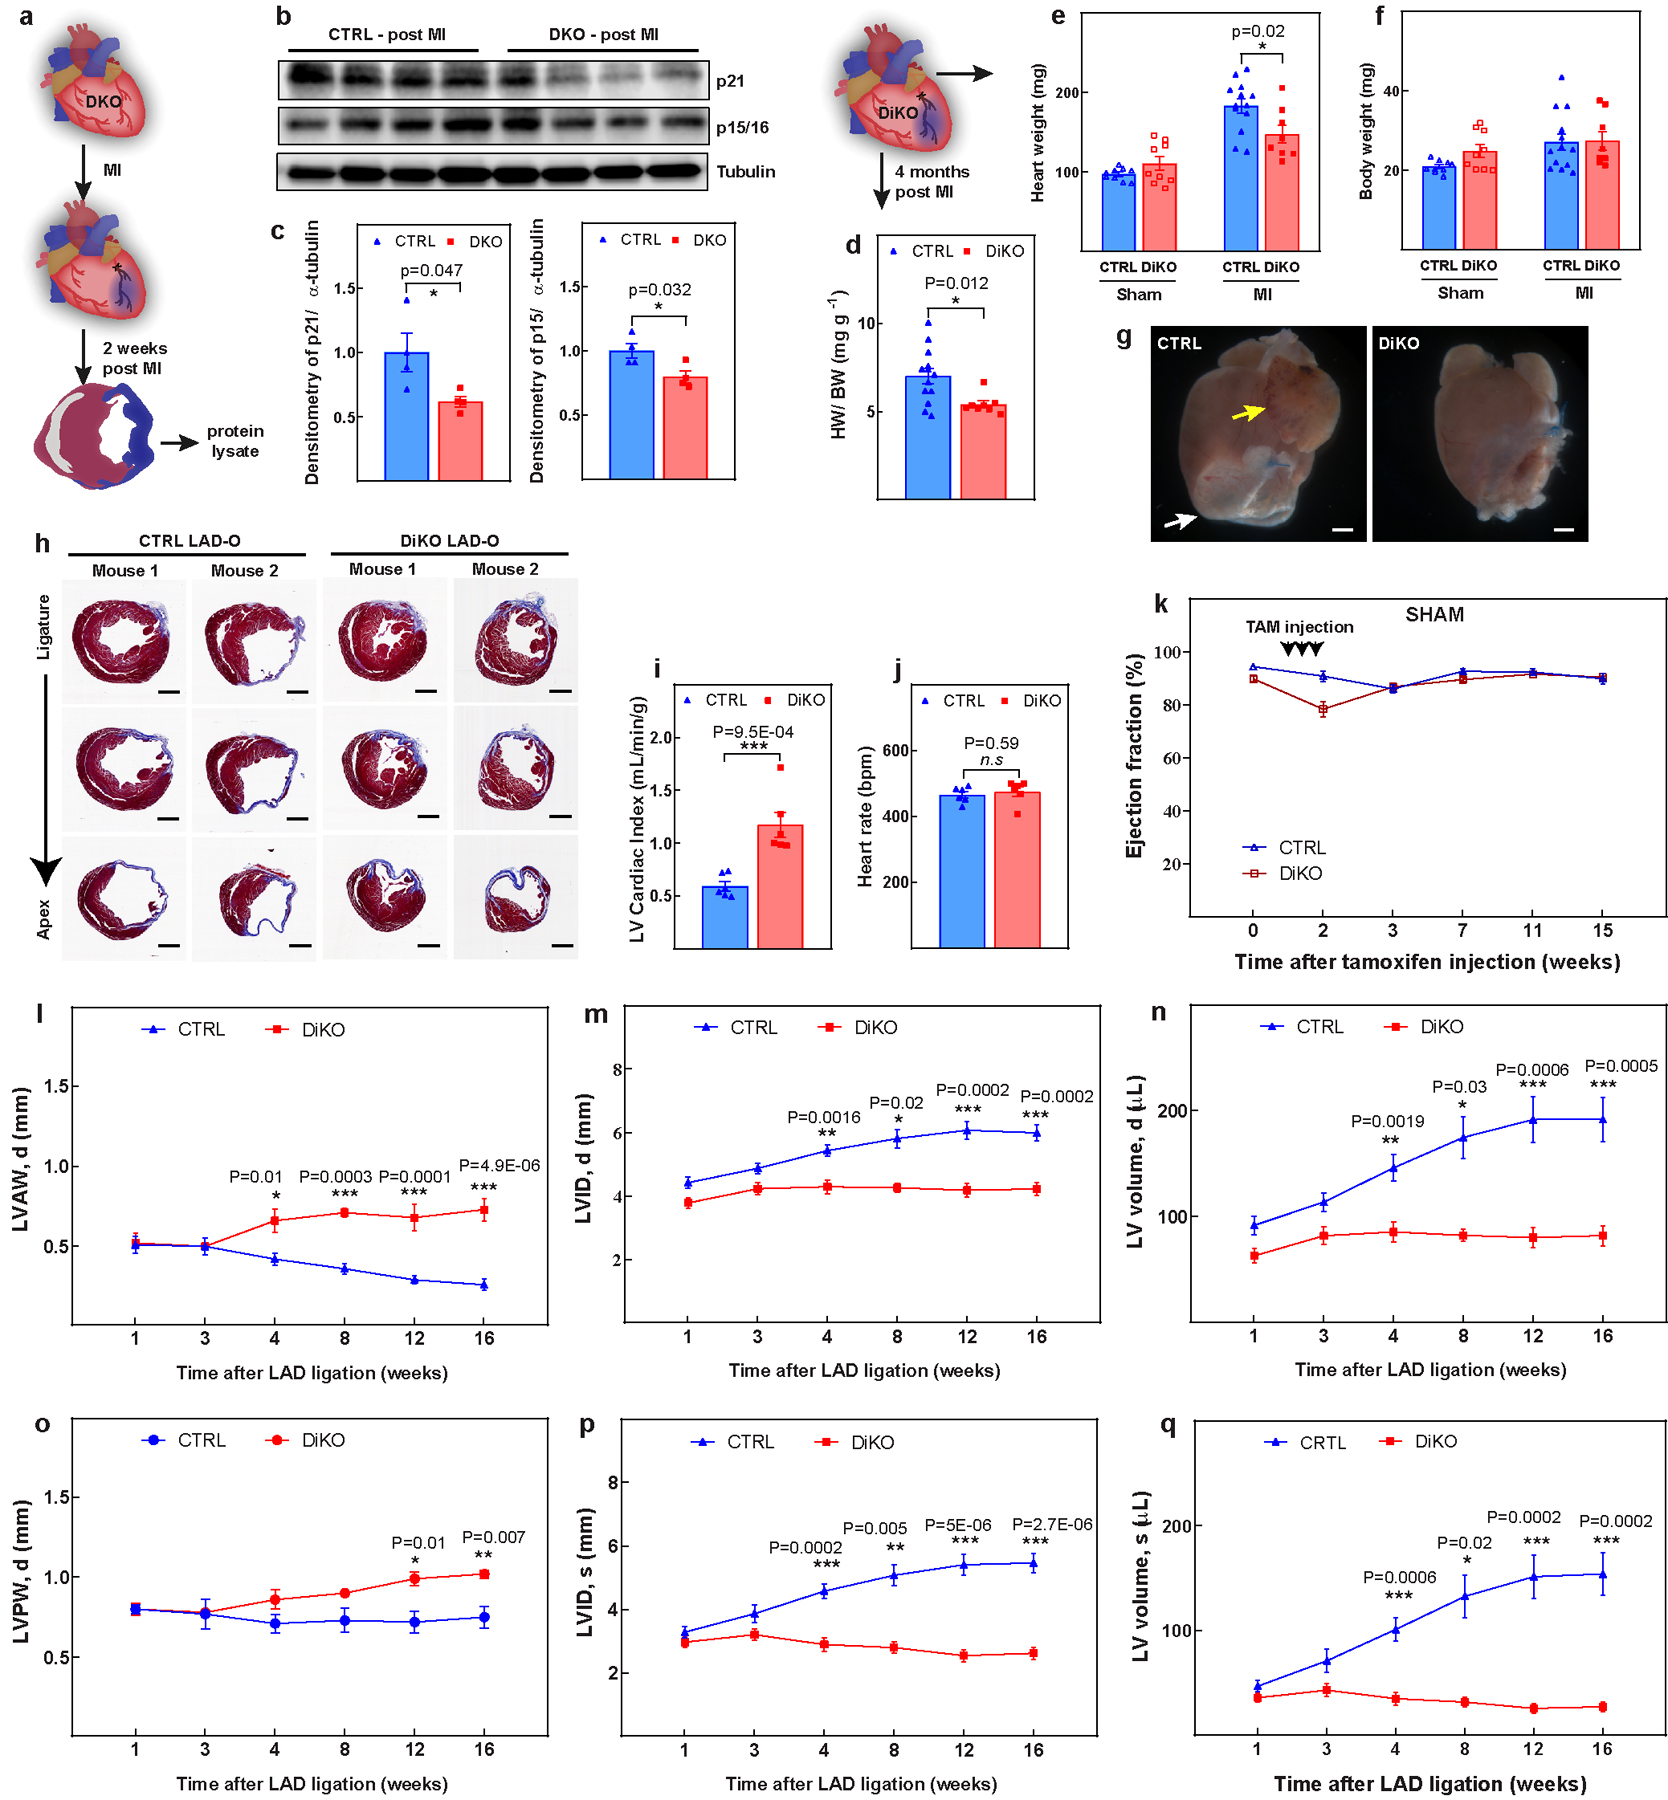
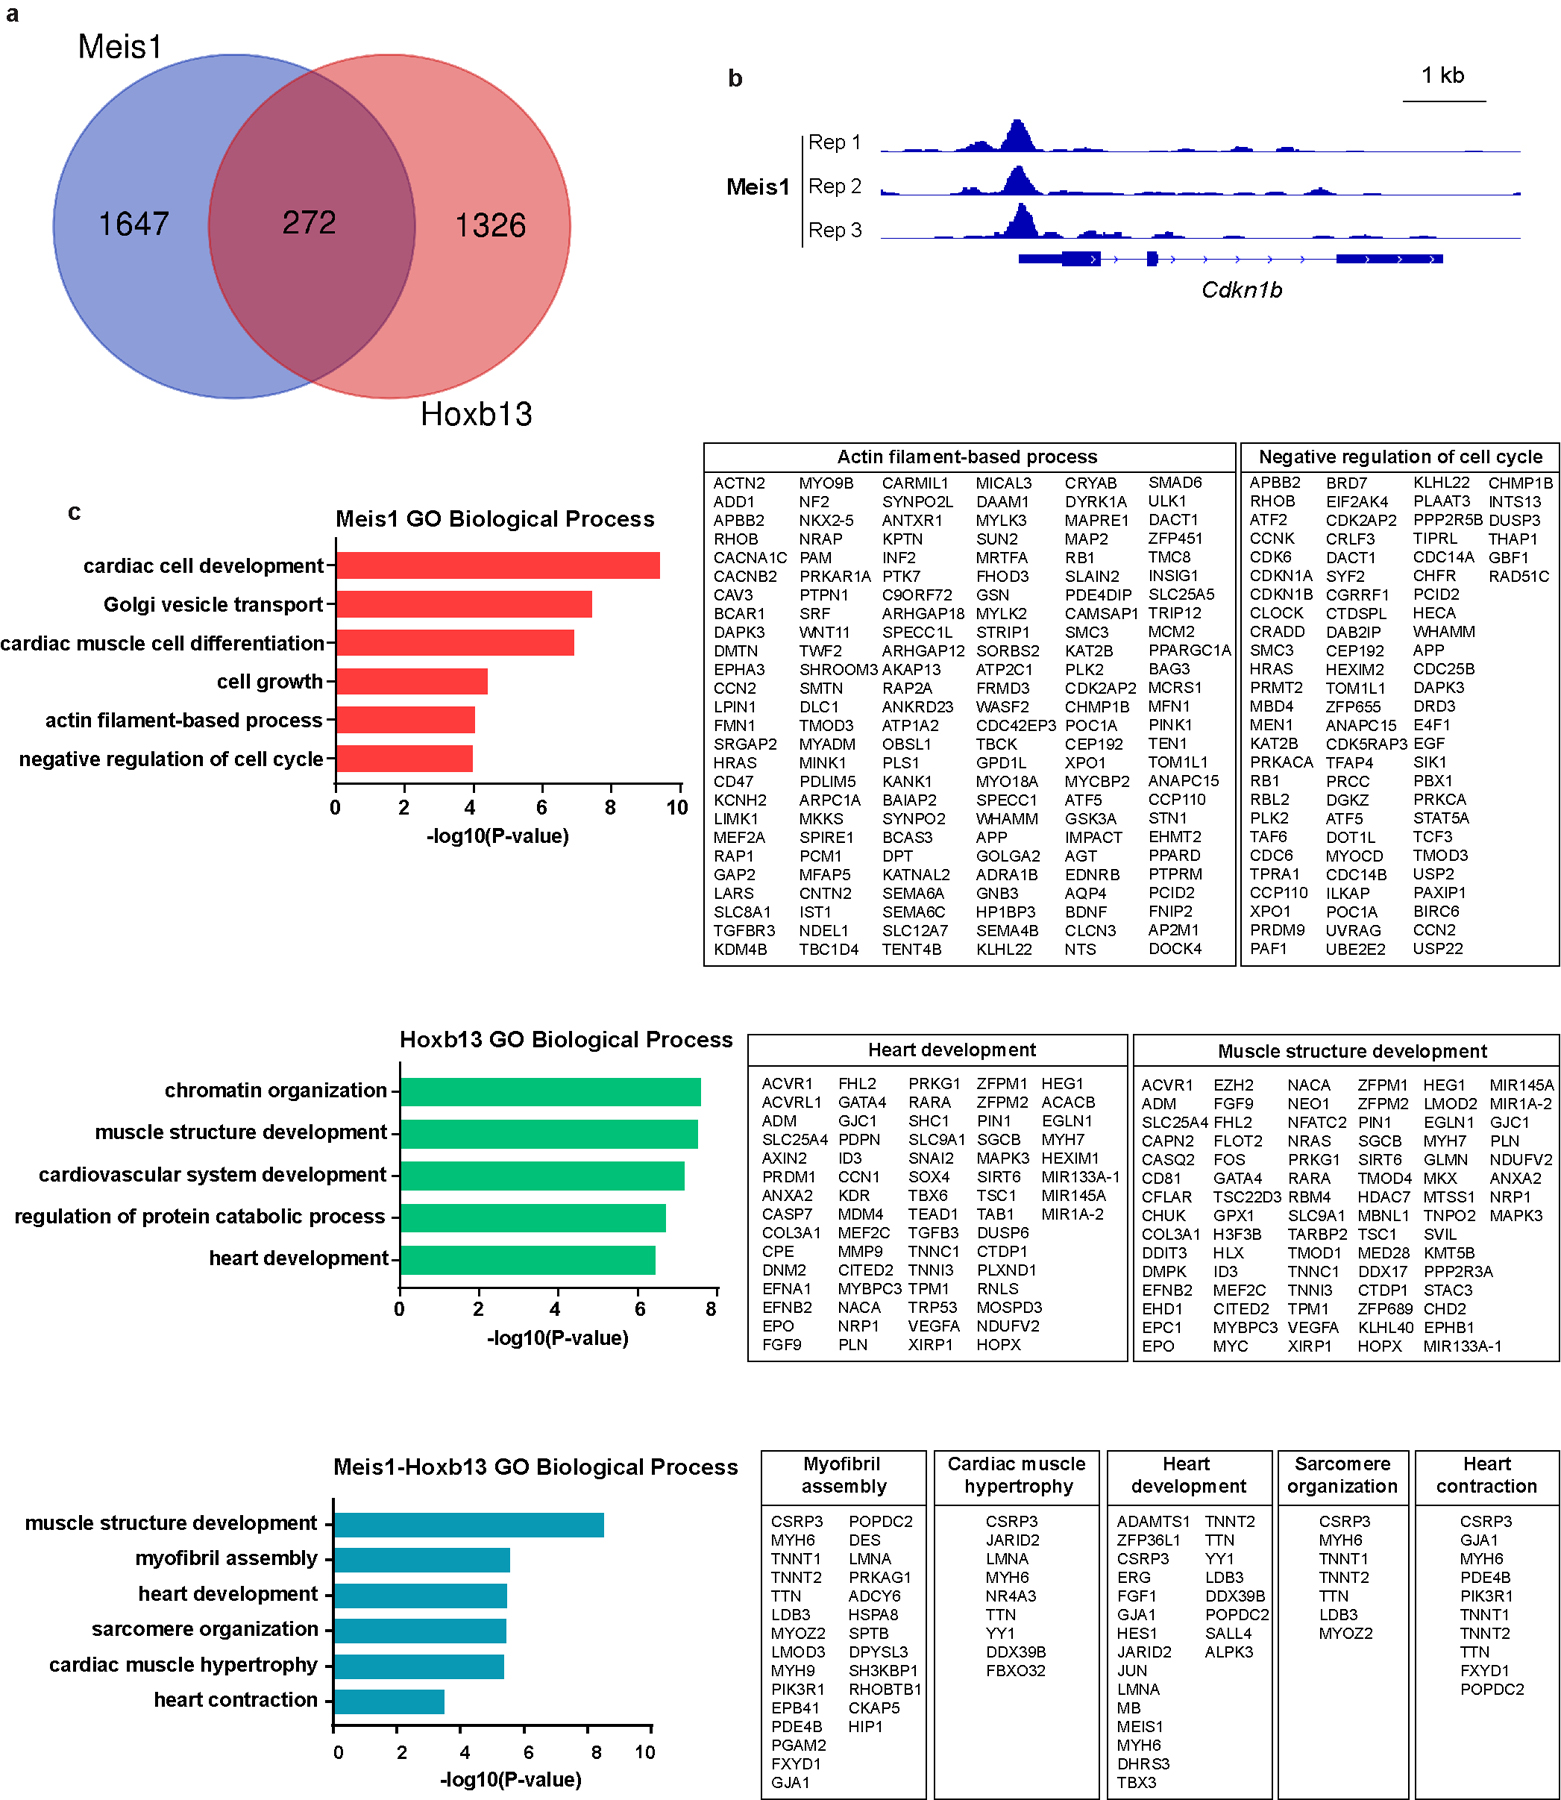
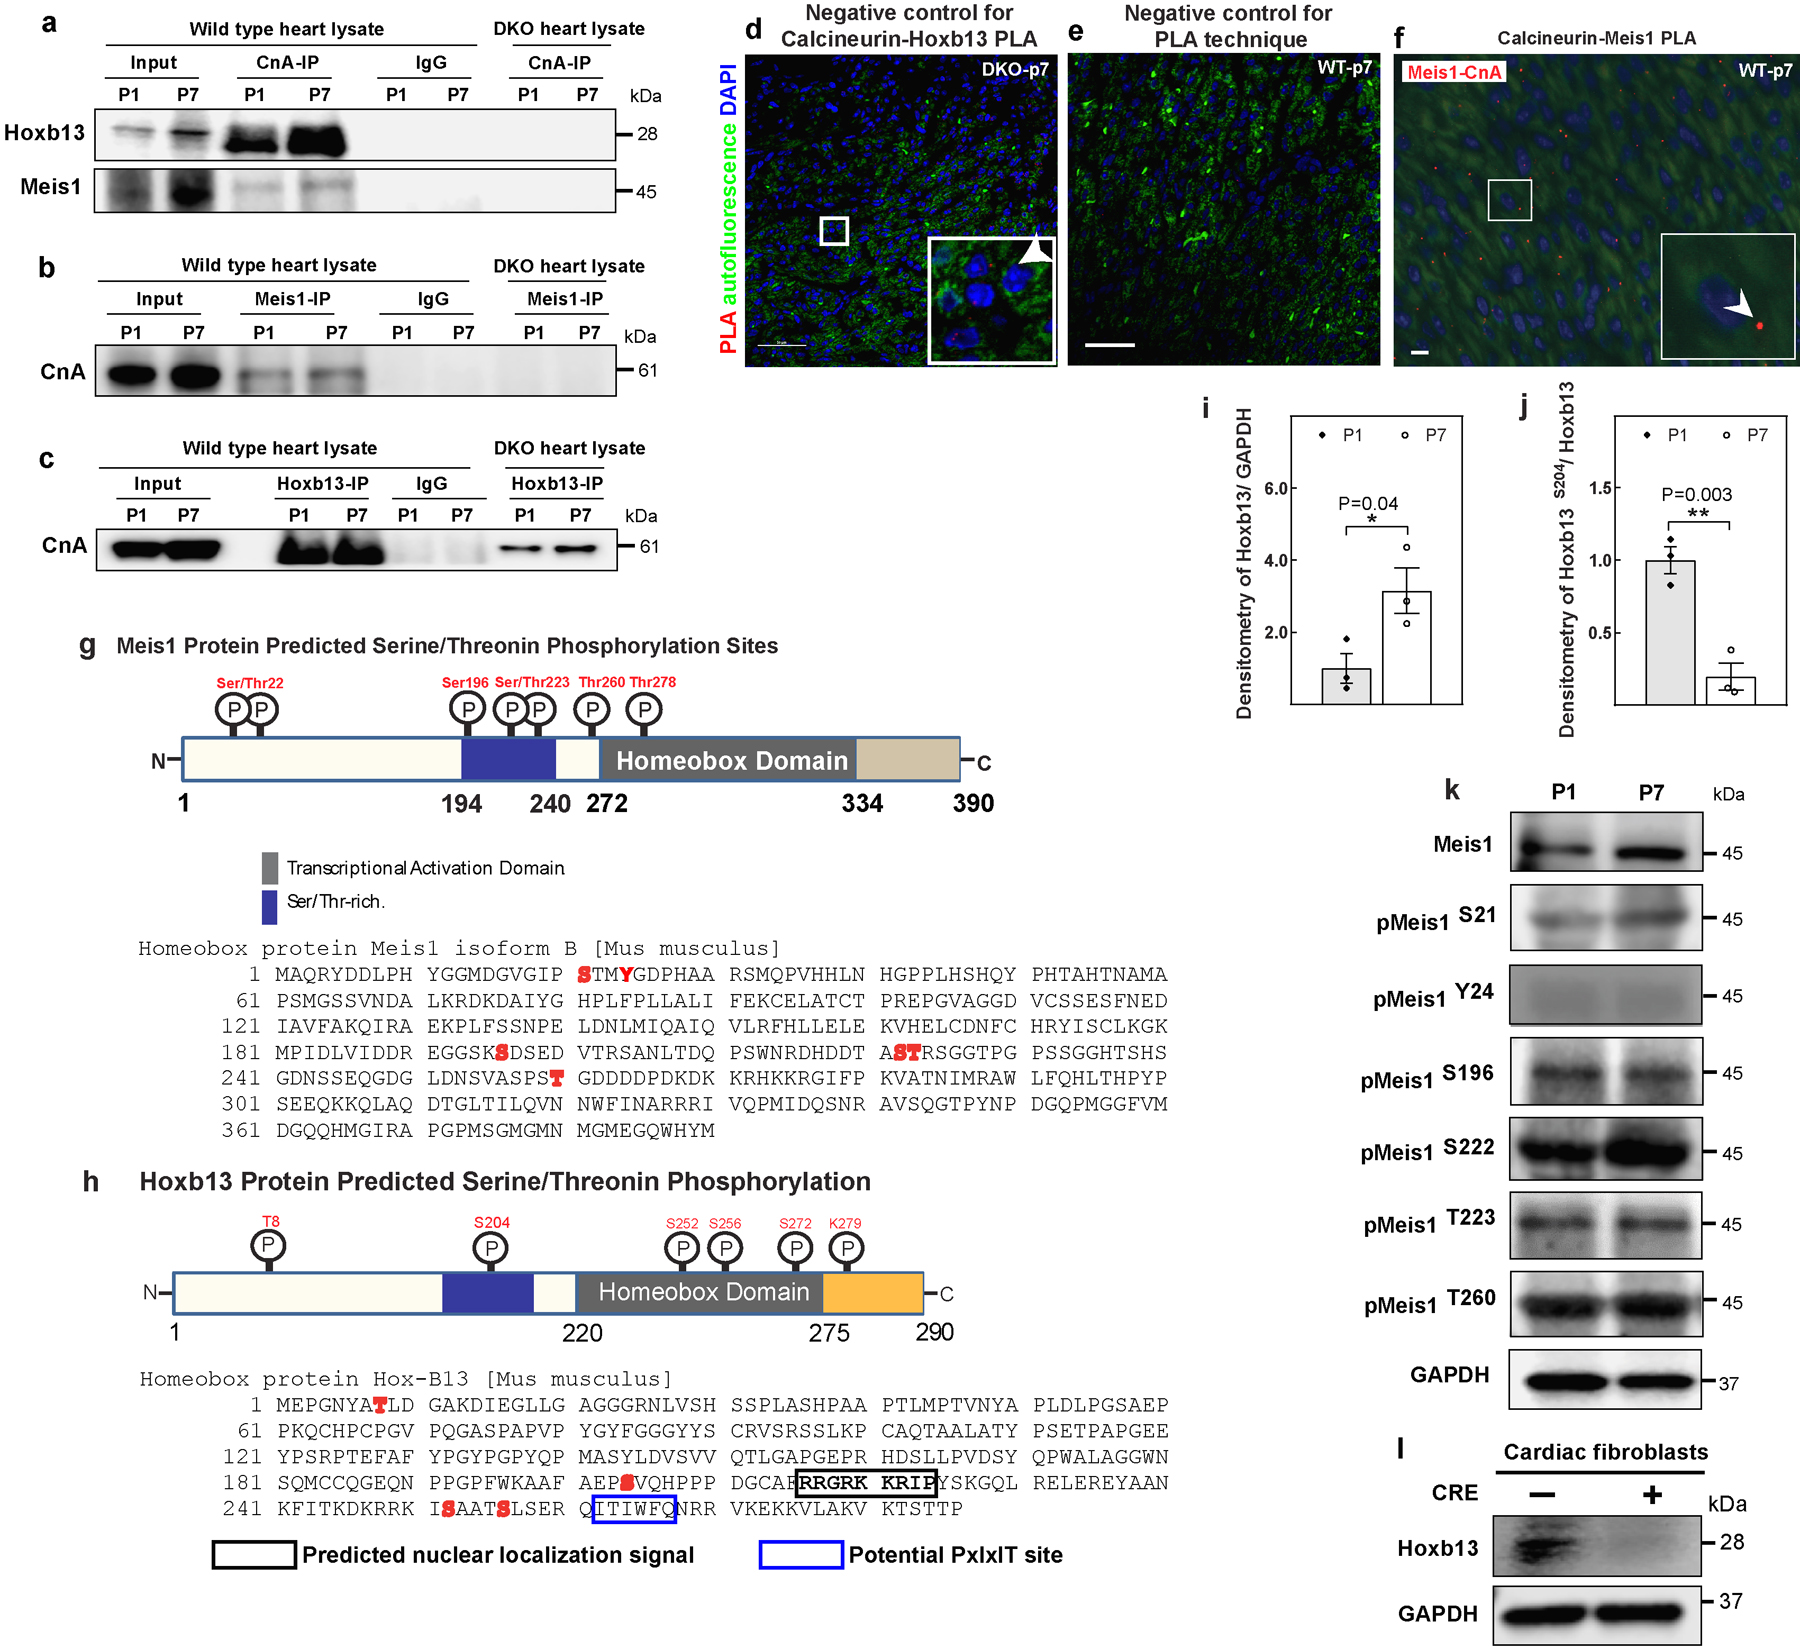
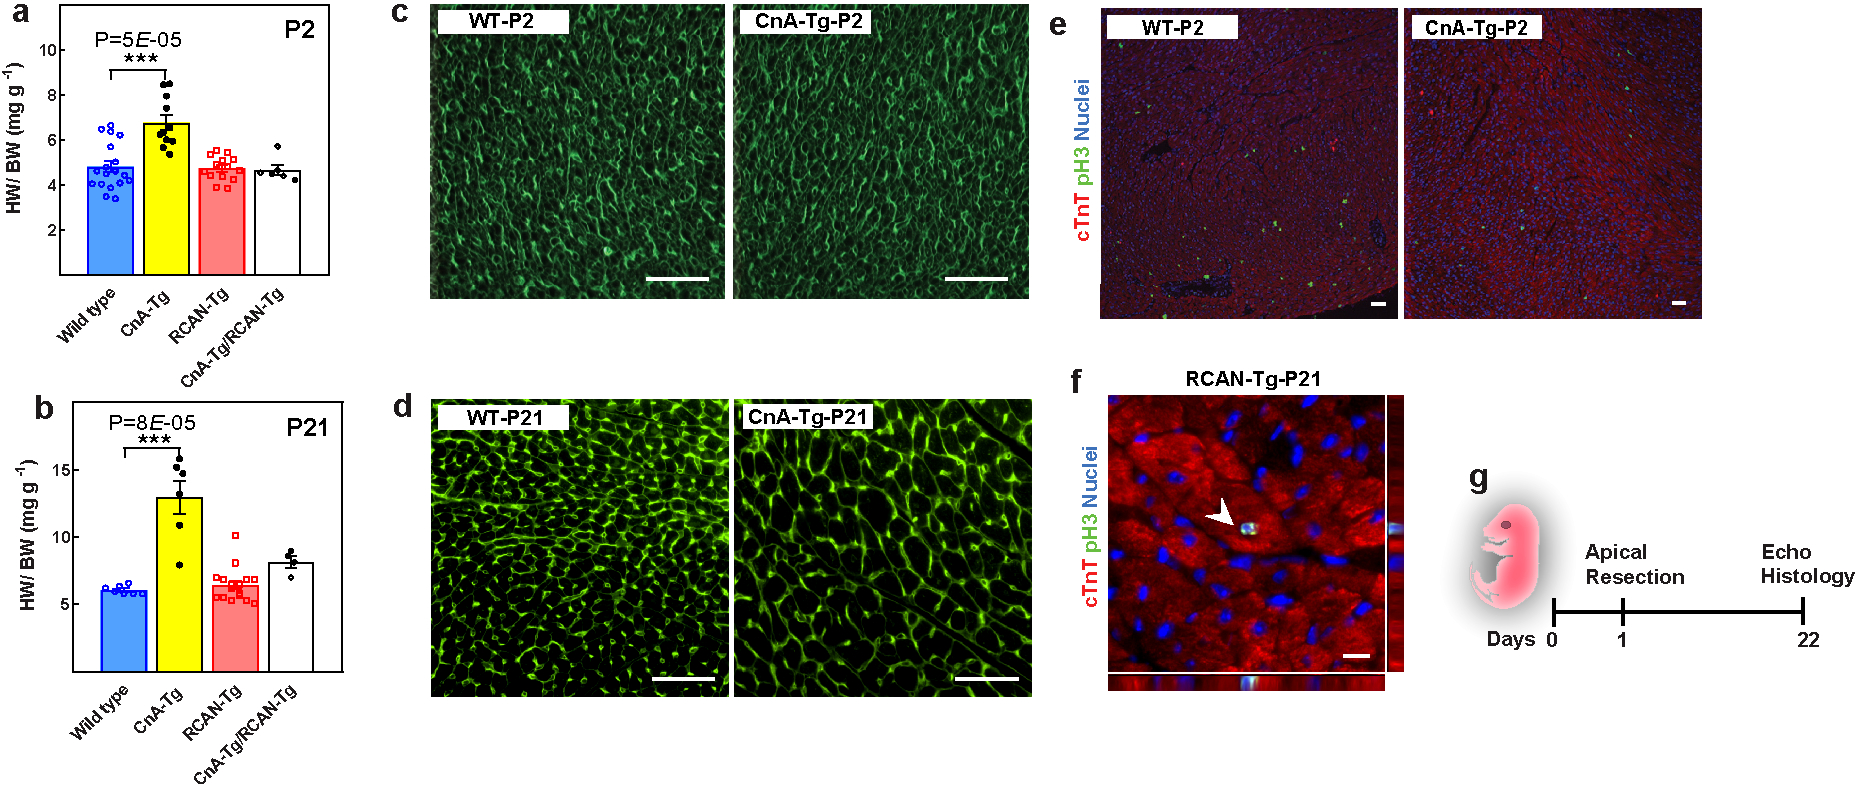
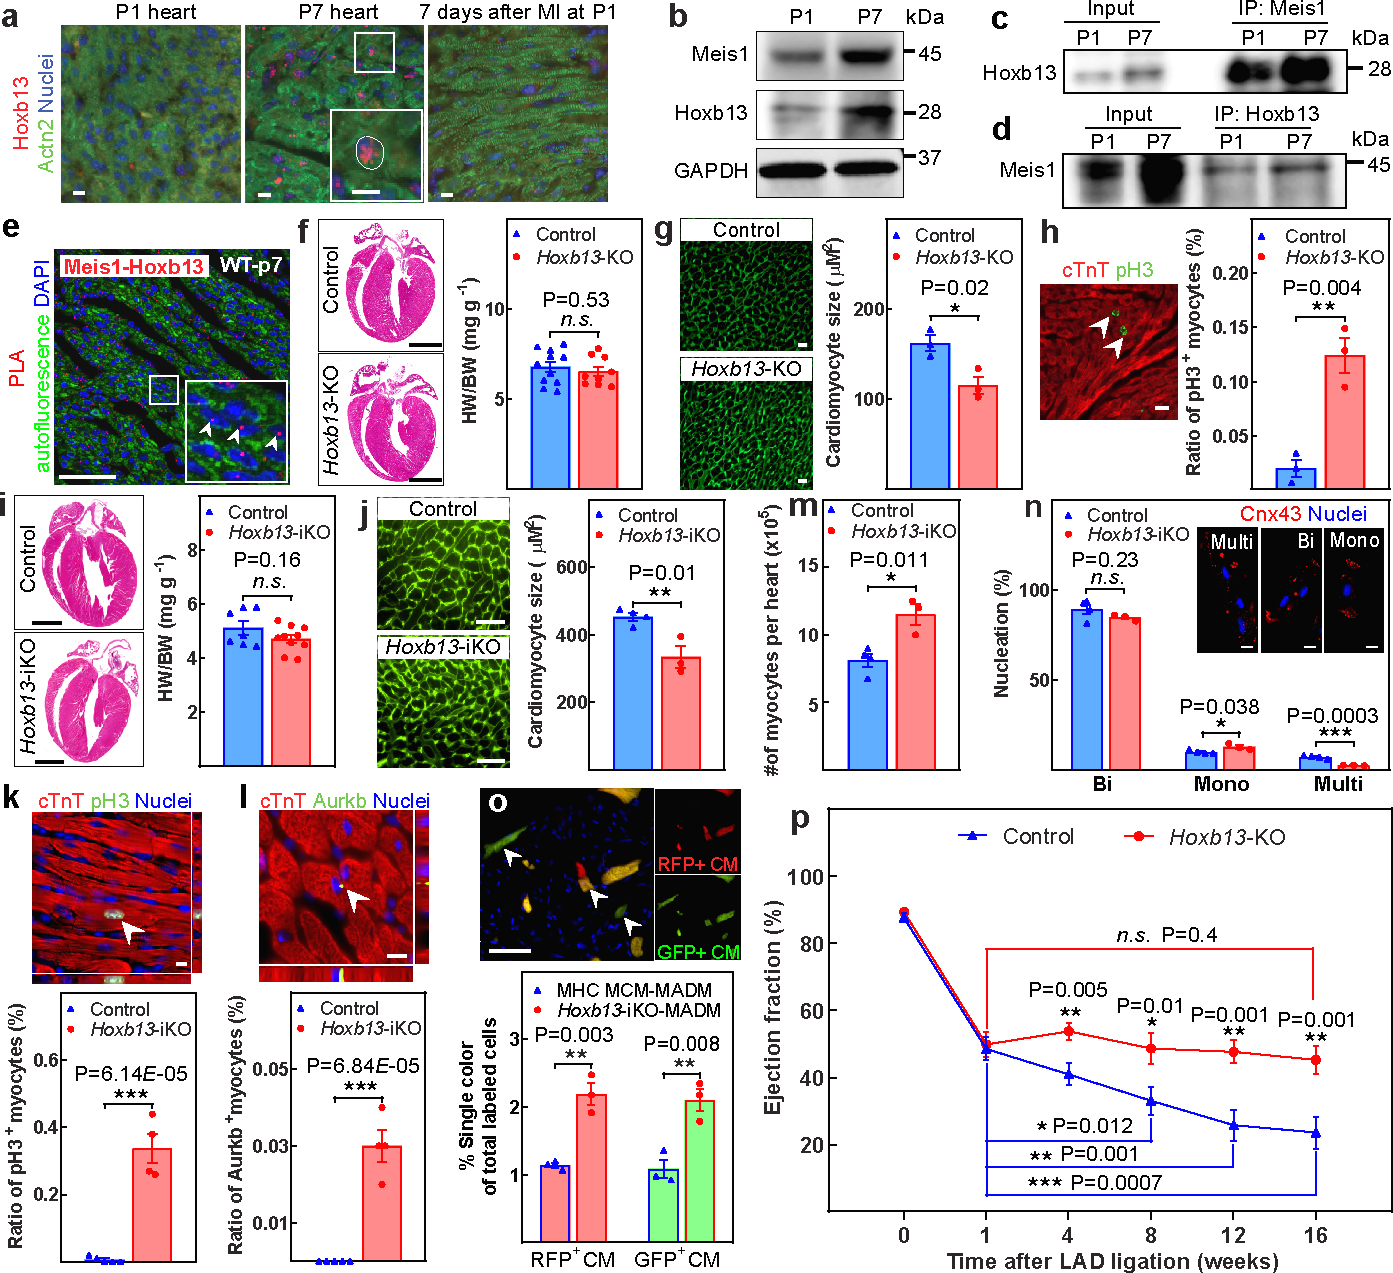
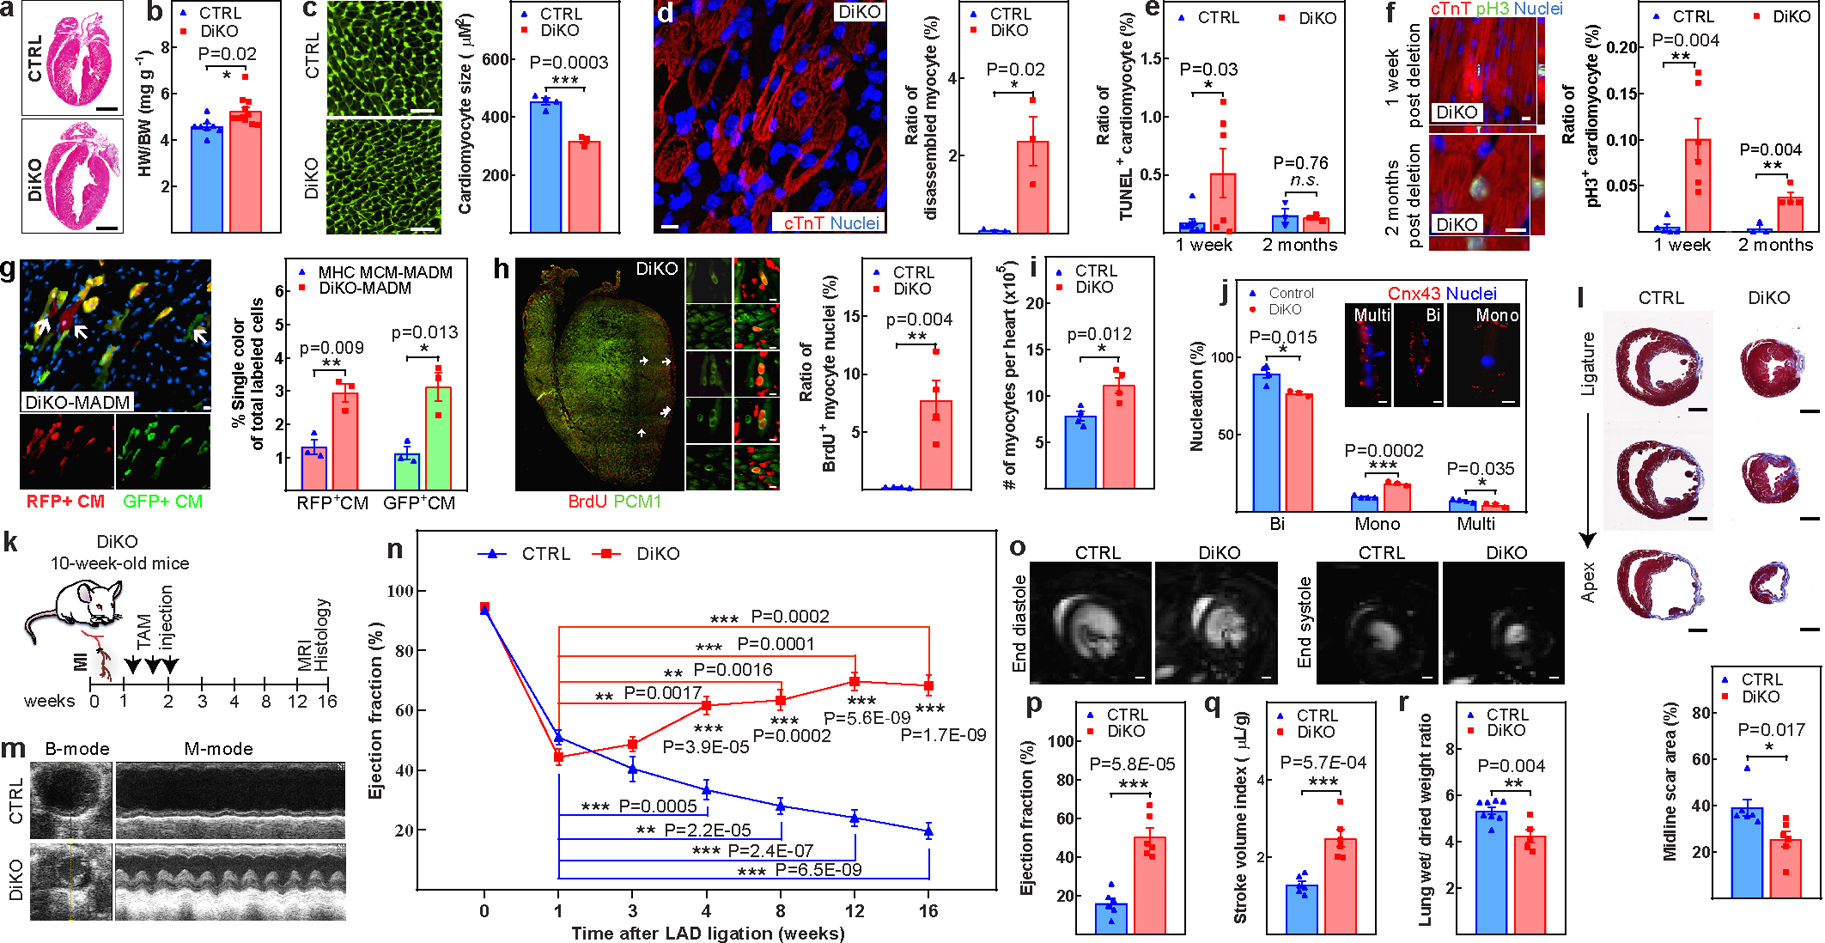
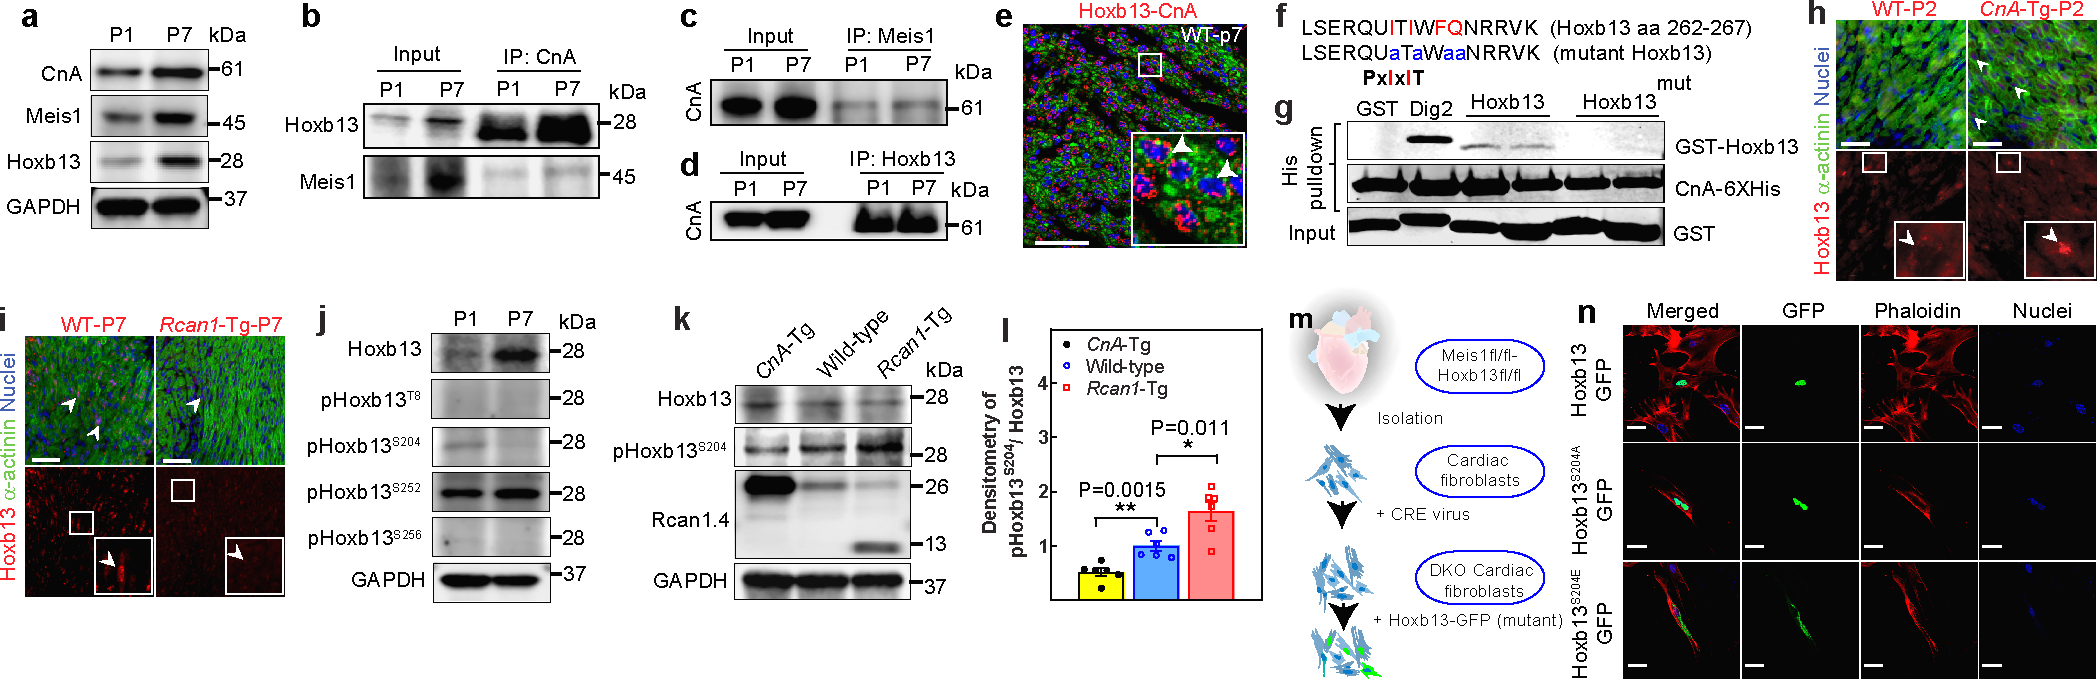
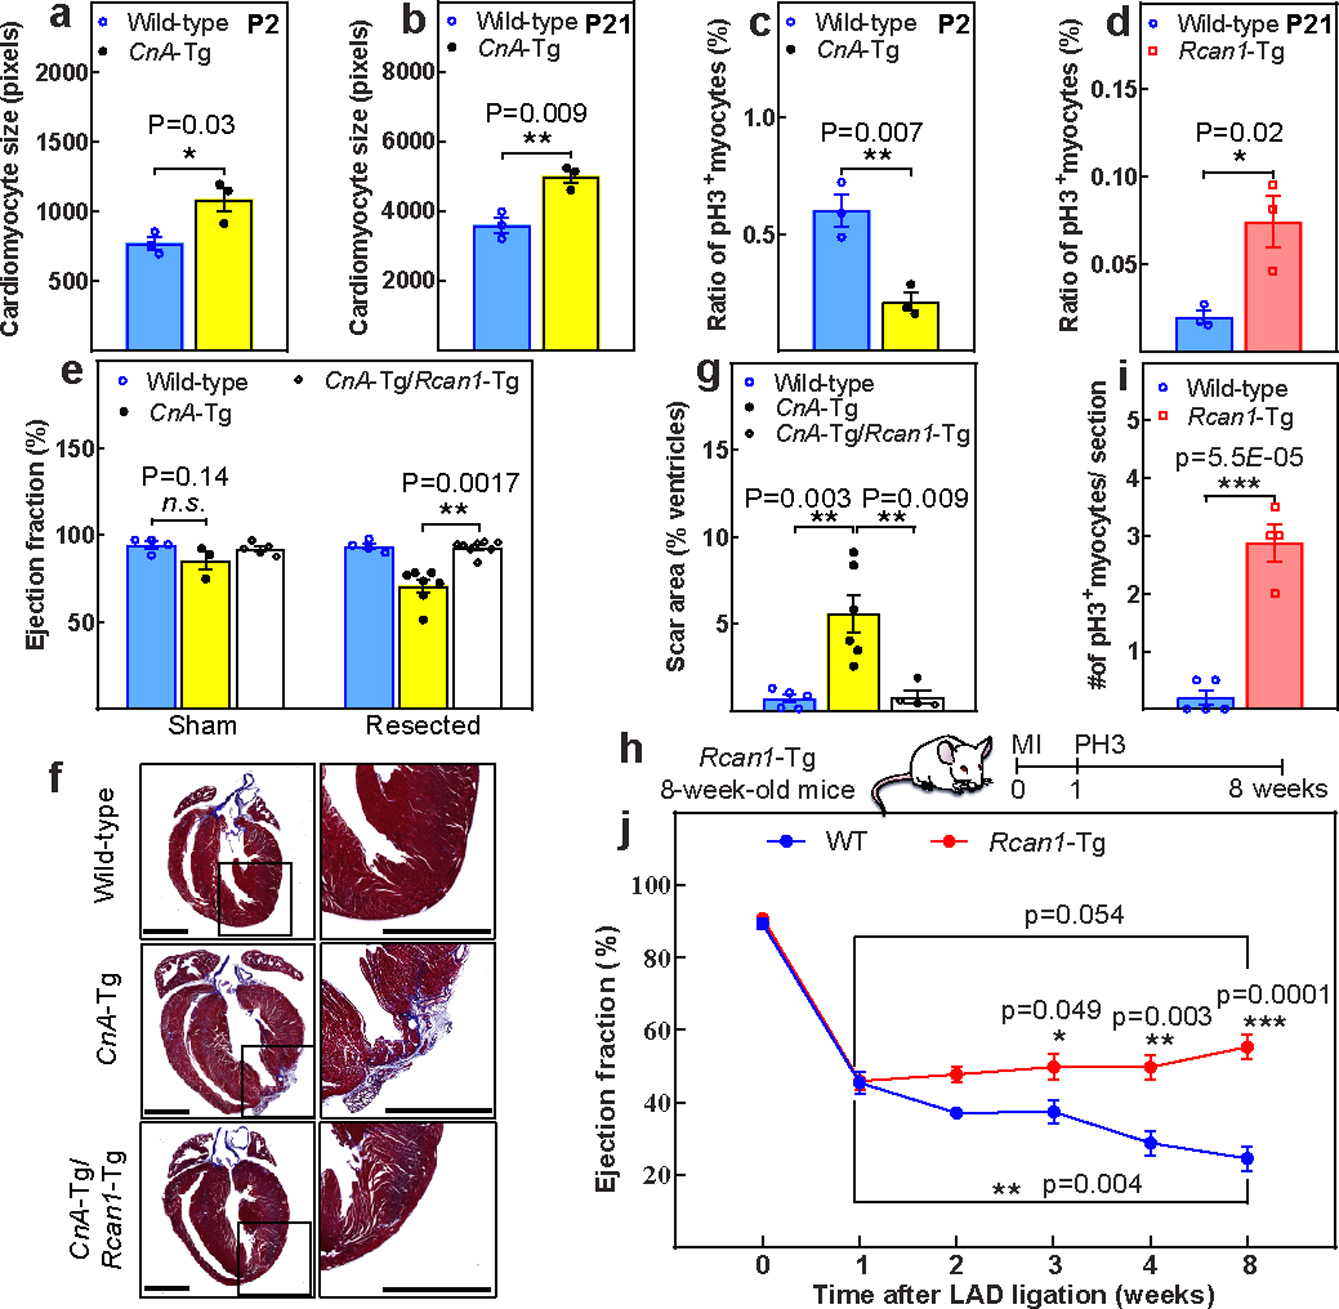
A major factor in the progression to heart failure in humans is the inability of the adult heart to repair itself after injury. We recently demonstrated that the early postnatal mammalian heart is capable of regeneration following injury through proliferation of preexisting cardiomyocytes1,2 and that Meis1, a three amino acid loop extension (TALE) family homeodomain transcription factor, translocates to cardiomyocyte nuclei shortly after birth and mediates postnatal cell cycle arrest3. Here we report that Hoxb13 acts as a cofactor of Meis1 in postnatal cardiomyocytes. Cardiomyocyte-specific deletion of Hoxb13 can extend the postnatal window of cardiomyocyte proliferation and reactivate the cardiomyocyte cell cycle in the adult heart. Moreover, adult Meis1-Hoxb13 double-knockout hearts display widespread cardiomyocyte mitosis, sarcomere disassembly and improved left ventricular systolic function following myocardial infarction, as demonstrated by echocardiography and magnetic resonance imaging. Chromatin immunoprecipitation with sequencing demonstrates that Meis1 and Hoxb13 act cooperatively to regulate cardiomyocyte maturation and cell cycle. Finally, we show that the calcium-activated protein phosphatase calcineurin dephosphorylates Hoxb13 at serine-204, resulting in its nuclear localization and cell cycle arrest. These results demonstrate that Meis1 and Hoxb13 act cooperatively to regulate cardiomyocyte maturation and proliferation and provide mechanistic insights into the link between hyperplastic and hypertrophic growth of cardiomyocytes.


Conflict of interest statement

COMPETING INTEREST DECLARATION

The authors declare no competing interests.

Figures

Extended Data Fig. 1
Extended Data Fig. 1. Additional characterization of Meis1-iKO, Hoxb13-KO, and Hoxb13-iKO mice.
a, Echocardiographic assessment of LVEF in Meis1-iKO hearts at the indicated time points post-MI. b, Immunostaining of Meis1-interacting Hox proteins (red), cardiac troponin T (green), and nucleus (blue) at P1, P7 and 7 days after P1 MI. c, Western blot analysis of Meis1 and Hox proteins during regenerative stages. GAPDH serves as loading control. d, Coimmunoprecipitation of Meis1 from total heart extracts at P1 and P7. e, Coimmunoprecipitation from Fig. 1c, with negative controls (IgG and DKO heart). f, Coimmunoprecipitation from Fig. 1d, with negative controls (IgG and DKO heart). g, PLA of Meis1 and Hoxb13 in P7 DKO heart; serves as negative control for PLA assay in Fig. 1e. h, Schematic of targeting strategy for generation of cardiomyocyte-specific Hoxb13 mutants. Partial map of the Hoxb13 floxed allele (top), and of the knockout allele (bottom) following cardiomyocyte-specific Cre-mediated excision. Exons and loxP sites are indicated as rectangles and triangles, respectively. i, PCR analysis of heart DNA obtained by crossing Hoxb13loxP/loxP (female) mutants with MHC-cre (male) transgenic mice. Left lane shows Hoxb13loxP/loxP. Middle lane indicates cardiomyocyte-specific Cre. Right lane indicates that the deleted allele is present in cardiomyocyte DNA of this offspring. j, Top, western blot of protein extracts from hearts of constitutive (left) or inducible (right) Hoxb13 knockout and Hoxb13fl/fl littermate mice. GAPDH serves as loading control. Bottom, densitometry quantification of the above western blot. k, Control and Hoxb13-KO P14 hearts stained for Meis1 (red), cardiac troponin T (green), and nucleus (blue). Arrowheads indicated Meis1-expressing cardiomyocytes, and arrows indicate Meis1-expressing non-cardiomyocytes. l, Representative echocardiography, ejection fraction and fraction shortening in Hoxb13-KO mice P14 hearts. m, Representative images of Masson’s trichrome staining of control and Hoxb13-iKO hearts at 14 days post-deletion. n, Representative images of immunostaining for TUNEL (green), cardiac troponin T (red) and nucleus (blue) (left) and quantification (right) 14 days post-deletion. Arrow indicates TUNEL-positive cardiomyocytes. Data are mean ± s.e.m.; unpaired two-sided t-test. Data in b±f, g, i, k, m were independently repeated three times with similar results. *P < 0.05, **P < 0.01. For gel source data, see Supplementary Fig. 1. For n values, see Methods. Scale bars, 10 μm (b, k, n), 50 μm; (g), 1 mm (m).
Extended Data Fig. 2
Extended Data Fig. 2. Assessment of Hoxb13-KO and Hoxb13-iKO hearts post-MI.
a, Schematic of MI model in Hoxb13-KO mice. b–d, Representative echocardiography (b), heart weight/body weight (c), and wet-to-dry lung weight ratio (d) in Hoxb13-KO mice 16 weeks after MI. e, Representative serial Masson’s trichrome staining in transversal sections (left) and quantification of fibrotic scars (right) in Hoxb13-KO MI hearts at 16 weeks after injury. f, Schematic of MI model in Hoxb13-iKO mice. g, h, Heart weight/body weight (g) and wet-to-dry lung weight ratio (h) in Hoxb13-iKO mice 16 weeks after MI. i, Serial echocardiography of Hoxb13-iKO MI and sham mice. Data are mean ± s.e.m.; unpaired two-sided t-test. **P < 0.01, ***P < 0.001; n.s., not significant. For n values, see Methods. Scale bar 1 mm (e).
Extended Data Fig. 3
Extended Data Fig. 3. Concurrent knockout of Meis1 and Hoxb13 preserves cardiomyocyte proliferative capacity.
a–g, Assessment of control and DKO hearts at P28. a, Representative images of haematoxylin and eosin-stained heart sections and heart weight/body weight ratio. b, Representative images of WGA staining and cardiomyocyte cross-sectional area quantification. c, Representative images of immunostaining for PH3 (green), cardiac troponin T (red) and nucleus (blue) (left) and the percentage (right) of mitotic cardiomyocytes (arrow). Arrowhead indicates sarcomere disassembly. d, Representative images of immunostaining for aurora B kinase (green), cardiac troponin T (red) and nucleus (blue) (left) showing the percentage (right) of cardiomyocytes undergoing cytokinesis (arrow). e, f, Total number of cardiomyocytes (e) and quantification of nucleation (f). Cnx43, connexin-43. g, Representative echocardiography and LV systolic function. h–k, Assessment of control and DKO hearts at 6 months of age. h, Representative images of immunostaining for PH3 (green), cardiac troponin T (red), and nucleus (blue) (left) and the percentage (right) of mitotic cardiomyocytes (arrow). Arrowhead indicates cardiomyocytes with sarcomere disassembly. i, Representative images of immunostaining for aurora B kinase (green), cardiac troponin T (red) and nucleus (blue) (left) and the percentage (right) of cardiomyocytes undergoing cytokinesis (arrow). j, Representative images of WGA (green), cardiac troponin T (red) and nucleus (blue) staining (left) and cardiomyocyte CSA quantification (right). k, LV systolic function quantified by ejection fraction in 6-month-old DKO mice. Data are mean ± s.e.m.; unpaired two-sided t-test. *P < 0.05, **P < 0.01, ***P < 0.001. For n values, see Methods. Scale bars, 10 μm (c, d, f, h, i), 50 μm (b, j), 1 mm (a).
Extended Data Fig. 4
Extended Data Fig. 4. Loss of Meis1 and Hoxb13 attenuates both pathological and physiological hypertrophic responses.
a, Schematic representing the TAC model. b, Representative images of M-mode echocardiography (top) and quantification of ejection fraction (bottom), demonstrating improved LVEF in the DKO mice compared with wild-type mice three weeks after TAC. c, Heart weights, showing significantly higher heart weight in the wild-type group. d, Tibia length was similar in both groups. e, f, The ratio of heart weight/body weight (e) and heart weight/tibial length (f) indicate that the DKO mice have a blunted response to pressure overload. g, Representative images of mouse heart sections stained with haematoxylin and eosin (H&E; top) or Masson’s trichrome (bottom) three weeks after surgery. h, Representative confocal images of cardiomyocyte WGA staining (left) and CSA quantification (right), confirming the blunted hypertrophic response in the DKO hearts in response to pressure overload. i, Schematic representation of the exercise protocol. j, Representative images of echocardiography (top) and ejection fraction quantification (bottom), demonstrating no difference in ejection fraction at baseline and after exercise. k, Running distance of control and DKO mice over four weeks, demonstrating no difference between the two groups. l, Heart weight. m, The ratio of heart weight/body weight suggests that both control and DKO hearts respond to exercise-induced cardiac hypertrophy. n, The ratio of heart weight/tibia length also indicates cardiac hypertrophy in both groups in response to exercise. o, Representative images of mouse heart sections stained with either haematoxylin and eosin (top) or Masson’s trichrome (bottom) four weeks after exercise. p, Confocal images of cardiomyocyte WGA staining and CSA quantification. Data are mean ± s.e.m.; unpaired two-sided t-test. Images in g, o are representative of six independently performed experiments with similar results. *P < 0.05, **P < 0.01, ***P < 0.001. For n values, see Methods. Scale bars, 50 μm (h, p), 1 mm (g, o).
Extended Data Fig. 5
Extended Data Fig. 5. Inducible knockout of Meis1 and Hoxb13 promotes sarcomere disassembly and cardiomyocyte division.
a, Representative images of Masson’s trichrome staining of DiKO hearts four weeks after deletion. b, c, Disassembled sarcomere cardiomyocytes in DiKO hearts one week after deletion, demonstrated by cardiac troponin T (red) (b) or sarcomeric α-actinin (red) (c). d, Representative images of immunostaining for TUNEL (green) and cardiac troponin T (red) in DiKO hearts one week and two months after deletion, as shown in Fig. 2e. e, f, Representative images of immunostaining for PH3 (green), cardiac troponin T (red) and nucleus (blue), showing additional examples of proliferating cardiomyocytes in DiKO hearts at (e) one week and (f) two months after gene deletion. g, Representative images of immunostaining for aurora B kinase (green), cardiac troponin T (red) and nucleus (blue) (left) and the percentage (right) of proliferating cardiomyocytes (arrow) one week after gene deletion. h, Additional examples of cytokinetic cardiomyocytes in DiKO hearts one week after gene deletion. Images in a–c are representative of three independently performed experiments with similar results. Scale bars, 10 μm (b, d–h), 20 μm (c), 1 mm (a).
Extended Data Fig. 6
Extended Data Fig. 6. LV function of DKO hearts after MI.
a, Schematic of MI model in DKO hearts 2 weeks post-MI. b, c, Western blot analysis (b) and quantification (c), showing decrease in expression of p21, p15/p16 in DKO hearts. d–f, Heart weight/body weight (d), heart weight (e) and body weight (f) in control and DiKO mice 16 weeks after injury. g, Representative images of the whole hearts at 16 weeks post-MI. The white arrow indicates a region with cell death and the yellow arrow indicates the dilated left atrial appendage. h, Additional representative serial Masson’s trichrome-stained transversal sections, as in Fig. 2l. i, j, LV cardiac index (i) and heart rate (j) in DiKO mice 16 weeks after MI measured by MRI. k, LVEF for sham groups. l–q, Cardiac function analysis for left-ventricular end-diastolic anterior wall thickness (l), left-ventricular end-diastolic internal diameter (m), left-ventricular end-diastolic volume (n), left-ventricular end-diastolic posterior wall thickness (o), left-ventricular end-systolic internal diameter (p), and left ventricular end-systolic volume (q) in DiKO and control mice after MI. Data are mean ± s.e.m.; unpaired two-sided t-test. *P < 0.05, **P < 0.01, ***P < 0.001. For gel source data, see Supplementary Fig. 1. For n values, see Methods. Scale bars, 1 mm (g, h).
Extended Data Fig. 7
Extended Data Fig. 7. Genome-wide identification of Meis1 and Hoxb13 binding sites in heart using ChIP–seq.
a, Venn diagram showing Meis1 and Hoxb13 binding-site identification. Three replicate sequencing runs were performed for each factor, and the enriched regions were selected only if they were detected in three biological replicates. b, An example of a Meis1 binding site in the cell cycle arrest gene Cdkn1b. c, Gene ontology terms enriched in Meis1-, Hoxb13- and Meis1–Hoxb13-bound peak regions identified from a.
Extended Data Fig. 8
Extended Data Fig. 8. Interaction and dephosphorylation status of Meis1 and Hoxb13 with calcineurin.
a–c, Coimmunoprecipitation of Fig. 3b–d with negative controls (IgG and DKO heart). d, PLA of CnA and Hoxb13 at P7 of DKO heart; serves as negative control for PLA assay in Fig. 3e. e, PLA assay using only one antibody; serves as negative control for the assay. f, PLA of CnA and Meis1 at P7 heart showed Meis1–CnA association (red dot). g, h, Schematic representation of Meis1 (g, top) and Hoxb13 (h, top) proteins showing the phosphorylatable serine and threonine residues, amino acid sequence of Meis1 (g, bottom) and Hoxb13 (h, bottom) with potentially phosphorylatable serine and threonine residues in red. Box indicates the predicted nuclear localization signal. Numbers indicate amino acid positions. i, j, Densitometry quantification of western blot analysis in Fig. 3j for Hoxb13 (i) and phosphorylated Hoxb13 S204 (j). k, Western blot analysis of phosphorylated Meis1 protein at P1 and P7. GAPDH serves as loading control. l, Western blot analysis from stable DKO cardiac fibroblasts confirms the loss of Hoxb13 in Cre-treated cells. Data are mean ± s.e.m.; unpaired two-sided t-test. Experiments in a–f, k–m were repeated independently three times with similar results. *P < 0.05, **P < 0.01. For gel source data, see Supplementary Fig. 1. For n values, see Methods. Scale bars, 10 μm (f), 50 μm (d, e).
Extended Data Fig. 9
Extended Data Fig. 9. Increased calcineurin activity suppresses postnatal cardiomyocyte proliferation.
a, Heart weight/body weight in wild-type, CnA-Tg, Rcan1-Tg, and double-Tg mice at P2 (a) and P21 (b). c, d, Representative images of WGA staining for CSA quantification in Fig. 4a (c) and Fig. 4b (d). e, f, Representative images of immunostaining for PH3 (green) and cardiac troponin T (red) for mitotic cardiomyocytes quantification in Fig. 4c (e) and Fig. 4d (f). g, Schematic of apical resection model in P1 mice. Scale bars, 10 μm (f), 50 μm (c, d). Data are mean ± s.e.m.; unpaired two-sided t-test. ***P < 0.001. For n values, see Methods.
Figure 1:
Figure 1:. Identification of Hoxb13 as a Meis1-interacting transcription factor in postnatal cardiomyocytes.
a, Immunostaining of Hoxb13 (red), sarcomeric-α-actinin (Actn2; green) and nucleus (blue) at P1, P7 and seven days after P1 MI. The inset shows a higher magnification of the outlined region. b, Western blot analysis of Meis1 and Hoxb13 proteins during regenerative stages. c, d, Coimmunoprecipitation (IP) using Meis1 (c) and Hoxb13 (d) antibodies from total heart extracts at P1 and P7. e, PLA of Meis1-Hoxb13 (red dots) in P7 heart. f, Haematoxylin and eosin-stained heart sections and heart weight/body weight (HW/BW) in Hoxb13-KO mice at P14. g, Wheat germ agglutinin (WGA) staining and CSA quantification in Hoxb13-KO hearts. h, Immunostaining for PH3 (green) and cardiac troponin T (cTnT, red) showing the percentage of mitotic cardiomyocytes (arrowheads). i–n, Quantification of Hoxb13-iKO hearts at 14 days after deletion. i, Heart weight/body weight and H&E-stained heart sections. j, WGA staining and CSA quantification. k, l, Immunostaining for PH3 or aurora B kinase (AurkB) (green), cardiac troponin T (red) and nucleus (blue), showing the percentage of mitotic (k) and cytokinetic (l) cardiomyocytes. m, n, Total number (m) and nucleation (n) of isolated cardiomyocytes. Cx43, connexin 43. o, Representative immunofluorescence and quantification of single-labelled (red or green, arrowheads) cardiomyocytes (CM) in Hoxb13-iKO MADM mice. p, Serial echocardiographic measurements of control and Hoxb13-KO MI mice. Data are mean ± s.e.m.; unpaired two-sided t-test. Data in a–e were independently repeated three times with similar results. *P < 0.05, **P < 0.01, ***P < 0.001. NS, not significant. For gel source data, see Supplementary Fig. 1. For sample numbers, see Methods. Scale bars, 10 μm (a, g, h, k, l, n), 50 μm (e, j, o), 1 mm (f, i). See also Extended Data Figs. 1, 2.
Figure 2:
Figure 2:. Loss of Meis1 and Hoxb13 induces cardiomyocyte proliferation and heart regeneration.
a, Representative haematoxylin and eosin-stained heart sections four weeks after inducible deletion of Meis1 and Hoxb13 (DiKO). b–d, Heart weight/body weight (b), WGA staining and CSA quantification (c), and representative image of sarcomere disassembly and quantification (d) in DiKO hearts at one week after deletion. WGA (green), cardiac troponin T (red) and nucleus (blue). e, Quantification of TUNEL+ cardiomyocytes in DiKO hearts at one week and two months after deletion. f, Immunostaining for PH3 (green) and cardiac troponin T (red) showing the percentage of mitotic cardiomyocytes. g, Representative immunofluorescence images and quantification of single-labelled (red or green, arrows) cardiomyocytes in DiKO-MADM mice. h, Representative images and quantification of proliferating cardiomyocytes (PCM+BrdU+ cells, arrows) from BrdU pulse–chase experiments from cryosections of an entire heart. The smaller panels show selected regions at higher magnification. i, j, Total number of cardiomyocytes (i) and nucleation quantification (j) in DiKO hearts. k, Schematic of MI model in DiKO mice. Tam, tamoxifen. l, m, Representative serial Masson’s trichrome-stained transverse sections and quantification of fibrotic scars (l), and representative echocardiography of control and DiKO MI mice at 16 weeks after injury (m). n, Serial echocardiographic measurement of control and DiKO MI mice. o–q, Representative images of MRI (o), LVEF (p) and stroke volume index (q). r, Wet-to-dry lung weight ratio in DiKO mice 16 weeks after MI. Data are mean ± s.e.m.; unpaired two-sided t-test. *P < 0.05, **P < 0.01, ***P < 0.001. For sample numbers, see Methods. Scale bars, 10 μm (d, f, g, h), 50 μm (c), 1 mm (a, l, o). See also Extended Data Figs. 3–6.
Figure 3:
Figure 3:. Calcineurin regulates Hoxb13 expression in the postnatal hearts.
a, Western blot analysis of Meis1, Hoxb13 and CnA proteins during regenerative stages. b–d, Coimmunoprecipitation of CnA (b), Meis1 (c) and Hoxb13 (d) from total heart lysates at P1 and P7. e, PLA showing Hoxb13–calcineurin (red dots) in P7 heart. f, Schematic of Hoxb13 mutant at the predicated PxIxIT site. aa, amino acid. g, Quantitative pull-down assay with purified recombinant His6-tagged CnA and GST-tagged Hoxb13 peptide or mutant (Mut) Hoxb13 peptides. Dig2–GST serves as positive control. h, i, Top, merged images of immunostaining for Hoxb13 (red, arrow, bottom) and sarcomeric α-actinin (green) showing the subcellular localization of Hoxb13 in P2 CnA-Tg (h) or P7 Rcan1-Tg (i) hearts. DAPI (blue) indicates nucleus. j, Western blot analysis of phosphorylated Hoxb13 proteins during regenerative stages. k, l, Western blot analysis of phosphorylated Hoxb13S204 in CnA-Tg and Rcan1-Tg P2 hearts (k) and densitometry quantification (l). Rcan1.4 (26 kDa) indicates CnA-Tg heart; truncated Rcan1.4 (13 kDa) indicates Rcan1-Tg heart. GAPDH serves as loading controls (a, j, k). m, Schematic showing generation of primary cardiac DKO fibroblasts for assessing S204 phosphorylation-dependent nuclear localization of Hoxb13. n, Representative images of subcellular localization of Hoxb13–GFP mutants in cardiac DKO fibroblasts. Data are mean ± s.e.m.; unpaired two-sided t-test. Data in a–e, g, j, n were independently repeated three to six times with similar results. *P < 0.05, **P < 0.01. For gel source data, see Supplementary Fig. 1. For sample numbers, see Methods. Scale bars, 50 μm (e, h, i, n). See also Extended Data Fig. 8.
Figure 4:
Figure 4:. Increased calcineurin activity suppresses postnatal cardiomyocyte proliferation.
a, b, CSA quantification in wild-type and CnA-Tg in P2 (a) and P21 hearts (b). c, d, Percentage of mitotic cardiomyocytes in CnA-Tg P2 (c) or Rcan1-Tg P21 (d) hearts. e, Echocardiographic measurements of cardiac function 21 days after resection. f, g, Representative Masson’s trichrome staining (f; scale bars, 1 mm) and scar area quantification (g) of apical resected hearts 21 days after resection. h, Schematic of MI model in Rcan1-Tg mice. i, Quantification of PH3+ cardiomyocytes in wild-type and Rcan1-Tg heart sections one week after MI induction. j, Serial echocardiographic measurement of wild-type and Rcan1-Tg MI mice. Data are mean ± s.e.m.; unpaired two-sided t-test. *P < 0.05, **P < 0.01, ***P < 0.001. For sample numbers, see Methods. See also Extended Data Fig. 9.

References

    1. Bui AL, Horwich TB & Fonarow GC Epidemiology and risk profile of heart failure. Nature reviews. Cardiology 8, 30–41, doi:10.1038/nrcardio.2010.165 (2011). - DOI - PMC - PubMed
    1. Soonpaa MH & Field LJ Assessment of cardiomyocyte DNA synthesis in normal and injured adult mouse hearts. Am J Physiol 272, H220–226 (1997). - PubMed
    1. Senyo SE et al. Mammalian heart renewal by pre-existing cardiomyocytes. Nature 493, 433–436, doi:10.1038/nature11682 (2013). - DOI - PMC - PubMed
    1. Bergmann O et al. Evidence for cardiomyocyte renewal in humans. Science 324, 98–102, doi:10.1126/science.1164680 (2009). - DOI - PMC - PubMed
    1. Eschenhagen T et al. Cardiomyocyte Regeneration: A Consensus Statement. Circulation 136, 680–686, doi:10.1161/CIRCULATIONAHA.117.029343 (2017). - DOI - PMC - PubMed

Publication types

Substances