. 2020 Jun;582(7812):416-420.
doi: 10.1038/s41586-020-2246-4. Epub 2020 Apr 29.

CRISPR screen in regulatory T cells reveals modulators of Foxp3

Affiliations

CRISPR screen in regulatory T cells reveals modulators of Foxp3

Jessica T Cortez et al. Nature. 2020 Jun.

Abstract

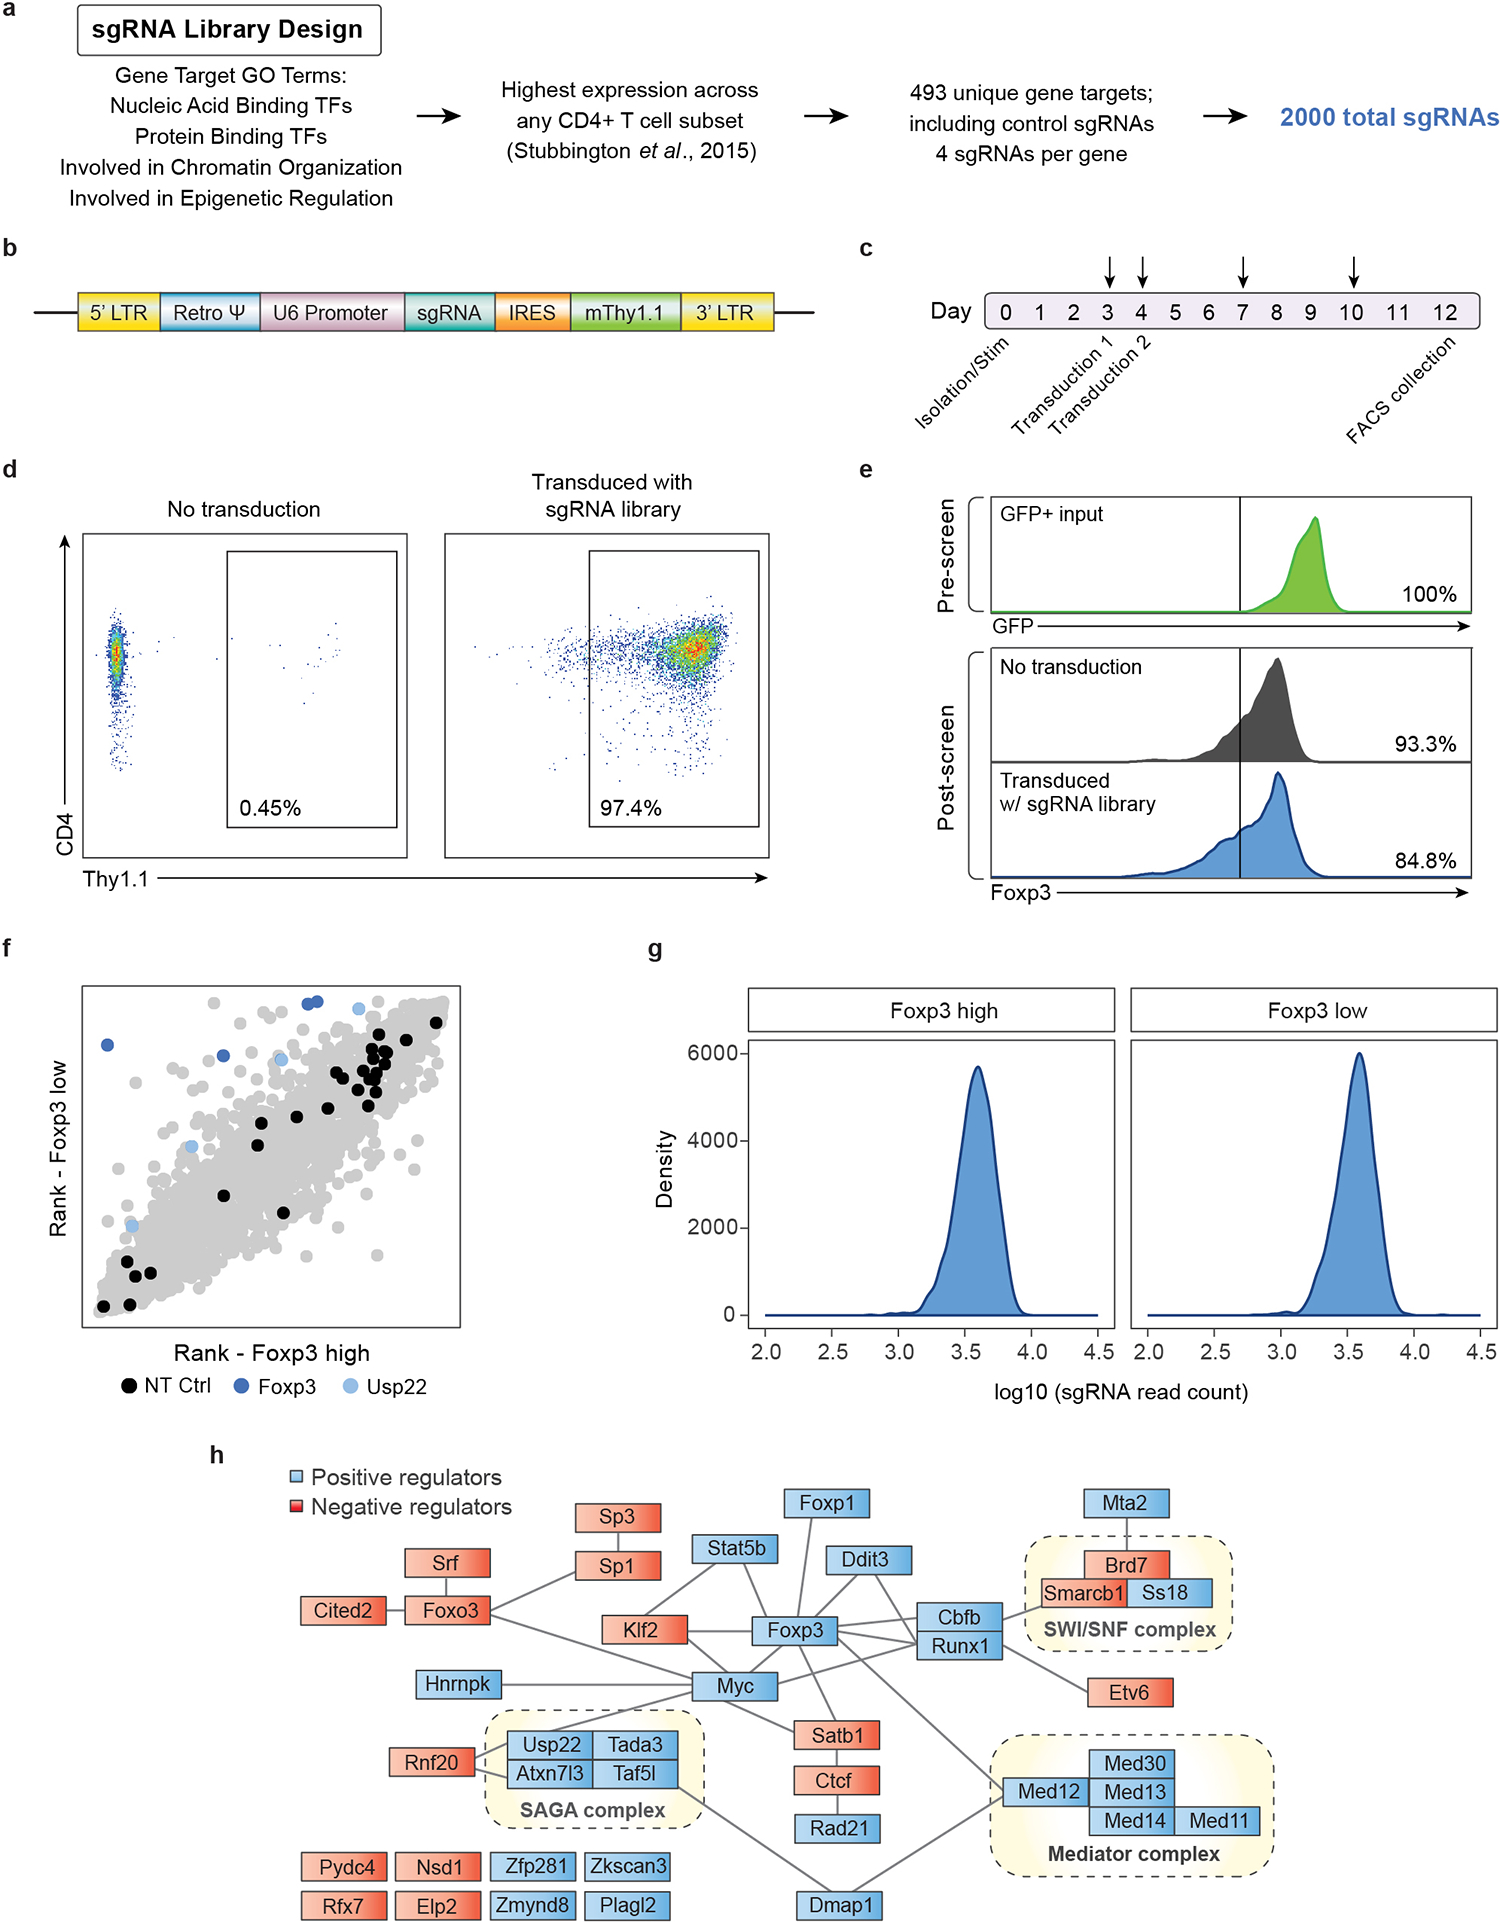
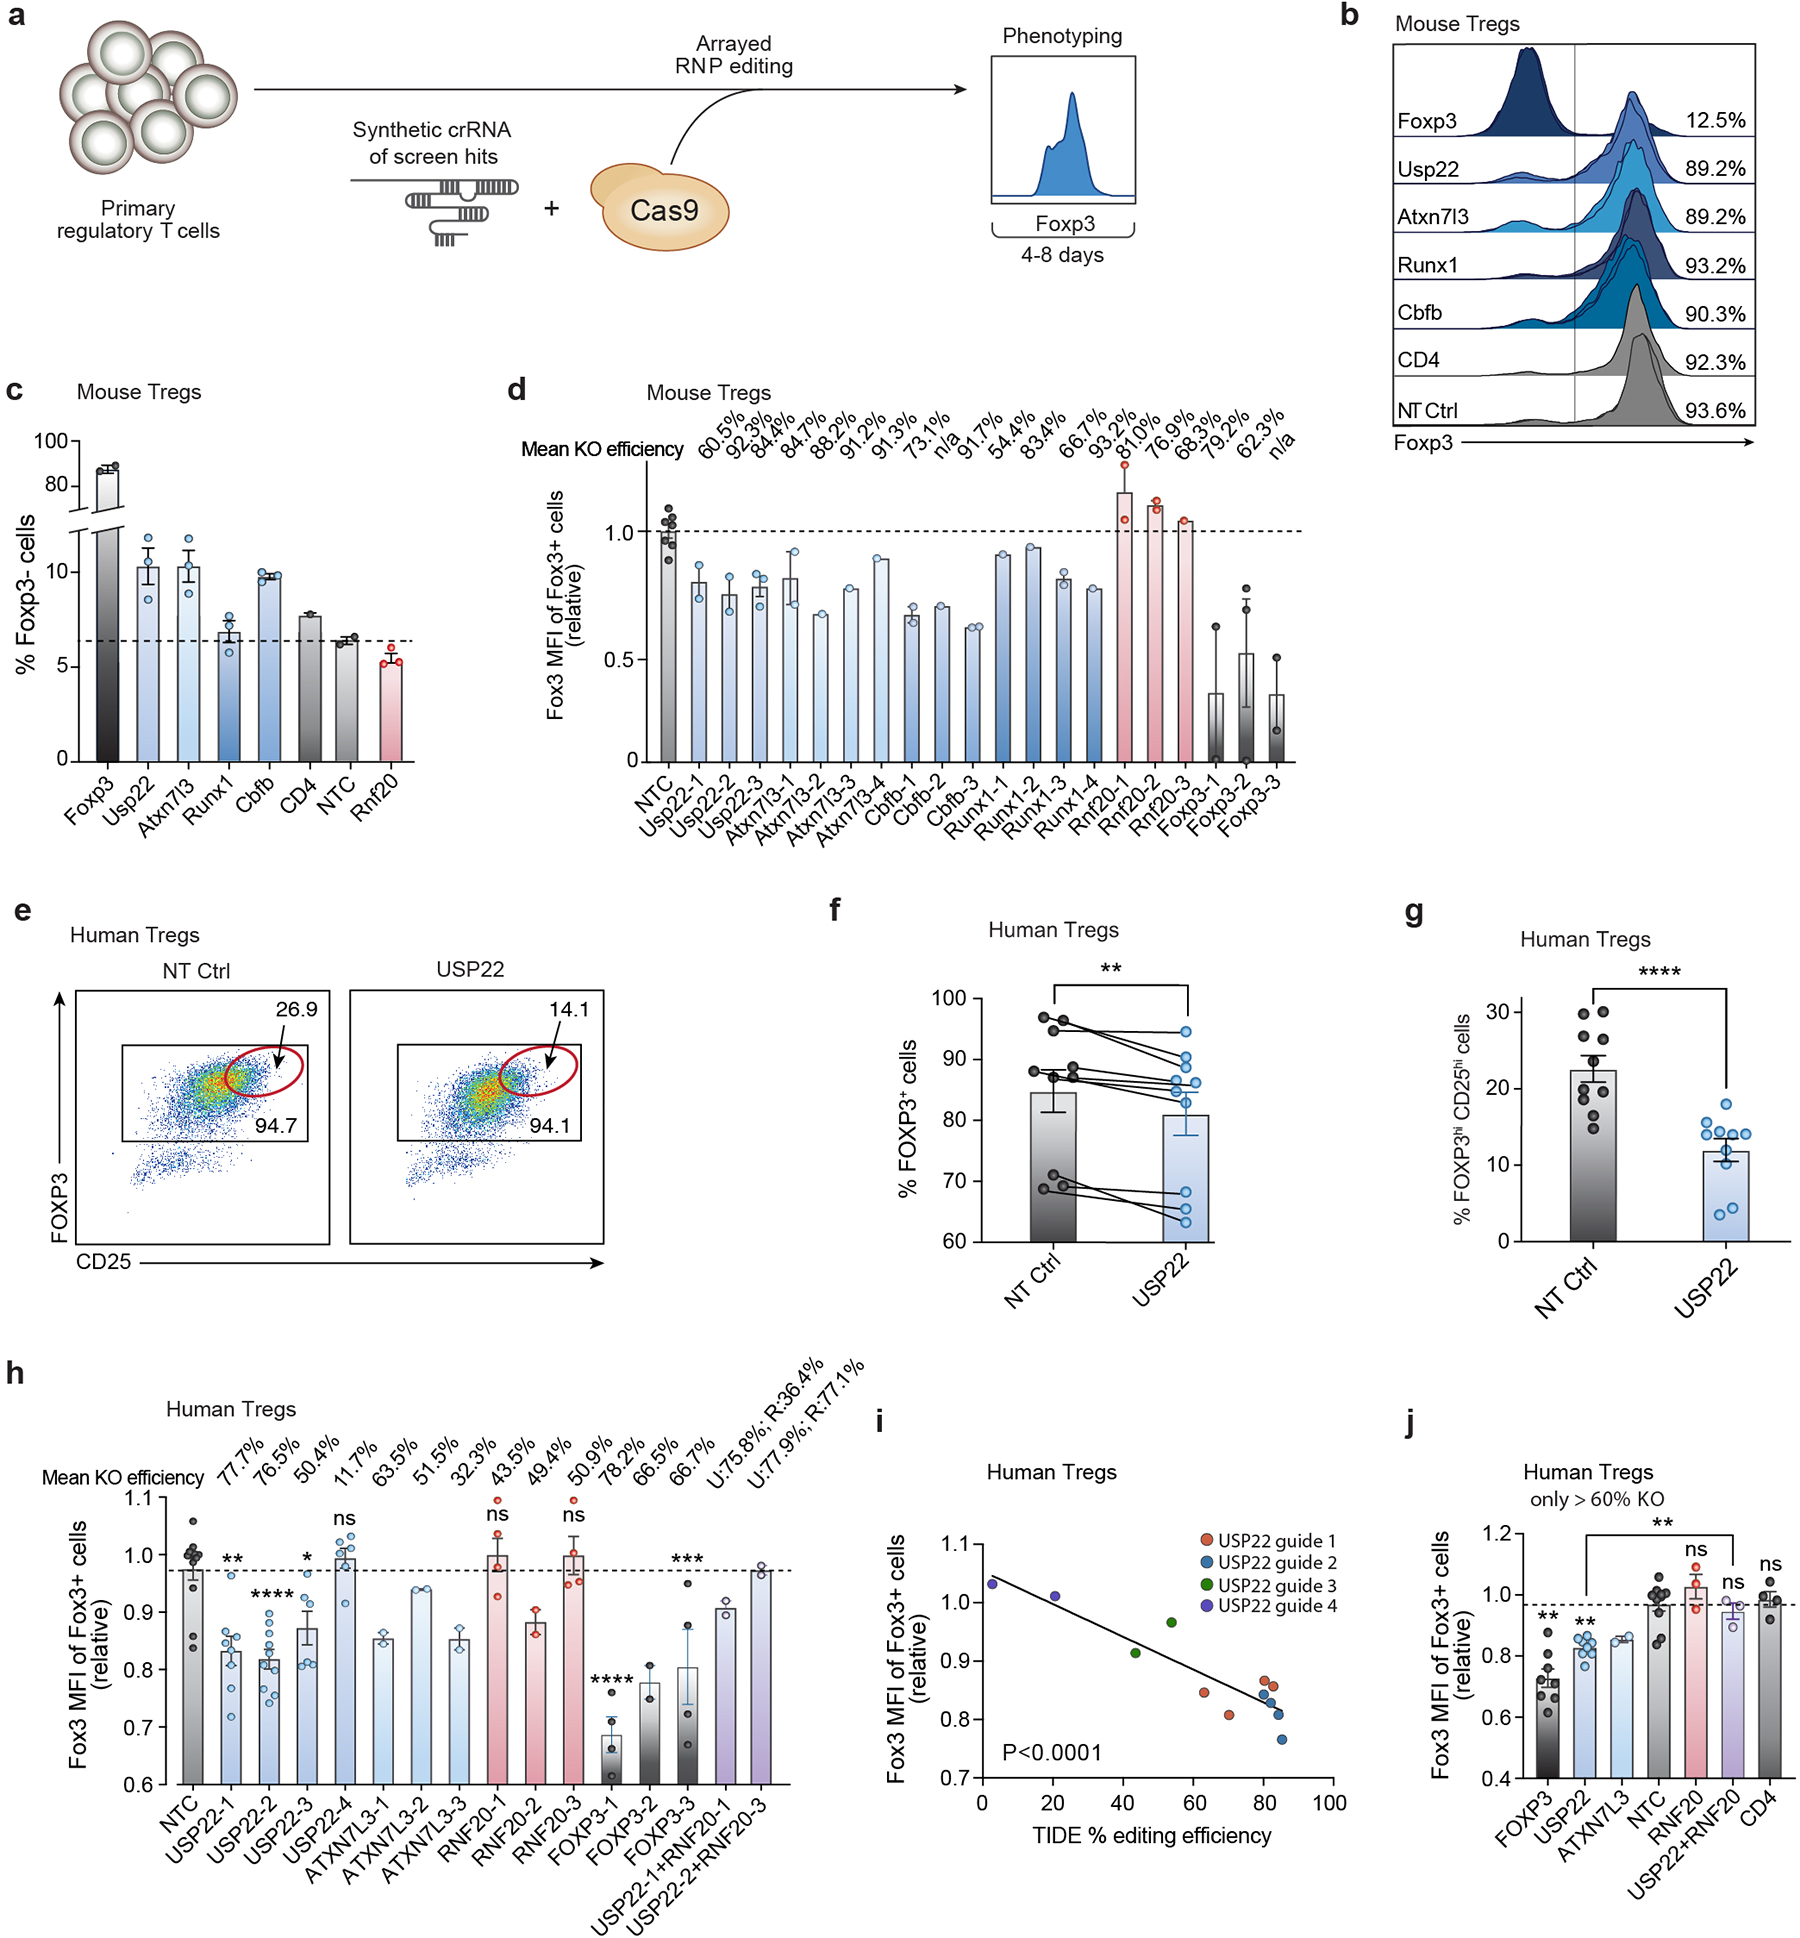
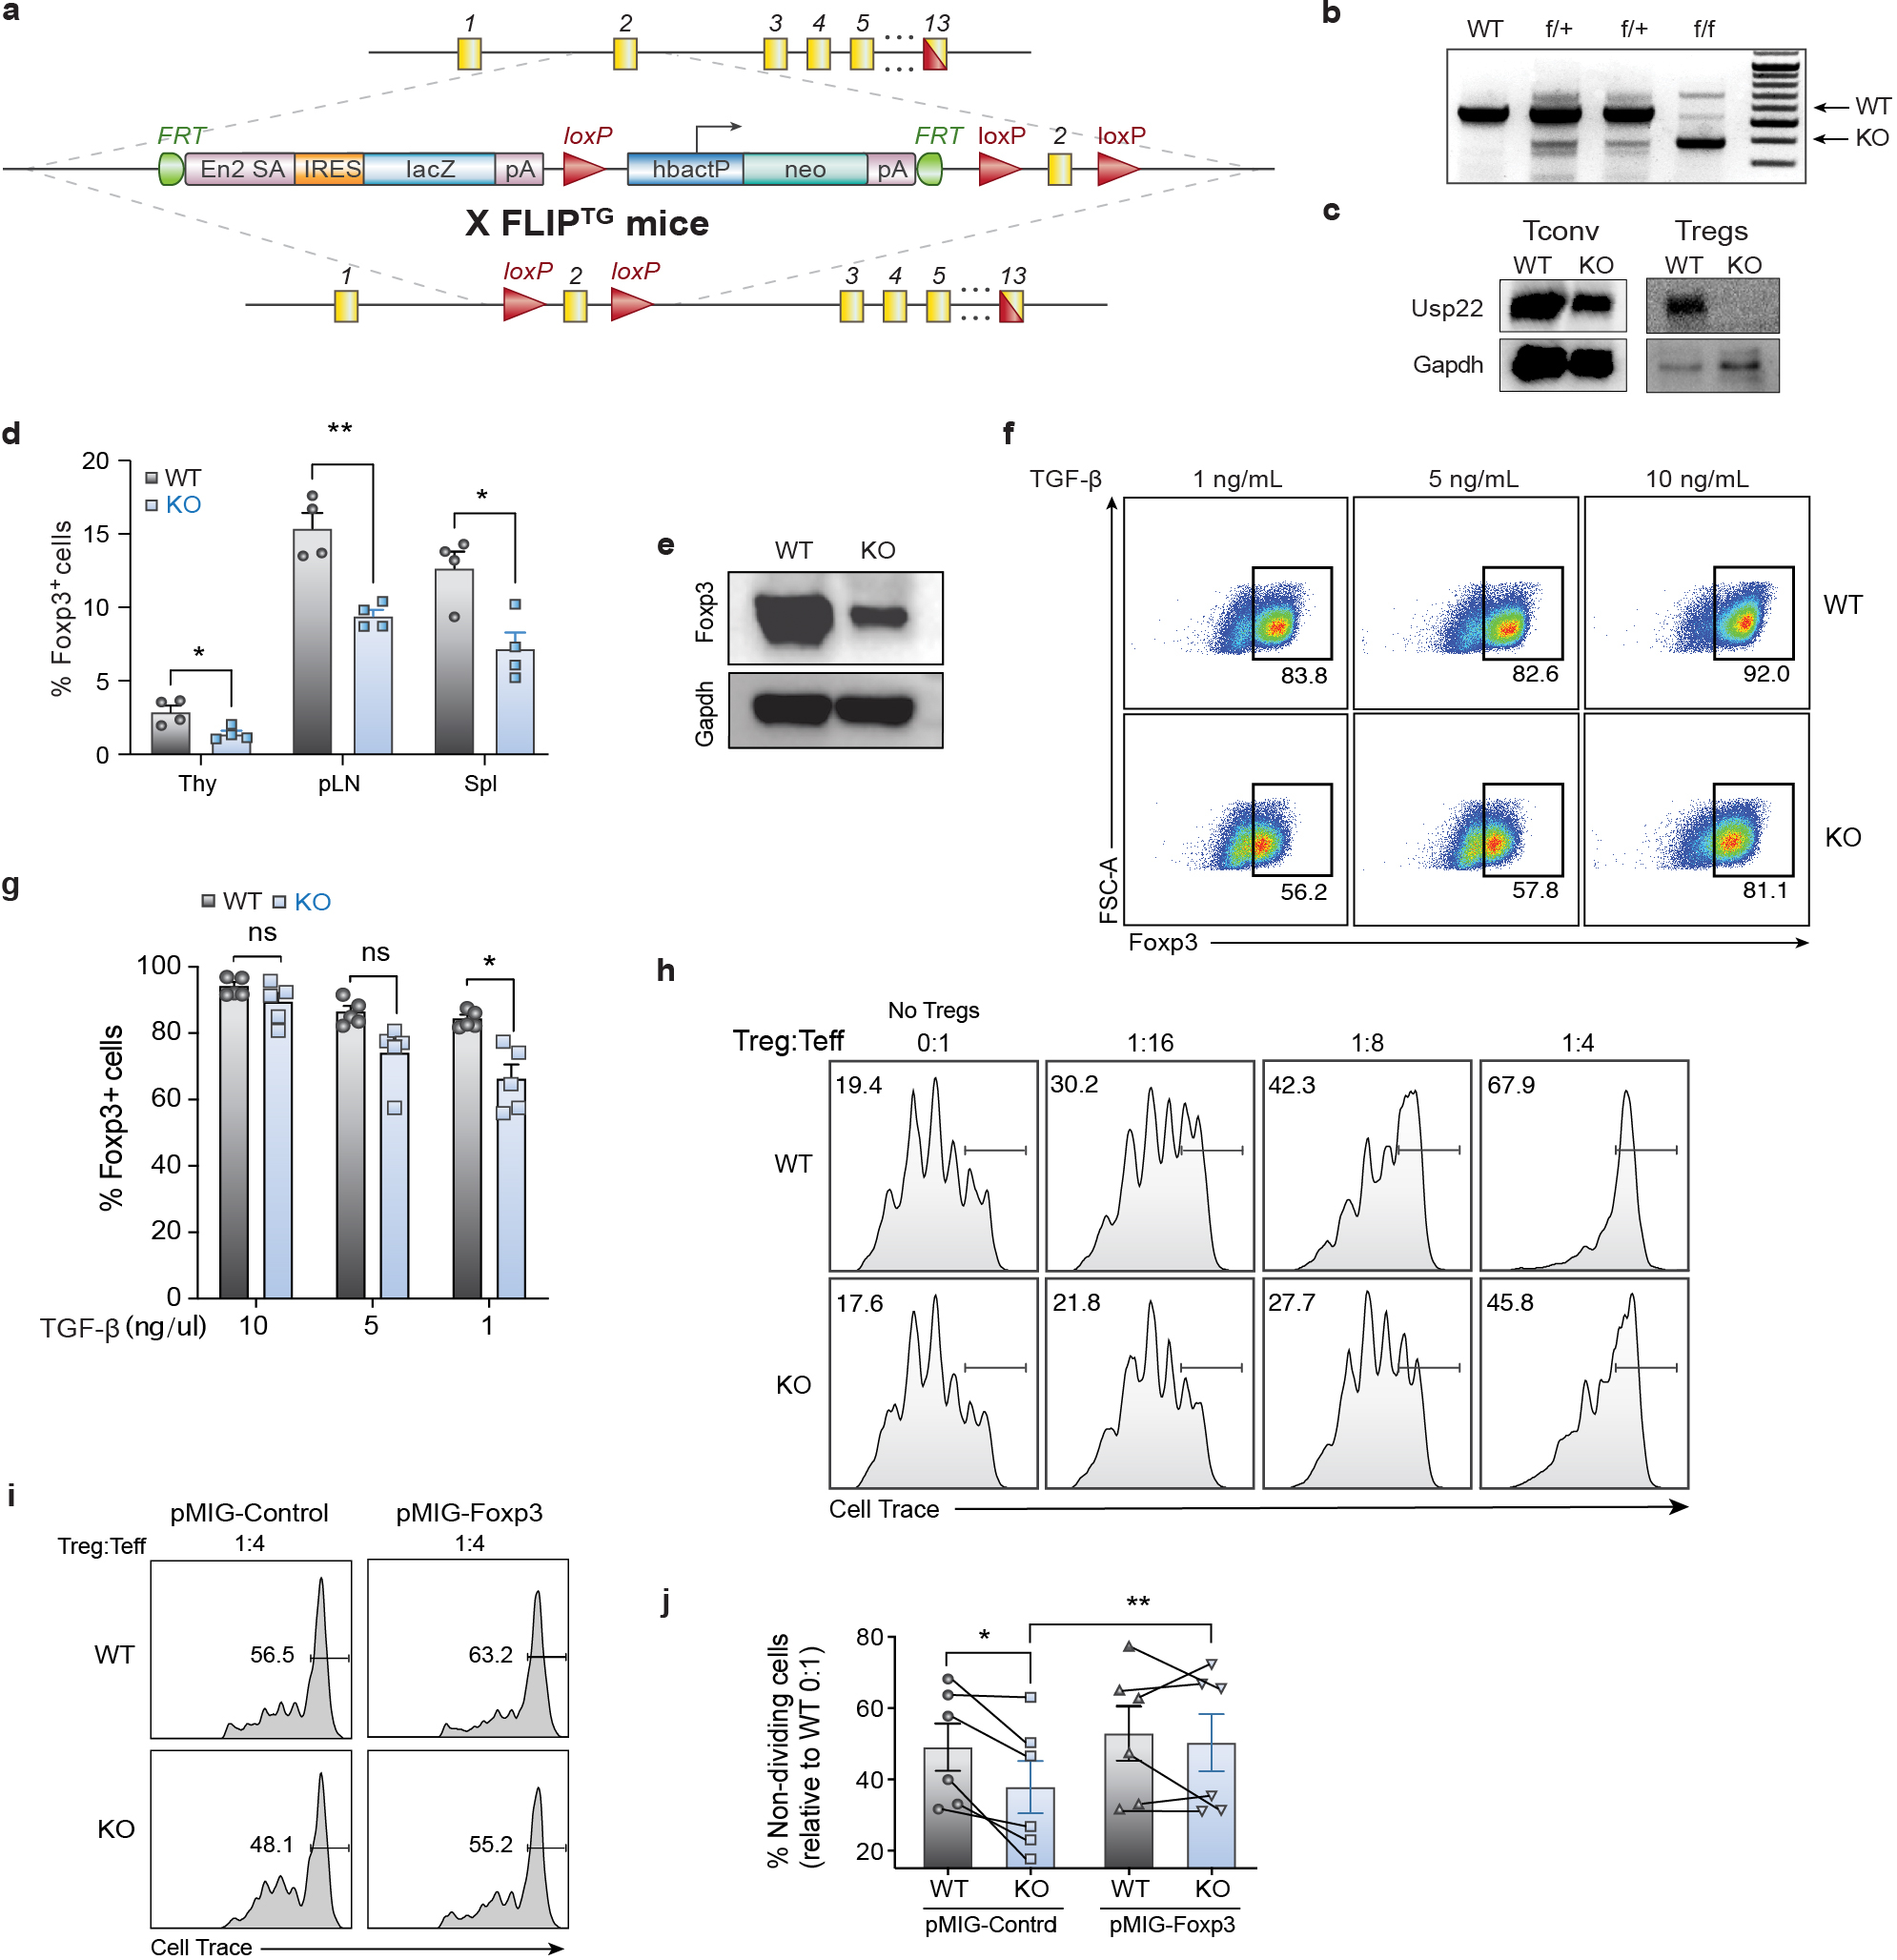
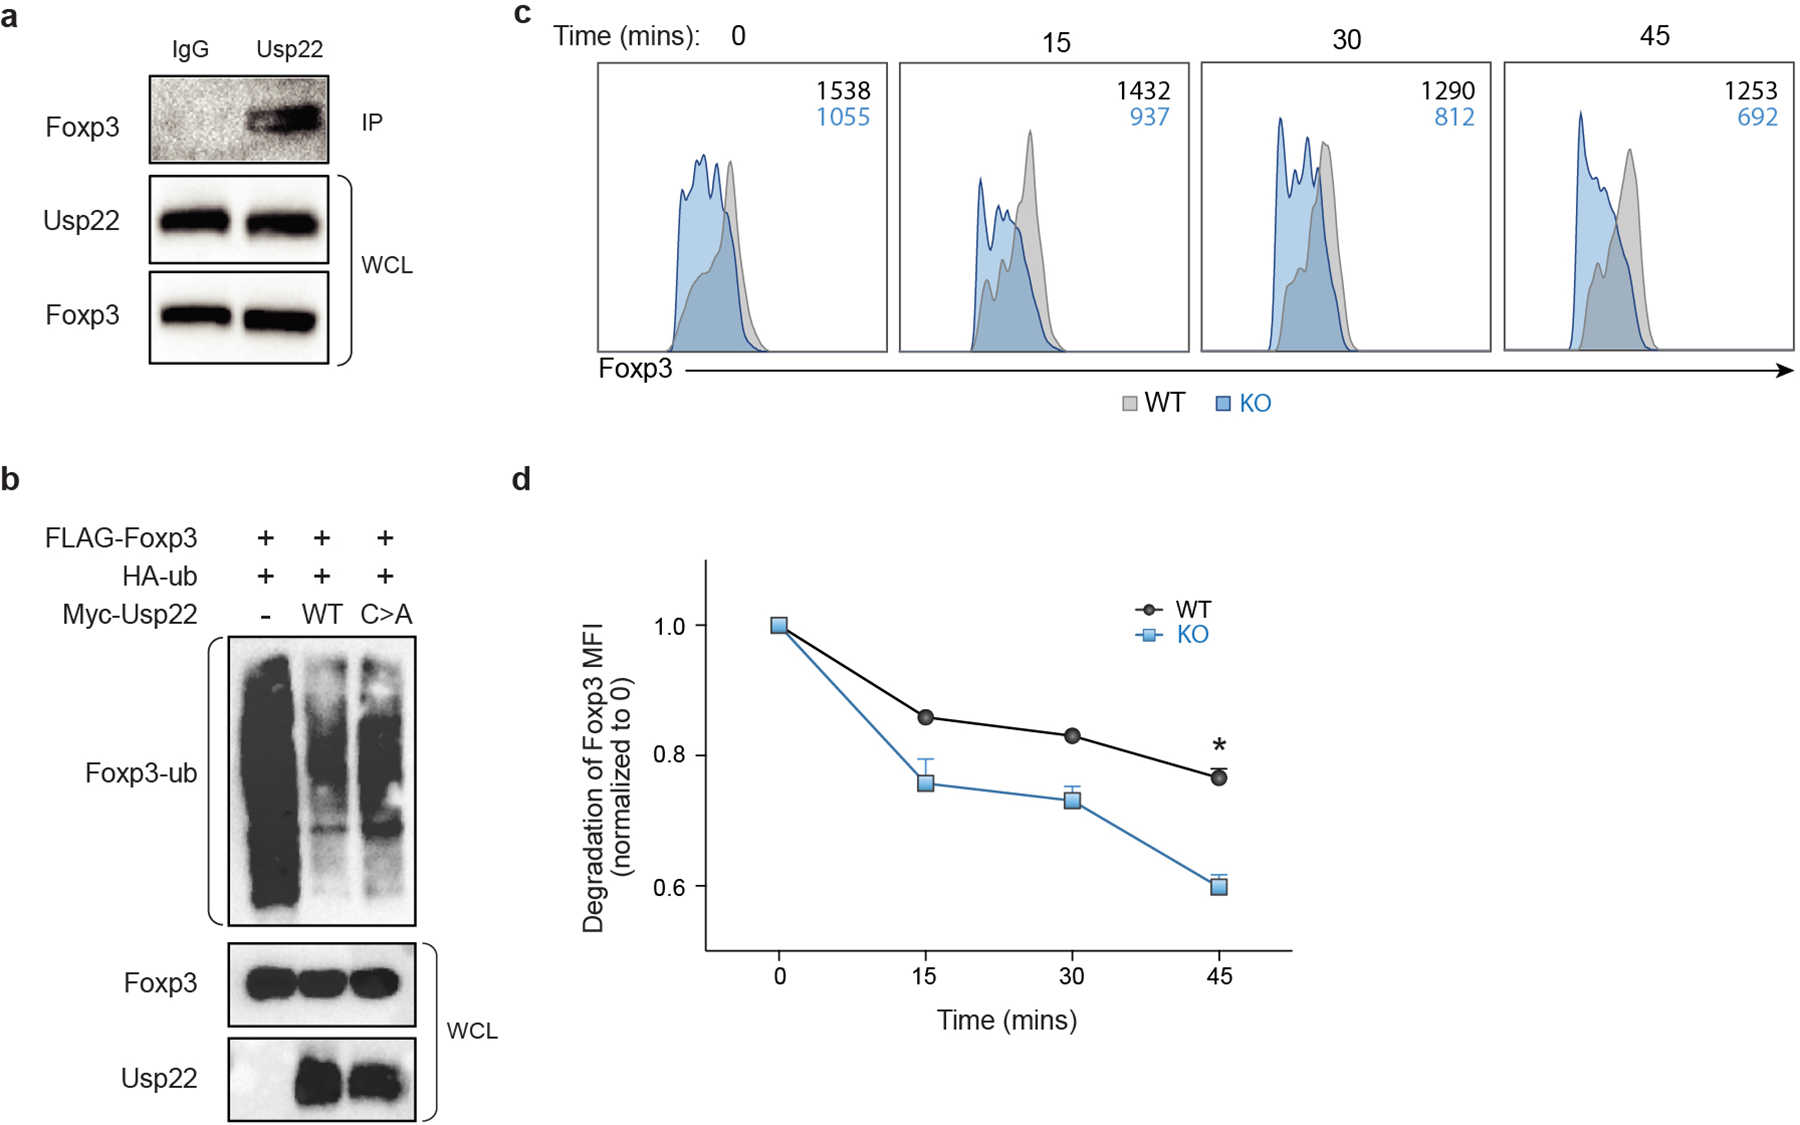
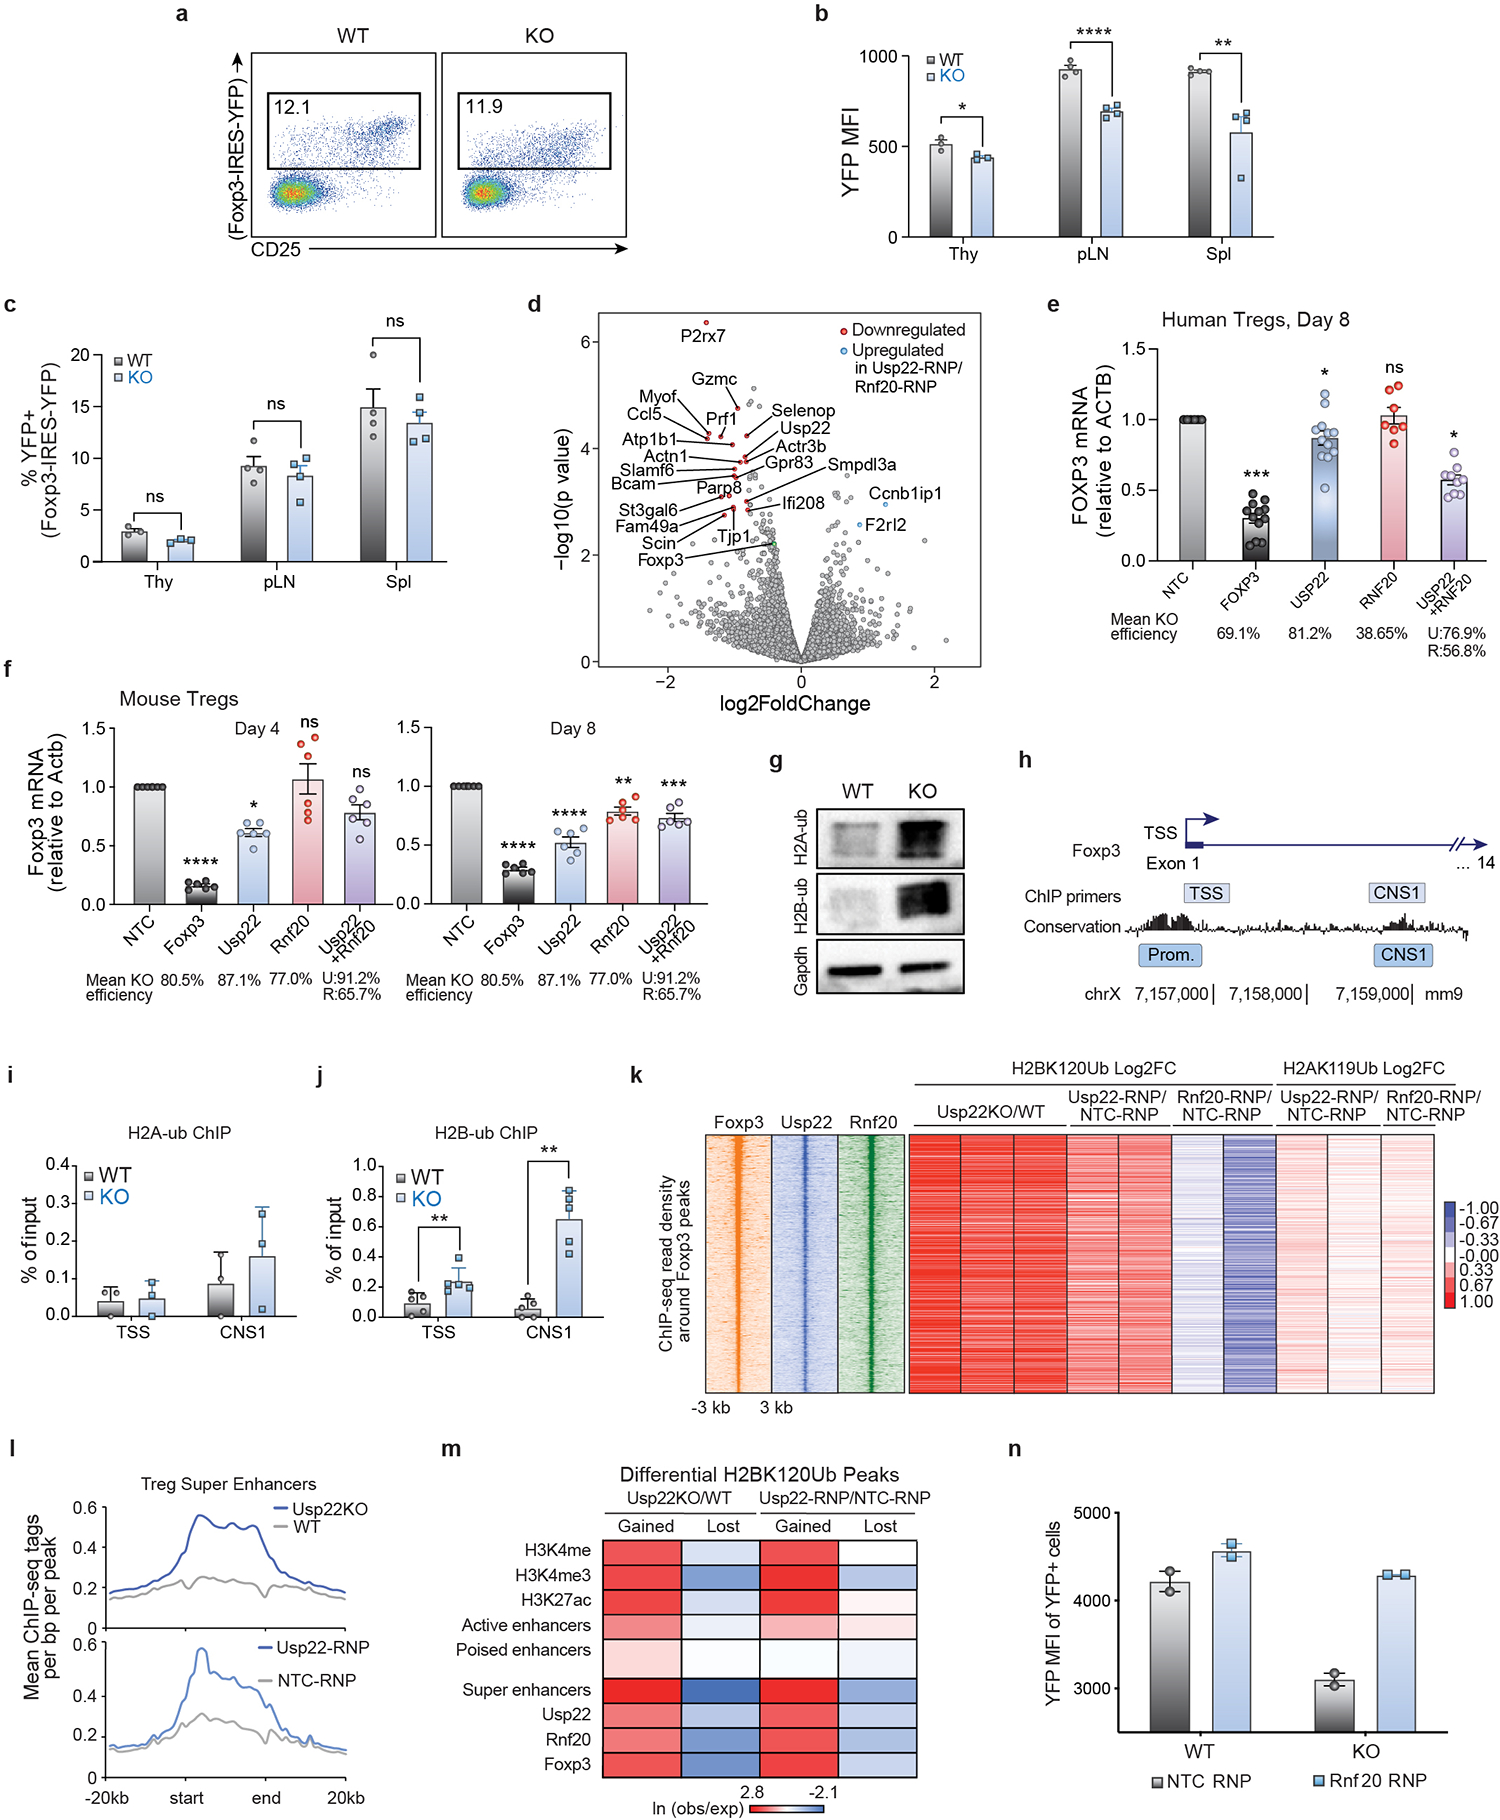
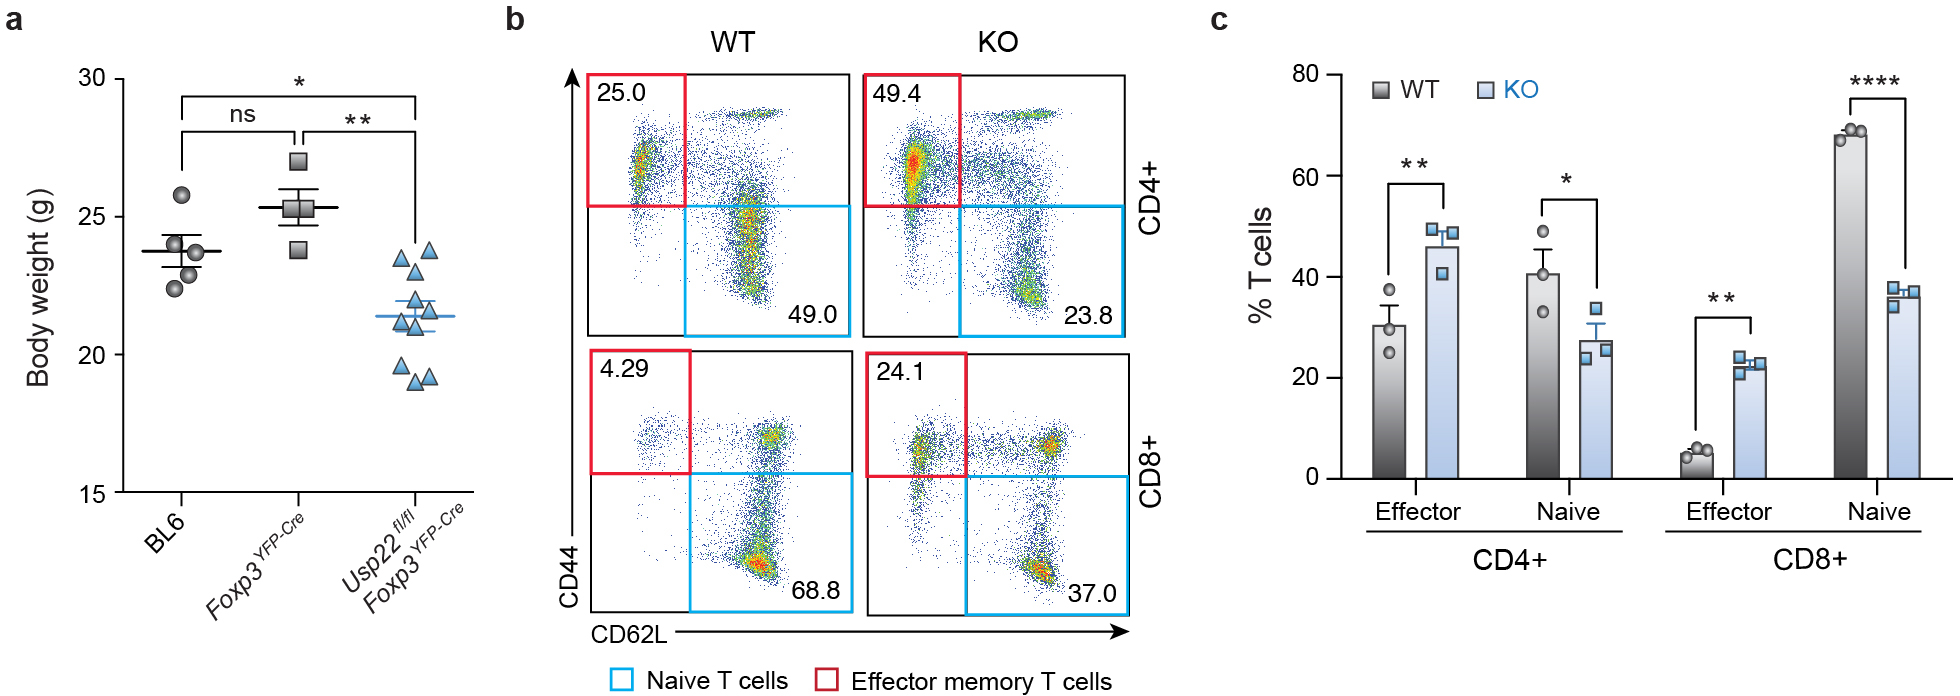
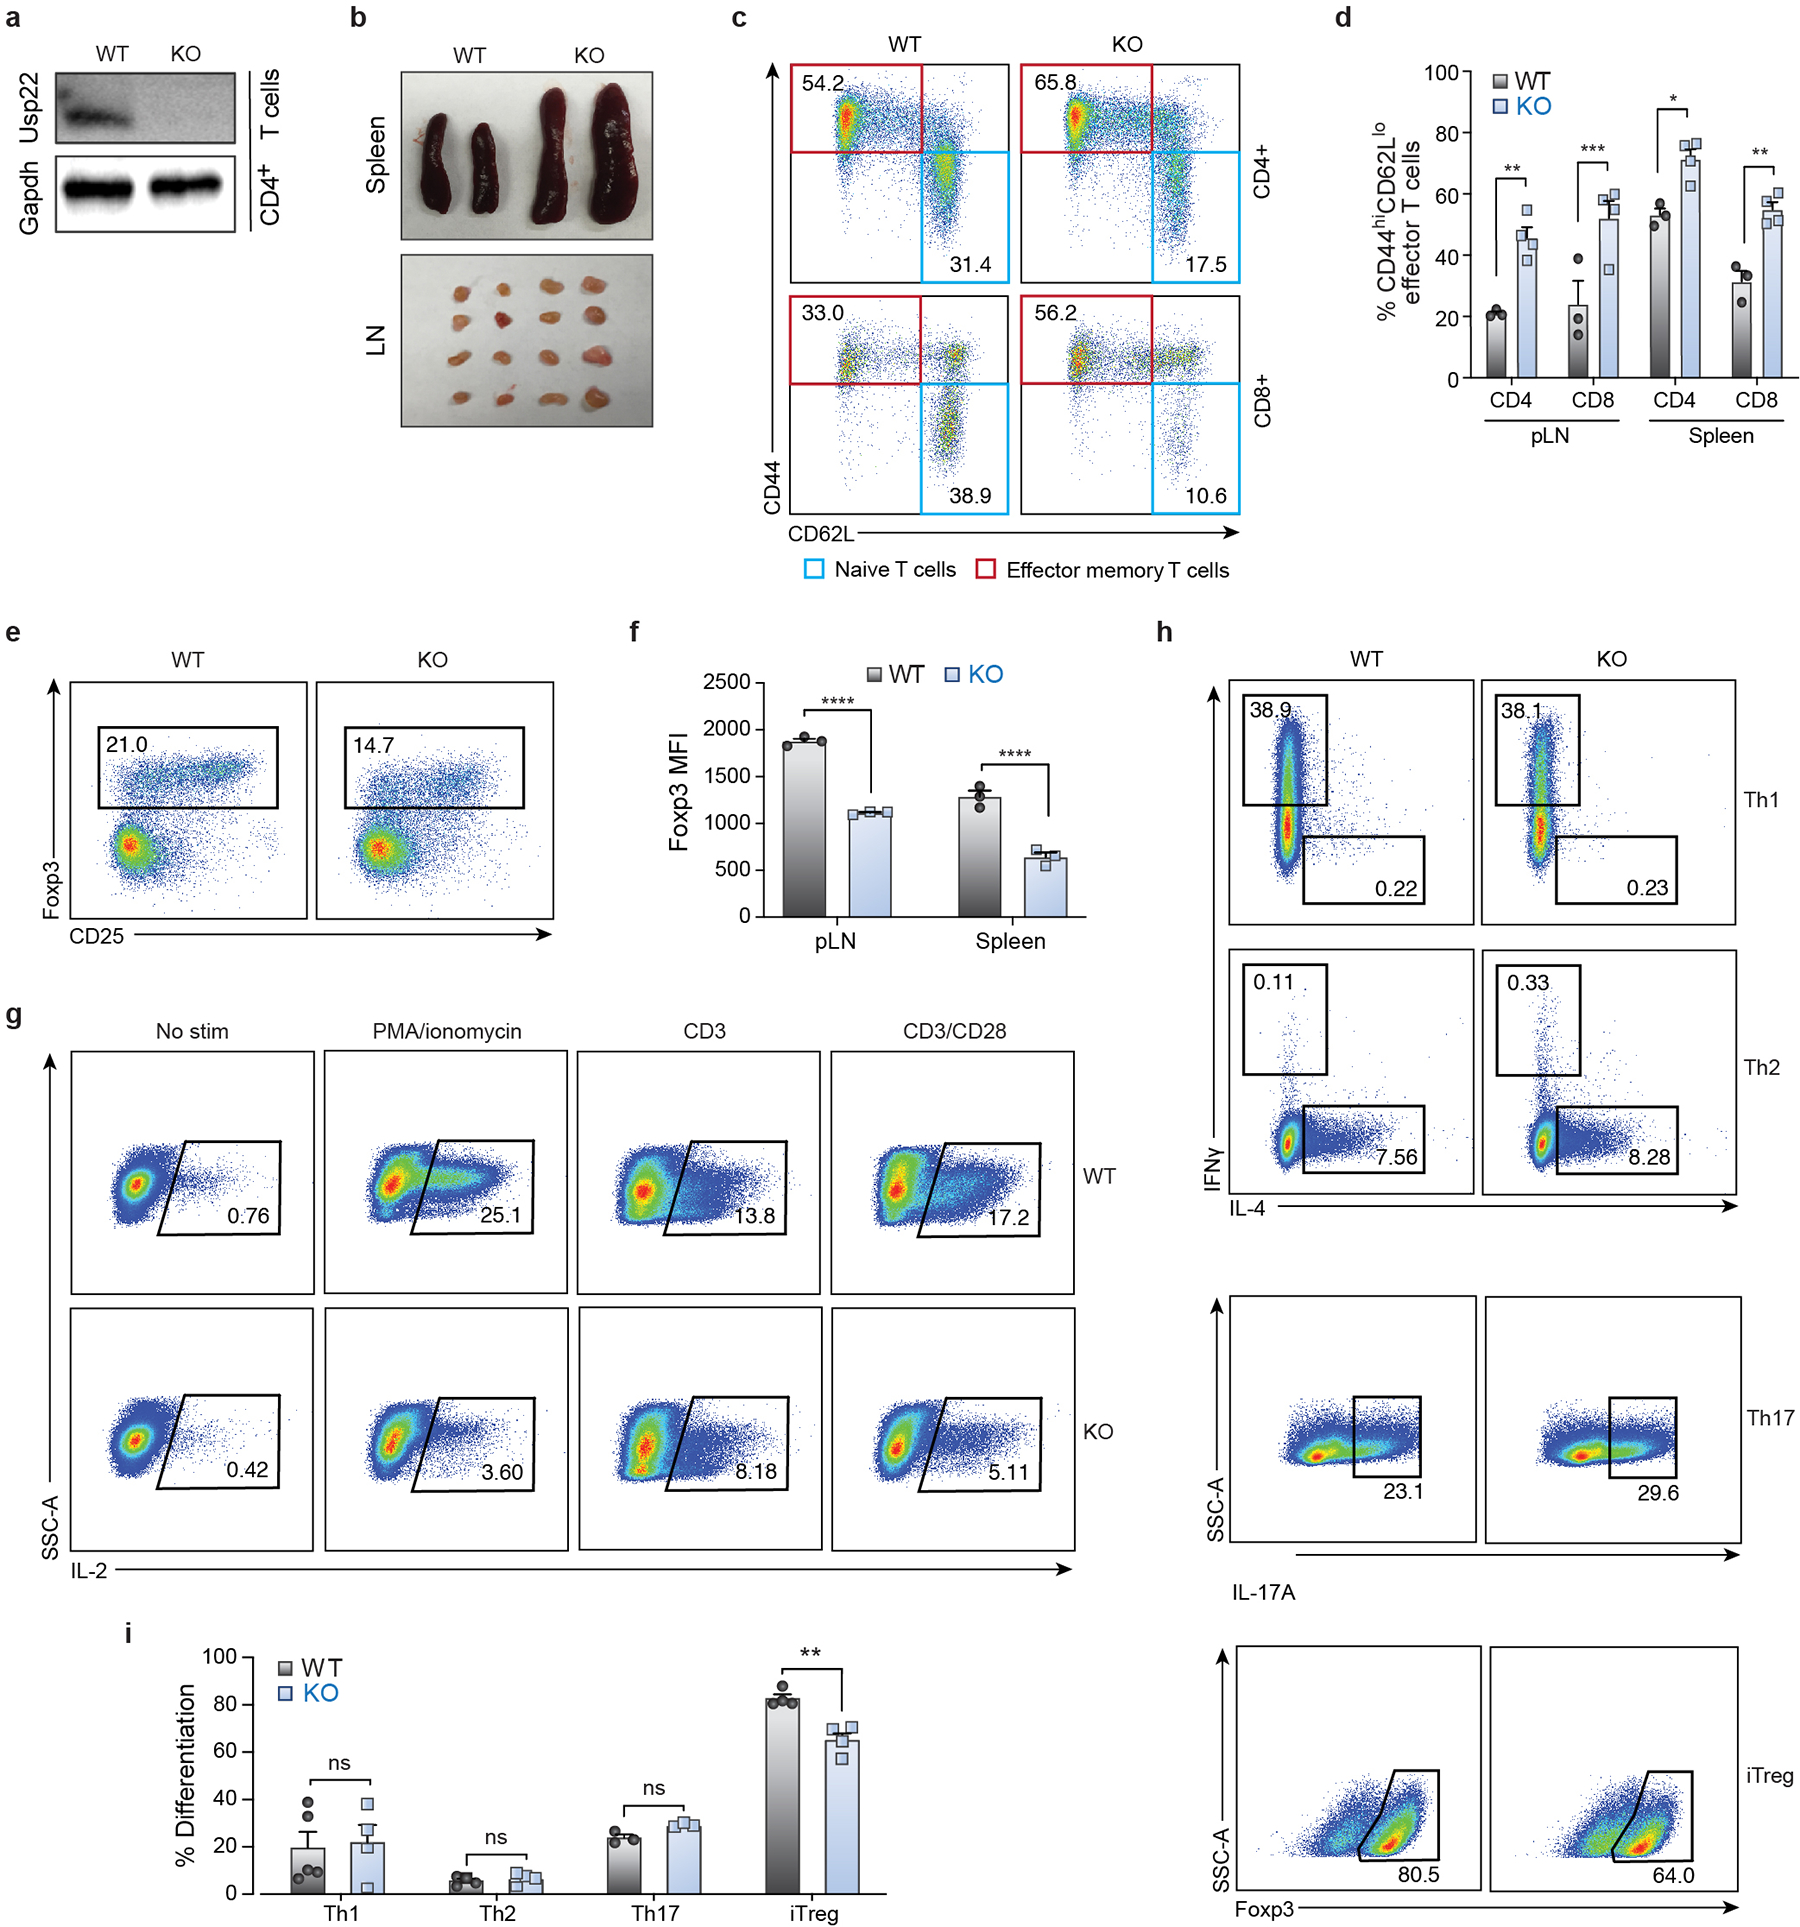
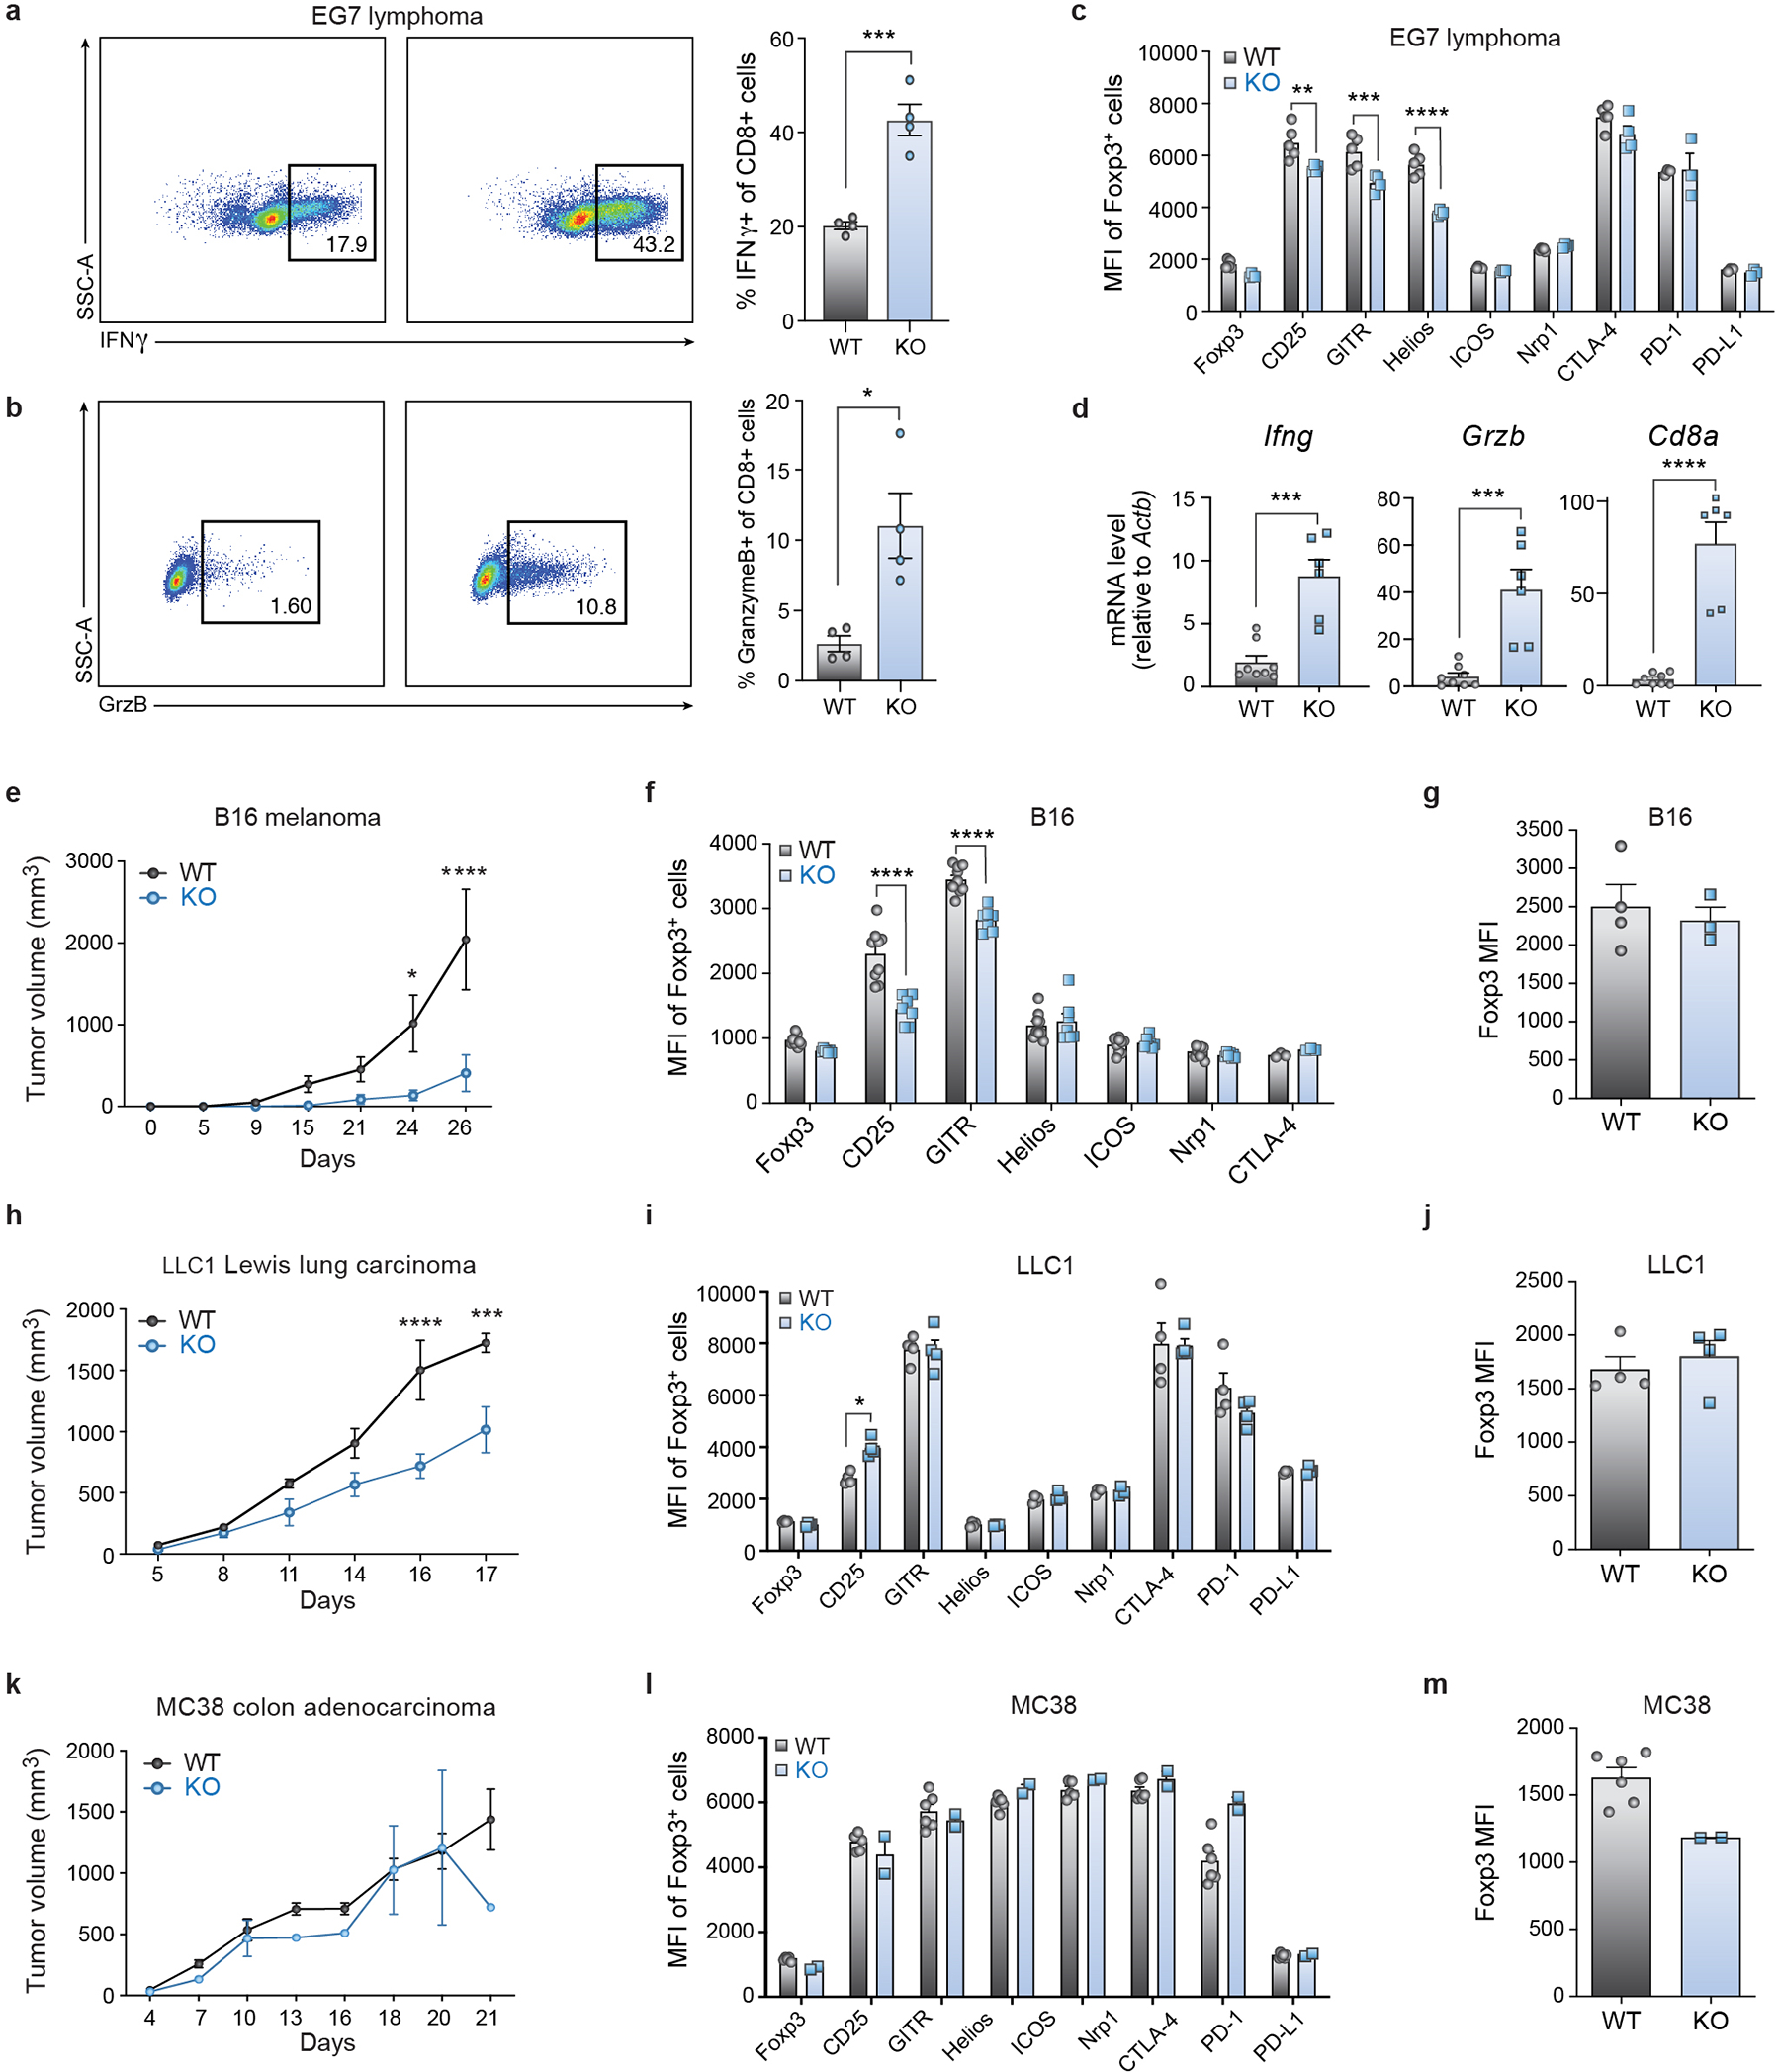
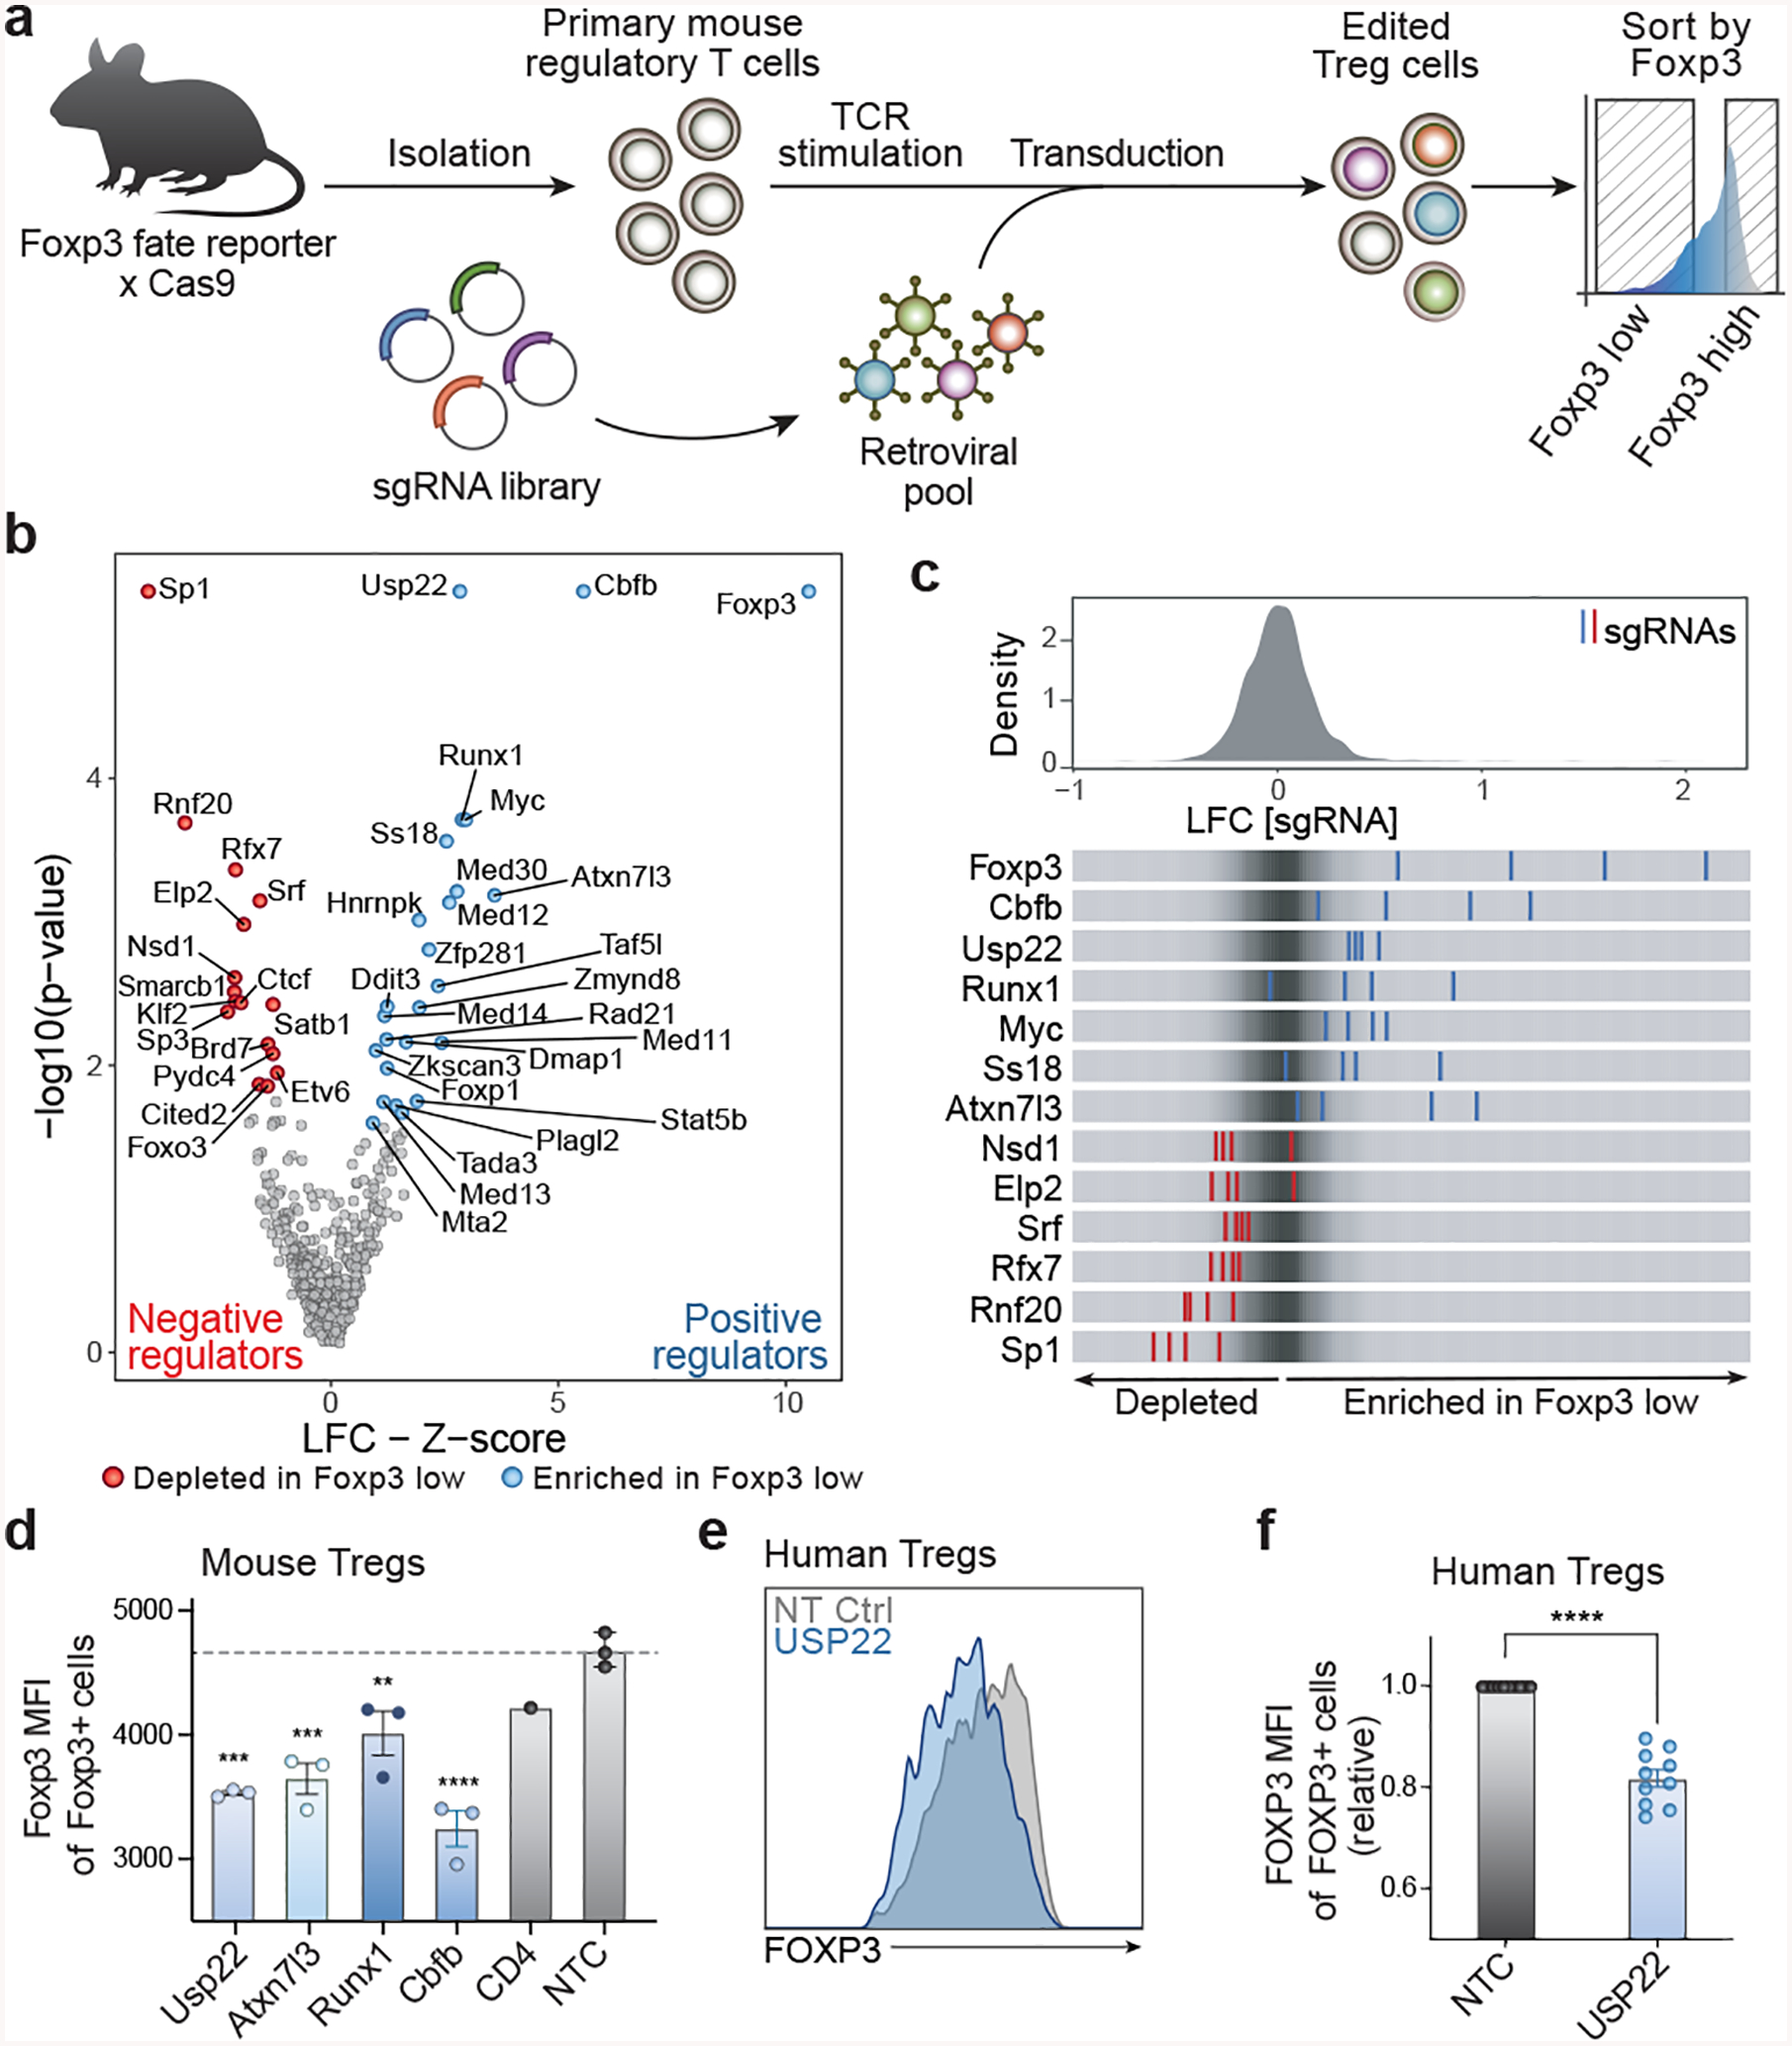
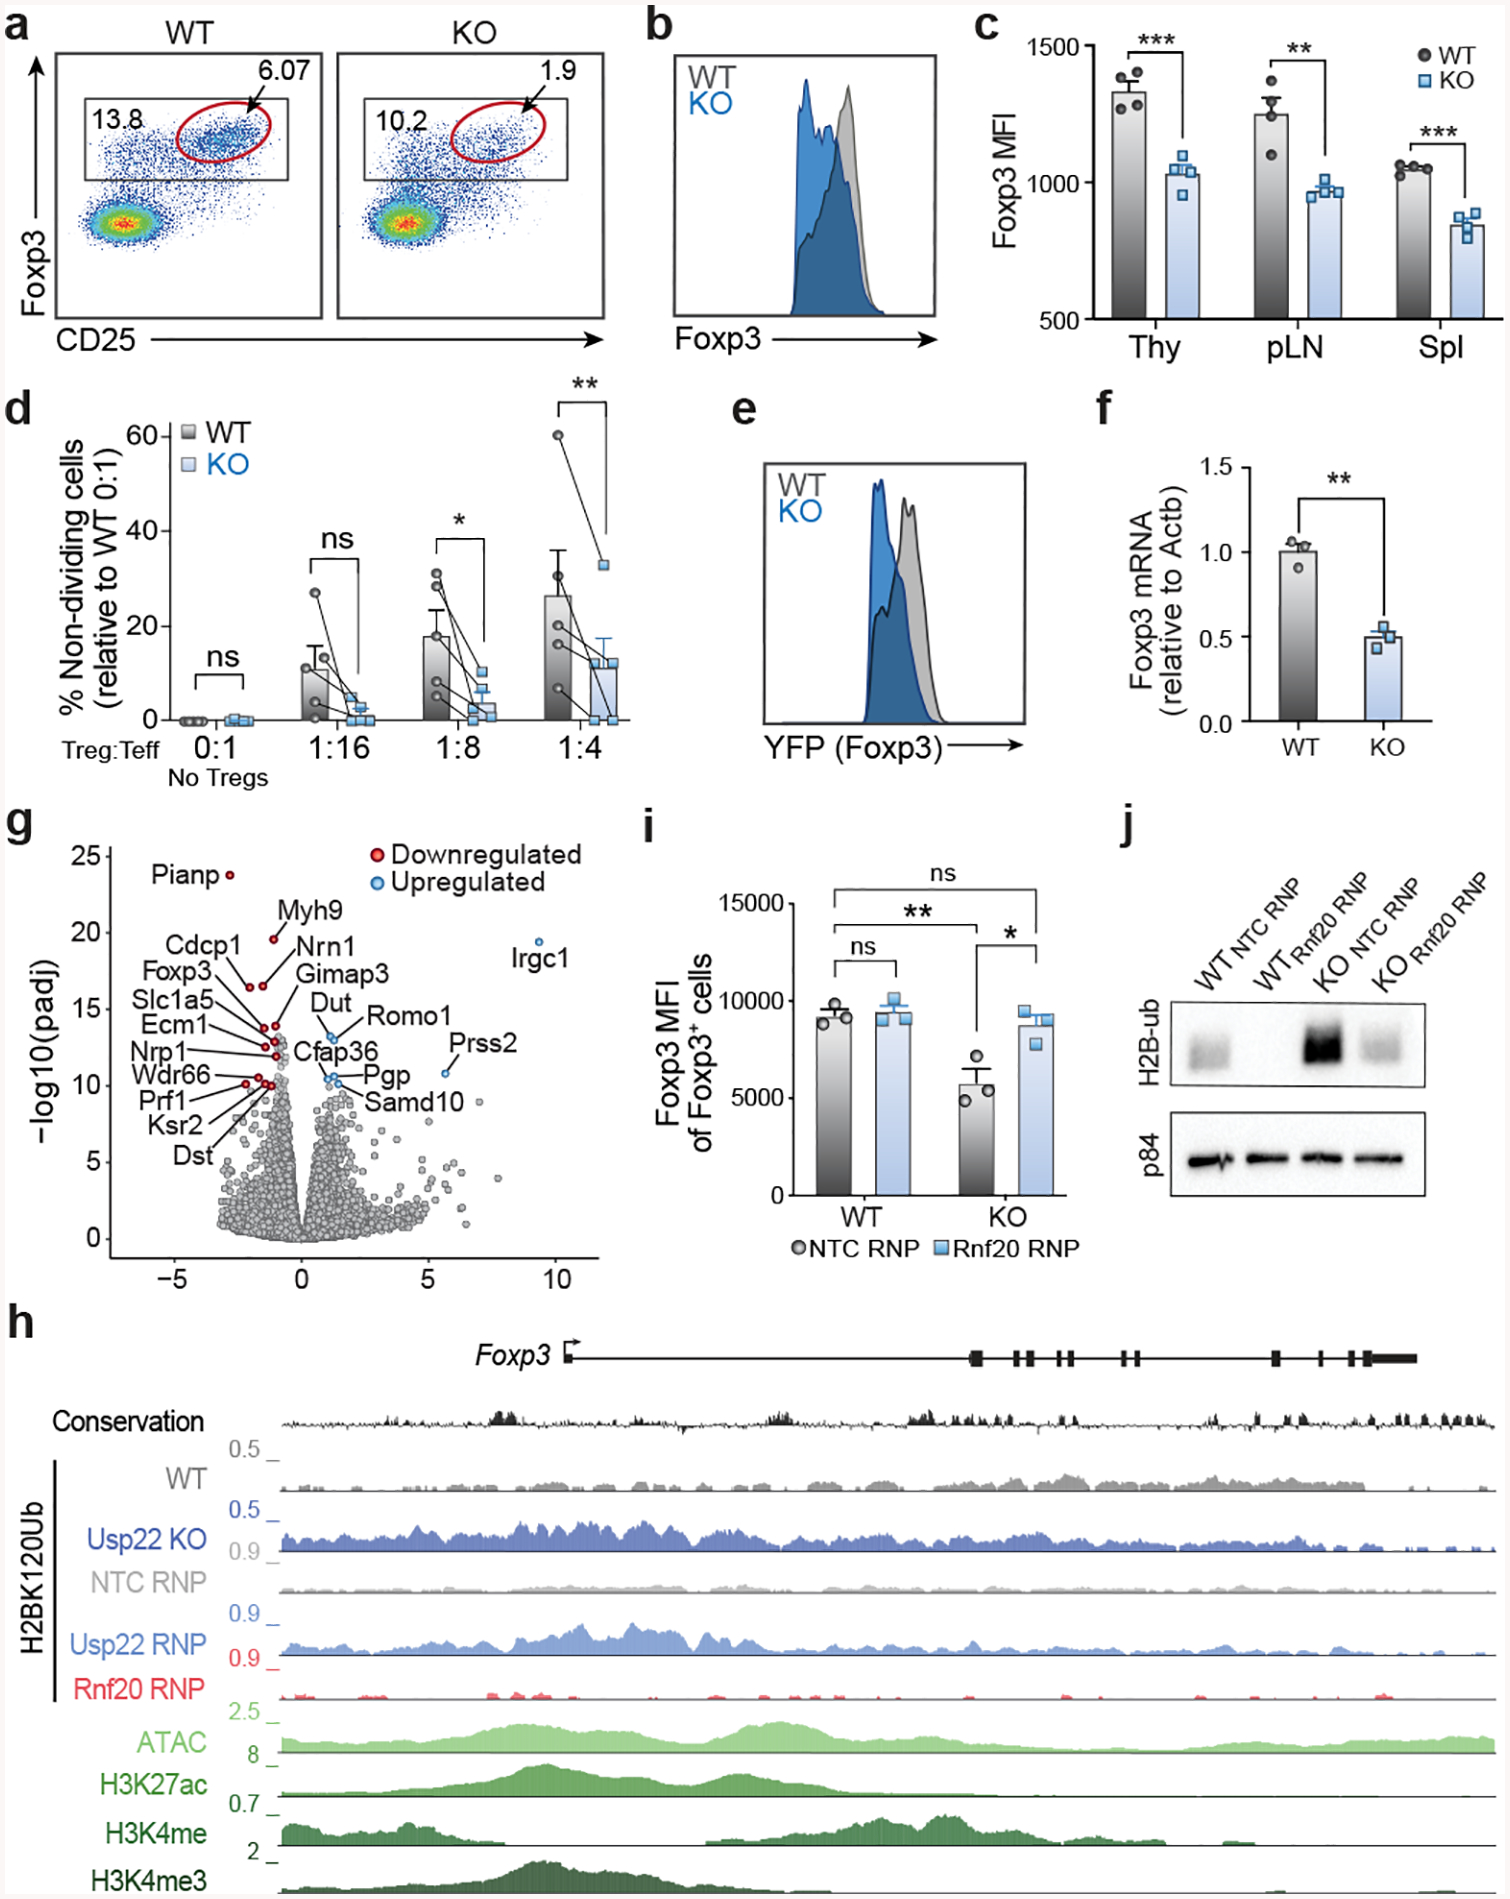
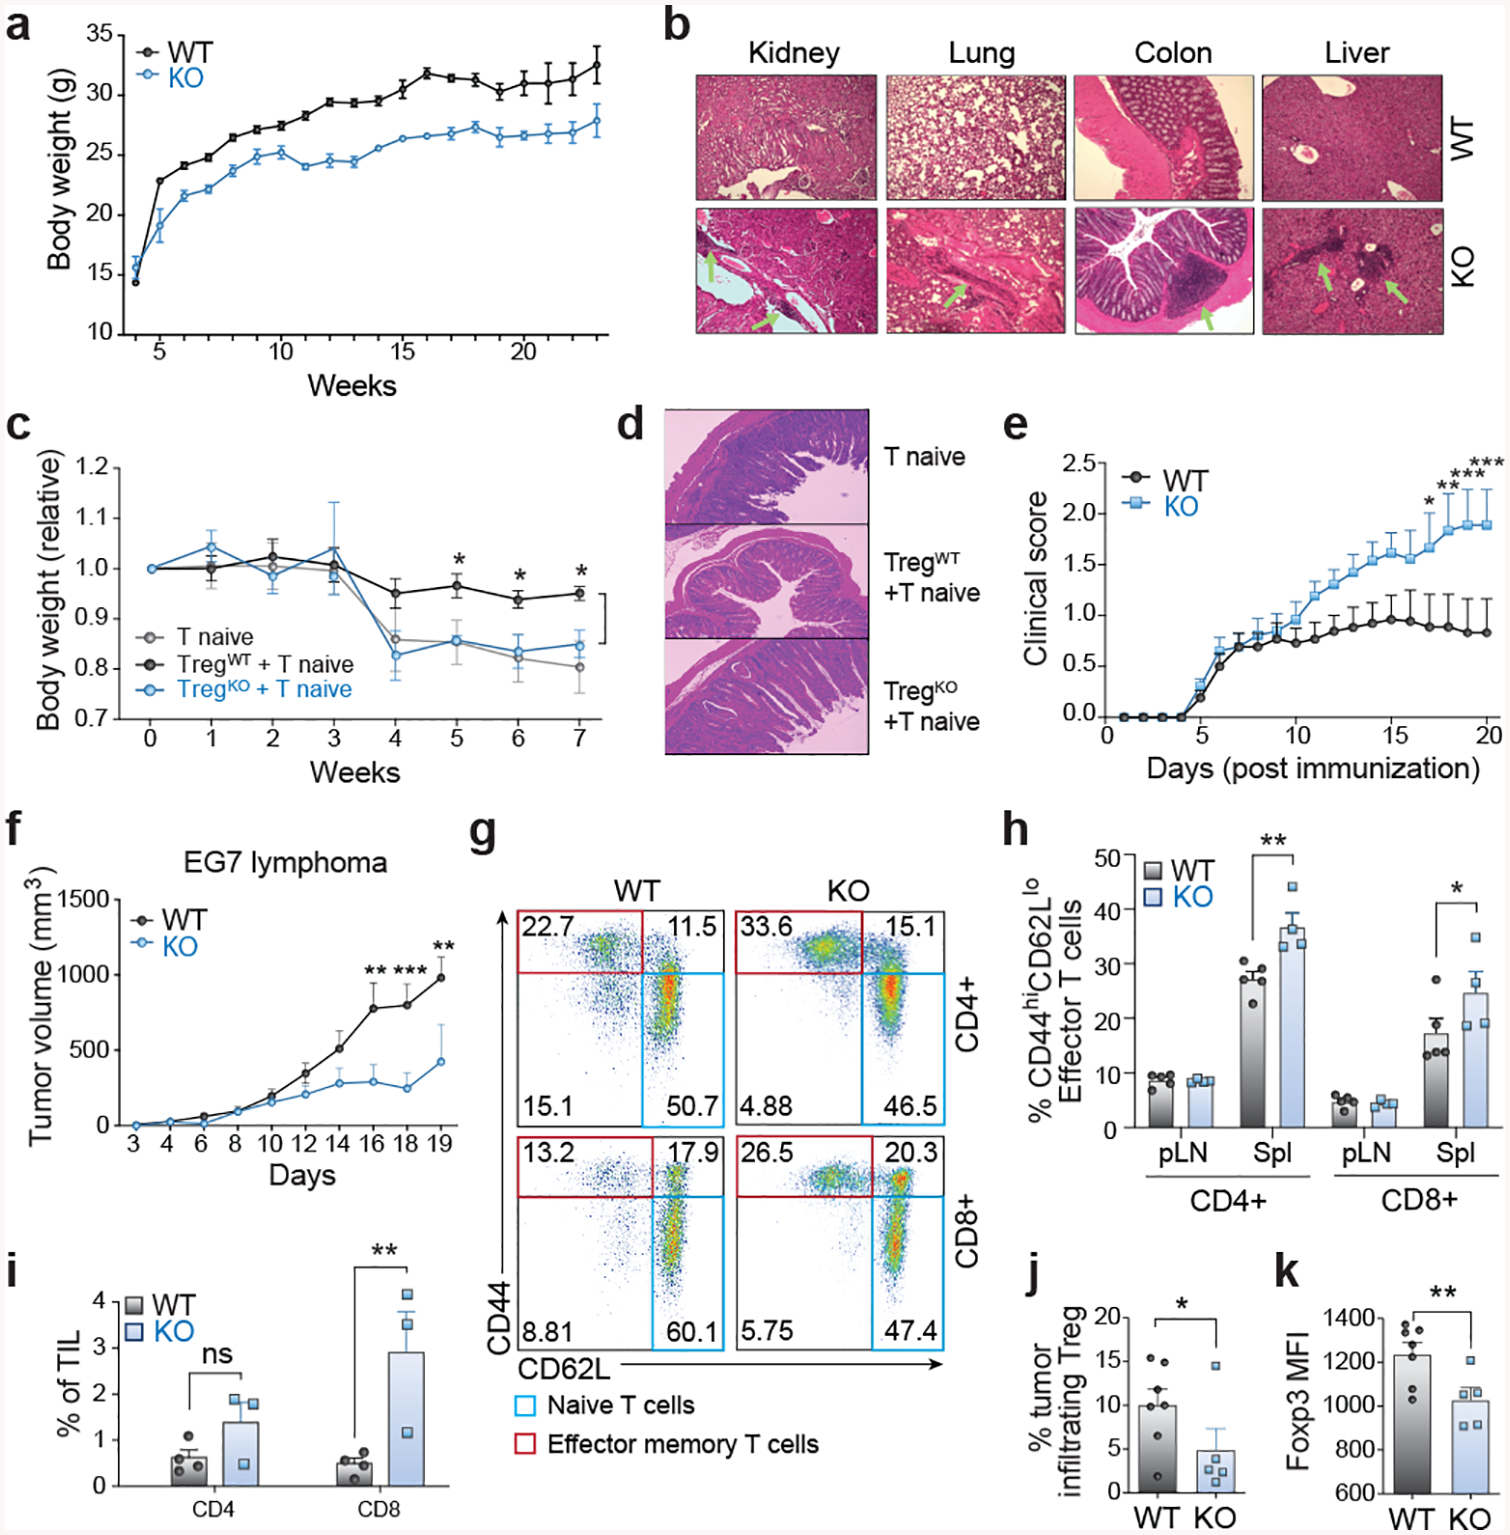
Regulatory T (Treg) cells are required to control immune responses and maintain homeostasis, but are a significant barrier to antitumour immunity1. Conversely, Treg instability, characterized by loss of the master transcription factor Foxp3 and acquisition of proinflammatory properties2, can promote autoimmunity and/or facilitate more effective tumour immunity3,4. A comprehensive understanding of the pathways that regulate Foxp3 could lead to more effective Treg therapies for autoimmune disease and cancer. The availability of new functional genetic tools has enabled the possibility of systematic dissection of the gene regulatory programs that modulate Foxp3 expression. Here we developed a CRISPR-based pooled screening platform for phenotypes in primary mouse Treg cells and applied this technology to perform a targeted loss-of-function screen of around 500 nuclear factors to identify gene regulatory programs that promote or disrupt Foxp3 expression. We identified several modulators of Foxp3 expression, including ubiquitin-specific peptidase 22 (Usp22) and ring finger protein 20 (Rnf20). Usp22, a member of the deubiquitination module of the SAGA chromatin-modifying complex, was revealed to be a positive regulator that stabilized Foxp3 expression; whereas the screen suggested that Rnf20, an E3 ubiquitin ligase, can serve as a negative regulator of Foxp3. Treg-specific ablation of Usp22 in mice reduced Foxp3 protein levels and caused defects in their suppressive function that led to spontaneous autoimmunity but protected against tumour growth in multiple cancer models. Foxp3 destabilization in Usp22-deficient Treg cells could be rescued by ablation of Rnf20, revealing a reciprocal ubiquitin switch in Treg cells. These results reveal previously unknown modulators of Foxp3 and demonstrate a screening method that can be broadly applied to discover new targets for Treg immunotherapies for cancer and autoimmune disease.


Conflict of interest statement

Declaration of Interests

The authors declare competing financial interests: T.L.R. is a co-founder of Arsenal Biosciences. A.M. is a co-founder of Spotlight Therapeutics and Arsenal Biosciences. A.M. has served as an advisor to Juno Therapeutics, is a member of the scientific advisory board at PACT Pharma, and is an advisor to Trizell. A.M. owns stock in Arsenal Biosciences, Spotlight Therapeutics and PACT Pharma. The Marson lab has received sponsored research support from Juno Therapeutics, Epinomics, Sanofi, and a gift from Gilead. J.A.B. is a co-founder of Sonoma BioTherapeutics; a consultant for Juno, a Celgene company; a stock holder and member of the Board of Directors on Rheos Medicines; and a stock holder and member of the Scientific Advisory Boards of Pfizer Center for Therapeutic Innovation, Vir Therapeutics, Arcus Biotherapeutics, Quentis Therapeutics, Solid Biosciences, and Celsius Therapeutics. J.A.B. owns stock in MacroGenics Inc., Vir Therapeutics, Arcus Biotherapeutics, Quentis Therapeutics, Solid Biosciences, Celsius Therapeutics, and Kadmon Holdings. A patent application has been filed based on the screen data described here.

Figures

Extended Data Fig. 1.
Extended Data Fig. 1.. Design and Quality Control of Targeted Pooled CRISPR Screen in Primary Mouse Tregs
a) Design strategy for selection of genes for unbiased targeted library of 493 targets, including 490 nuclear factors and 3 control targets (NT, GFP, and RFP). Genes were selected based on gene ontology (GO) annotation and then sub-selected based on highest expression across any CD4 T cell subset for a total of 2,000 sgRNAs. b) Diagram of MSCV expression vector with Thy1.1 reporter used for retroviral transduction of the sgRNA library. c) Detailed timeline schematic of the 12-day targeted screen pipeline. Arrows indicate when the cells were split, and media was replenished. d) Retroviral transduction efficiency of the targeted library in primary mouse Tregs shown by Thy1.1 surface expression measured by flow cytometry. The infection was scaled to achieve a high efficiency multiplicity of infection. e) Foxp3 expression from screen input, output and control cells measured by flow cytometry. Top: Foxp3 expression from input Foxp3+ purified Tregs as measured by GFP expression on Day 0. Middle: Foxp3 expression as measured by endogenous intracellular staining from control Tregs (not transduced with library) on Day 12. Bottom: Foxp3 expression as measured by endogenous intracellular staining from screen Tregs (transduced with library) on Day 12. f) Targeted screen (2,000 guides) shows that sgRNAs targeting Foxp3 and Usp22 were enriched in Foxp3 low cells (blue). Non-targeting control (NT Ctrl) sgRNAs were evenly distributed across the cell populations (black). g) Distribution of read counts after next generation sequencing of sgRNAs of sorted cell populations, Foxp3high and Foxp3low. h) Schematic of experimentally determined and predicted protein-protein interactions between top hits, 16 negative regulators (red) and 25 positive regulators (red), generated by STRING-db. Black lines connect interacting proteins and dotted lines outline selected known protein complexes. All data are presented as mean ±SEM. ns indicates no significant difference, *P < 0.05, **P < 0.01, ***P < 0.001, ****P < 0.0001. The exact sample sizes (n), p-values, statistical tests and number of times the experiment was replicated can be found in the “Statistics and Reproducibility” section.
Extended Data Figure 2.
Extended Data Figure 2.. Validation of Foxp3 Modulators in Primary Mouse and Human Tregs with Cas9 RNP Electroporation.
a) Overview of orthogonal validation strategy using arrayed electroporation of Cas9 RNPs in Tregs. b) Foxp3 expression 4 days post electroporation of Cas9 RNPs in mouse Tregs as measured by flow cytometry of top screen hits. Each row shows 3 histograms layered on top of one another (1–2 for controls) with each representing effects of independent gRNAs for each target gene. Percentages shown on the right depict the average frequency of Foxp3+ cells across gRNAs targeting each gene. c) Percentage of Foxp3- cells of live, CD4+ cells 4 days post electroporation of Cas9 RNPs in mouse Tregs as measured by flow cytometry of top screen hits. Each data point represents an independent sgRNA for each target gene. d) Foxp3 MFI of Foxp3+ mouse Tregs for 3–4 distinct gRNAs targeting each gene paired with the mean KO efficiency (top) for each guide as determined by TIDE analysis. e) Representative flow plots depicting FOXP3 and CD25 expression 7 days post electroporation of Cas9 RNPs targeting USP22 or NT Ctrl in human Tregs. The subpopulation of cells with the highest expression of FOXP3 and CD25 (FOXP3hiCD25hi) is highlighted with a red gate. f) Percentage of FOXP3+ cells from human Tregs electroporated with Cas9 RNPs targeting USP22 or NT Ctrl in 10 biological replicates. Lines connect paired samples. g) Percentage of FOXP3hiCD25hi cells from human Tregs electroporated with Cas9 RNPs targeting USP22 or NT Ctrl in 10 biological replicates. h) FOXP3 MFI of human Tregs for 3–4 distinct gRNAs targeting each gene paired with the mean KO efficiency (top) for each guide as determined by TIDE analysis. i) Simple linear regression of FOXP3 MFI (y-axis) by percentage of editing efficiency determined by TIDE analysis (x-axis) for 4 gRNAs targeting USP22 in 2–4 biological donors. j) FOXP3 MFI of human Tregs electroporated with Cas9 RNPs with 2–3 distinct sgRNAs each in 2–4 biological donors; corresponding to panel h. Data points with less than 60% editing efficiency KO by TIDE analysis were excluded from the graph. All data are presented as mean ±SEM. ns indicates no significant difference, *P < 0.05, **P < 0.01, ***P < 0.001, ****P < 0.0001. The exact sample sizes (n), p-values, statistical tests and number of times the experiment was replicated can be found in the “Statistics and Reproducibility” section.
Extended Data Fig. 3.
Extended Data Fig. 3.. Design and Validation of Treg-specific Usp22 Knockout Mice.
a) Diagram of the murine Usp22 locus. Targeting vector contains IRES-lacZ and a neo cassette inserted into exon 2. b) Genotyping by PCR showed a 600-bp band for the wild-type allele and a 400-bp band for mutant allele, simultaneously in the homozygous floxed (f/f) mice. c) Western blot analysis of Usp22 in CD4+CD25 conventional T cells (Tconv) and CD4+CD25+ Treg cells isolated from Usp22+/+Foxp3YFP-Cre WT and Usp22fl/flFoxp3YFP-Cre KO mice. Gapdh was used as a loading control. d) Statistical analysis of CD4+Foxp3+ Treg frequencies, corresponding to Figure 2c. e) Western blot analysis of Foxp3 protein level from Tregs isolated from spleen and LN of Usp22+/+Foxp3YFP-Cre WT or Usp22fl/flFoxp3YFP-Cre KO mice. Gapdh was used as a loading control. f) iTreg differentiation of naïve CD4+ T cells from Usp22+/+Foxp3YFP-Cre WT or Usp22fl/flFoxp3YFP-Cre KO mice with titration of TGF-β (as indicated). g) Summary of iTreg differentiation of naïve CD4+ T cells from Usp22+/+Foxp3YFP-Cre WT or Usp22fl/flFoxp3YFP-Cre KO mice with titration of TGF-β (as indicated). h) In vitro suppressive activity of Tregs assessed by the division of naïve CD4+CD25 T cells. Naïve T cells were labeled with cytosolic cell proliferation dye and activated by anti-CD3 and antigen presenting cells (irradiated splenocytes from wild-type mice, depleted of CD3+ T cells), then co-cultured at various ratios (as indicated above) with YFP+ Treg cells sorted from 8-week-old Usp22+/+Foxp3YFP-Cre WT or Usp22fl/flFoxp3YFP-Cre KO mice. Numbers indicate the percentage of non-dividing cells for each ratio. i) In vitro suppressive activity of control (pMIG-Control) or Foxp3+ (pMIG-Foxp3) transduced YFP+ Tregs sorted from Usp22+/+Foxp3YFP-Cre WT or Usp22fl/flFoxp3YFP-Cre KO mice. Naïve T cells were labeled with cytosolic cell proliferation dye and activated then co-cultured at 1:4 transduced YFP+ Treg cells to naïve T effectors (Teff). Numbers indicate the percentage of non-dividing cells for each ratio. j) Summary data of in vitro suppression experiments represented as frequency of non-dividing cells relative to WT 0:1 No Treg control, corresponding to panel i. Lines connect paired samples. All data are presented as mean ±SEM. ns indicates no significant difference, *P < 0.05, **P < 0.01, ***P < 0.001, ****P < 0.0001. The exact sample sizes (n), p-values, statistical tests and number of times the experiment was replicated can be found in the “Statistics and Reproducibility” section. Source data for gels and blots can be found in Supplementary Figure 1.
Extended Data Fig. 4.
Extended Data Fig. 4.. Usp22 Acts as Deubiquitinase to Control Post-Translational Foxp3 Expression.
a) Endogenous interaction of Usp22 and Foxp3 in murine iTreg cells from WT mice. Rabbit anti-Usp22 antibody was used to perform the immunoprecipitation and mouse anti-Foxp3 antibody was used to detect the bound Foxp3. Normal rabbit IgG was used as control. Whole cell lysates (WCL) were used as sample processing controls. b) Ubiquitination assay of Foxp3. HEK293 cells were co-transfected with Flag-Foxp3 and HA-ubiquitin (HA-ub) along with either Myc-empty vector, Myc-Usp22, or the catalytically inactive mutant Myc-Usp22C185A (C>A), and then immunoprecipitated with anti-Flag and immunoblotted for HA-ubiquitin (Foxp3-ub). Whole cell lysates (WCL) were used as sample processing controls. c) Splenocytes isolated from Usp22+/+Foxp3YFP-Cre WT or Usp22fl/flFoxp3YFP-Cre KO mice were treated with 200 μg/ml cycloheximide (CHX) for the indicated time course. Inset numbers for each histogram indicate the MFI of Foxp3 in Tregs (black=WT, blue=KO). d) Foxp3 MFI from splenic CD4+CD25+Foxp3+ Treg population treated with 200 μg/ml cycloheximide (CHX) for the indicated time course, n=3; corresponding to panel c. All data are presented as mean ±SEM. ns indicates no significant difference, *P < 0.05, **P < 0.01, ***P < 0.001, ****P < 0.0001. The exact sample sizes (n), p-values, statistical tests and number of times the experiment was replicated can be found in the “Statistics and Reproducibility” section. Source data for blots can be found in Supplementary Figure 1.
Extended Data Fig. 5.
Extended Data Fig. 5.. Usp22 Regulates Foxp3 through Transcriptional Mechanisms.
a) Representative flow cytometry analysis of the YFP+ Treg population (gated on CD4+ cells) from the spleen and lymph nodes of Usp22+/+Foxp3YFP-Cre WT or Usp22fl/flFoxp3YFP-Cre KO mice. b) Statistical analysis of YFP MFI in CD4+YFP+ Tregs from the thymus (Thy), peripheral lymph nodes (pLN), and spleen (Spl) of Usp22+/+Foxp3YFP-Cre WT or Usp22fl/flFoxp3YFP-Cre KO mice. c) Statistical analysis of CD4+YFP+ Treg frequencies in Usp22+/+Foxp3YFP-Cre WT or Usp22fl/flFoxp3YFP-Cre KO mice, corresponding to panel b. d) Volcano plot for RNA sequencing of Usp22 RNP KO Tregs vs Rnf20 RNP KO murine Tregs. X-axis shows log2FoldChange (LFC). Y-axis shows the –log10 of the p-value as calculated by DESeq2. Genes downregulated in the Usp22 RNP KO compared to Rnf20 RNP KO are shown in red and genes upregulated are shown in blue defined by p-value <5e-3 and LFC > 0.8. Foxp3 (shown in green) trended down but did not reach significance. e) qPCR analysis of FOXP3 mRNA levels in human Tregs from 2 donors 8 days post-electroporation with Cas9 RNPs targeting NTC , FOXP3, USP22, RNF20 or both USP22 and RNF20. Normalized to the expression of β-ACTIN transcripts. Data are presented as mean ±SEM and are representative of at least two independent experiments. f) qPCR analysis of Foxp3 mRNA levels in mouse Tregs 4 and 8 days post-electroporation with Cas9 RNPs targeting NTC, Foxp3, Usp22, Rnf20 or both Usp22 and Rnf20. Normalized to the expression of β-actin transcripts. g) Western blot analysis of ubiquitinated histone 2A (H2AK119Ub; H2A-ub) and ubiquitinated histone 2B (H2BK120Ub; H2B-ub) from iTregs from Usp22+/+Foxp3YFP-Cre WT or Usp22fl/flFoxp3YFP-Cre KO mice. Gapdh was used as a loading control. Source data can be found in Supplementary Figure 1. h) Schematic of Foxp3 locus depicting PCR products used for ChIP-qPCR data shown in panel i and panel j. i) ChIP-qPCR data analysis for H2AK119Ub (H2A-ub) where primers amplified across the transcriptional start site (TSS) and the CNS1 enhancer region of the Foxp3 locus. Data are normalized to the input and are presented as mean ±SD. j) ChIP-qPCR data analysis for H2BK120Ub (H2B-ub) for PCR across the transcriptional start site (TSS) and across the CNS1 enhancer region of the Foxp3 locus. Data are normalized to the input and are presented as mean ±SD. k) Heatmap of ChIP-seq read density for Foxp3, Usp22, and Rnf20 at sites bound by Foxp3 (using previously published Foxp3 ChIP data), ranked by highest to lowest Foxp3 binding signal. The corresponding log2 fold change (log2fc) for either H2BK120Ub or H2AK119Ub upon Usp22 or Rnf20 deletion at these sites are plotted on the right, with each biological replicate shown as an individual column. l) Average ChIP-seq read density of H2BK120Ub at Treg super enhancers in control versus Usp22-deficient Tregs. m) Co-occurrence analysis showing the natural log of the ratio of the observed number of overlapping regions over the expected values for sites that either gain or lose H2BK120Ub in Usp22-deficient Tregs against publicly available histone modifications H3K4me, H3K4me3 and H3K27ac as well as enhancer classes, as described in the Methods. n) Analysis of reciprocal regulation of Foxp3 by deubiquitinase Usp22 and E3 ubiquitin ligase Rnf20. YFP MFI of Tregs sorted from Usp22+/+Foxp3YFP-Cre WT or Usp22fl/flFoxp3YFP-Cre KO mice and then electroporated with either NT control (NTC-RNP) or Rnf20 RNP, corresponding with Figure 2j where Foxp3 MFI from the same experiment is shown. All data are presented as mean ±SEM, unless otherwise stated. ns indicates no significant difference, *P < 0.05, **P < 0.01, ***P < 0.001, ****P < 0.0001. The exact sample sizes (n), p-values, statistical tests and number of times the experiment was replicated can be found in the “Statistics and Reproducibility” section.
Extended Data Fig. 6.
Extended Data Fig. 6.. Autoimmune Inflammation in Treg-specific Usp22 Knockout Mice.
a) Body weight differences (in grams, g) between 8-week-old, sex-matched C57BL/6 WT (BL6), Usp22+/+Foxp3YFP-Cre WT or Usp22fl/flFoxp3YFP-Cre KO mice. b) Representative flow cytometry analysis of CD44 and CD62L expression in splenic CD4+ and CD8+ T cells from aged 7-month-old Usp22+/+Foxp3YFP-Cre WT and Usp22fl/flFoxp3YFP-Cre KO mice. Numbers in quadrants indicate percentage of each cell population. c) The frequency of splenic CD4+ and CD8+ effector T cells (CD44hiCD62Llo) and naïve T cells (CD44loCD62Lhi) of aged 7-month-old Usp22+/+Foxp3YFP-Cre WT and Usp22fl/flFoxp3YFP-Cre KO mice summarized, corresponding to panel b. All data are presented as mean ±SEM. ns indicates no significant difference, *P < 0.05, **P < 0.01, ***P < 0.001, ****P < 0.0001. The exact sample sizes (n), p-values, statistical tests and number of times the experiment was replicated can be found in the “Statistics and Reproducibility” section.
Extended Data Figure 7.
Extended Data Figure 7.. T Cell-Specific Ablation of Usp22 Resulted in Decreased Foxp3 and Increased T Cell Activation.
a) Western blot analysis of Usp22 protein levels in CD4+ T cells isolated from spleens of Usp22fl/flLckCre KO and Usp22+/+LckCre WT mice. Gapdh was used as a loading control. Source data can be found in Supplementary Figure 1. b) Representative macroscopic images of spleens and peripheral lymph nodes (pLN) from 10-month-old Usp22fl/flLckCre KO and Usp22+/+LckCre WT mice. c) Representative flow cytometry plots showing CD44 and CD62L expression in CD4+ and CD8+ T cells from spleens of 10-month-old Usp22fl/flLckCre KO and Usp22+/+LckCre WT mice. d) Frequency of effector-memory T cells (CD44hiCD62Llo) in peripherallymph nodes (pLN) and spleens from 10-month-old Usp22fl/flLckCre KO and Usp22+/+LckCre WT mice. e) Representative flow cytometry plots showing the splenic CD4+Foxp3+ Treg population from 10-month-old Usp22fl/flLckCre KO and Usp22+/+LckCre WT mice. f) Foxp3 MFI of the CD4+Foxp3+ Treg population in the spleen and pLN from 10-month-old Usp22fl/flLckCre KO and Usp22+/+LckCre WT mice. g) IL-2 production by CD4+CD25 T cells under various stimulation conditions (as indicated) for 3 days was assessed by flow cytometry in Usp22fl/flLckCre KO and Usp22+/+LckCre WT mice. Although the dominant effect of Usp22-deficiency in T cells was increased T cell activation and lymphoproliferation, we found some evidence of impaired IL-2 production in conventional T cells. h) Usp22-deficiency in T cells led to a selective defect in iTreg differentiation. In vitro differentiation of CD4+ naïve T cells cultured under Th1, Th2, Th17 or sub-optimal TGF-β (1ng/mL) iTreg conditions from Usp22fl/flLckCre KO and Usp22+/+LckCre WT mice was assessed by flow cytometry. i) Summary of in vitro differentiation experiments showing percent differentiation, corresponding to panel h. All data are presented as mean ±SEM. ns indicates no significant difference, *P < 0.05, **P < 0.01, ***P < 0.001, ****P < 0.0001. The exact sample sizes (n), p-values, statistical tests and number of times the experiment was replicated can be found in the “Statistics and Reproducibility” section.
Extended Data Figure 8.
Extended Data Figure 8.. Tumor Growth is Inhibited in Treg-specific Usp22 Knockout Mice in Multiple Cancer Models.
a) Left: Representative flow cytometric analysis of splenic IFNγ in CD8+ T cells from EG7 tumor-bearing Usp22+/+Foxp3YFP-Cre WT or Usp22fl/flFoxp3YFP-Cre KO. Right: Statistical analysis of IFNγ production by splenic CD8+ T cells from EG7 tumor-bearing Usp22+/+Foxp3YFP-Cre WT or Usp22fl/flFoxp3YFP-Cre KO. b) Left: Representative flow cytometric analysis of splenic Granzyme B (GrzB) in CD8+ T cells from EG7 tumor-bearing Usp22+/+Foxp3YFP-Cre WT or Usp22fl/flFoxp3YFP-Cre KO. Right: Statistical analysis of Granzyme B production by splenic CD8+ T cells from EG7 tumor-bearing Usp22+/+Foxp3YFP-Cre WT or Usp22fl/flFoxp3YFP-Cre KO. c) The MFI of various Treg markers (as indicated) from splenic CD4+Foxp3+ Tregs from Usp22+/+Foxp3YFP-Cre WT or Usp22fl/flFoxp3YFP-Cre KO EG7 tumor-bearing mice, assessed by flow cytometry. d) qPCR analysis of Ifng, Gzmb and Cd8a mRNA levels in the tumor tissue of Usp22+/+Foxp3YFP-Cre WT or Usp22fl/flFoxp3YFP-Cre KO EG7 tumor-bearing mice. e) Tumor volumes from Usp22+/+Foxp3YFP-Cre WT or Usp22fl/flFoxp3YFP-Cre KO mice subcutaneously inoculated with 5×10⁴ B16 melanoma cells. For e, h, k, tumor volumes were measured every 2–3 days by scaling along 3 orthogonal axes (x, y, and z) and calculated as (xyz)/2. f) The MFI of various Treg markers (as indicated) from splenic CD4+Foxp3+ Tregs in Usp22+/+Foxp3YFP-Cre WT or Usp22fl/flFoxp3YFP-Cre KO B16 tumor-bearing mice, assessed by flow cytometry. g) Foxp3 MFI of Foxp3+ cells from tumor-infiltrating Tregs in Usp22+/+Foxp3YFP-Cre WT or Usp22fl/flFoxp3YFP-Cre KO B16 tumor-bearing mice. h) Tumor volumes from Usp22+/+Foxp3YFP-Cre WT or Usp22fl/flFoxp3YFP-Cre KO mice subcutaneously inoculated with 1×10⁶ LLC1 Lewis lung carcinoma cells. i) The MFI of various Treg markers (as indicated) from splenic CD4+Foxp3+ Tregs in Usp22+/+Foxp3YFP-Cre WT or Usp22fl/flFoxp3YFP-Cre KO LLC1 tumor-bearing mice, assessed by flow cytometry. j) Foxp3 MFI of Foxp3+ cells from tumor-infiltrating Tregs in Usp22+/+Foxp3YFP-Cre WT or Usp22fl/flFoxp3YFP-Cre KO LLC1 tumor-bearing mice. k) Tumor volumes from Usp22+/+Foxp3YFP-Cre WT or Usp22fl/flFoxp3YFP-Cre KO mice subcutaneously inoculated with 1×10⁶ MC38 colon adenocarcinoma cells. l) The MFI of various Treg markers (as indicated) from splenic CD4+Foxp3+ Tregs in Usp22+/+Foxp3YFP-Cre WT or Usp22fl/flFoxp3YFP-Cre KO MC38 tumor-bearing mice, assessed by flow cytometry. m) Foxp3 MFI of Foxp3+ cells from tumor-infiltrating Tregs in Usp22+/+Foxp3YFP-Cre WT or Usp22fl/flFoxp3YFP-Cre KO MC38 tumor-bearing mice. All data are presented as mean ±SEM. ns indicates no significant difference, *P < 0.05, **P < 0.01, ***P < 0.001, ****P < 0.0001. The exact sample sizes (n), p-values, statistical tests and number of times the experiment was replicated can be found in the “Statistics and Reproducibility” section.
Figure 1.
Figure 1.. Discovery and Validation of Regulators of Foxp3 in Primary Mouse Tregs Using a Targeted Pooled CRISPR Screen.
a) Diagram of pooled CRISPR screening platform in primary mouse Treg cells. b) Volcano plot for hits from the screen. X-axis shows Z-score for gene-level log2 fold-change (LFC); median of LFC for all single guide RNAs (sgRNAs) per gene, scaled. Y-axis shows the p-value as calculated by MAGeCK. Red are negative regulators (depleted in Foxp3 low cells), while blue dots show all positive regulators (enriched in Foxp3 low cells) defined by FDR < 0.5 and Z-score > 0.5. c) Top panel: distribution of sgRNA-level LFC values of Foxp3 low over Foxp3 high cells for 2,000 guides. Bottom panel: LFC for all four individual sgRNAs targeting genes enriched in Foxp3 low cells (blue lines) and depleted genes (red lines), overlaid on grey gradient depicting the overall distribution. d) Mean fluorescence intensity (MFI) of Foxp3 in Foxp3+ cells from data in Extended Data 2b. Each data point represents effects of an independent gRNA for each target gene. Statistics are based on comparison to non-targeting control (NTC). e) Representative histogram showing FOXP3 MFI (pre-gated on live cells) from human Tregs treated with non-targeting control (NTC) or USP22 Cas9 RNPs. f) Statistical analysis of FOXP3 MFI in human Tregs from 10 biological replicates. Tregs from each donor here were targeted with the same high efficiency gRNA (USP22–2). All data are presented as mean ±SEM. ns indicates no significant difference, *P < 0.05, **P < 0.01, ***P < 0.001, ****P < 0.0001. The exact sample sizes (n), p-values, statistical tests and number of times the experiment was replicated can be found in the “Statistics and Reproducibility” section.
Figure 2.
Figure 2.. Usp22 is Required for Foxp3 Maintenance and Treg Suppressive Function.
a) Representative flow cytometry analysis of the Treg population (gated on CD4+ cells) from the spleen of Usp22+/+Foxp3YFP-Cre WT or Usp22fl/flFoxp3YFP-Cre KO mice. A subset of Tregs with the highest expression of Foxp3 and CD25 is highlighted with a red gate. b) Histogram of Foxp3 expression in Foxp3+ Tregs from spleens of Usp22+/+Foxp3YFP-Cre WT or Usp22fl/flFoxp3YFP-Cre KO mice from panel a. c) Statistical analysis of Foxp3 MFI from CD4+Foxp3+ Tregs in thymus (Thy), peripheral lymph nodes (pLN) and spleen (Spl) of Usp22+/+Foxp3YFP-Cre WT or Usp22fl/flFoxp3YFP-Cre KO mice. d) Summary data of in vitro suppression experiments, corresponding to Extended Figure 3h. Lines connect paired samples. Data are presented as the frequency of non-dividing cells relative to WT 0:1 No Treg control, with any negative values after normalization replaced with 0. e) Histogram of YFP expression in Tregs from the spleen and lymph nodes of Usp22+/+Foxp3YFP-Cre WT or Usp22fl/flFoxp3YFP-Cre KO mice from Extended Data Fig. 5a. f) qPCR analysis of Foxp3 mRNA levels in sorted YFP+ cells of spleen from Usp22+/+Foxp3YFP-Cre WT or Usp22fl/flFoxp3YFP-Cre KO mice. g) Volcano plot for RNA sequencing of YFP+ Tregs sorted from Usp22+/+Foxp3YFP-Cre WT or Usp22fl/flFoxp3YFP-Cre KO mice. X-axis shows log2FoldChange (LFC). Y-axis shows the –log10 of the adjusted p-value (padj) as calculated by DESeq2. Genes downregulated in the KO are shown in red and genes upregulated are shown in blue defined by padj <1e-10 and LFC > 1. h) Genome tracks of ChIP-seq for H2BK120Ub at the Foxp3 locus in wild-type (WT), Usp22 KO, non-targeting control (NTC-RNP) treated, Usp22-RNP treated and Rnf20-RNP treated Tregs. Evolutionary conservation, ATAC-seq, and ChIP-Seq for H3K27ac, H3K4me3, and H3K4me in WT Tregs are also shown. i) Analysis of reciprocal regulation of Foxp3 by deubiquitinase Usp22 and E3 ubiquitin ligase Rnf20. Foxp3 MFI of Tregs sorted from Usp22+/+Foxp3YFP-Cre WT or Usp22fl/flFoxp3YFP-Cre KO mice and then electroporated with either NT control (NTC-RNP) or Rnf20 RNP. j) Western blot analysis of H2BK120Ub (H2B-ub) levels in Tregs sorted from Usp22+/+Foxp3YFP-Cre WT or Usp22fl/flFoxp3YFP-Cre KO mice and then electroporated with either NT control (NTC-RNP) or Rnf20 RNP; corresponding to panel i. p84 was used as a loading control. Source data can be found in Supplementary Figure 1. All data are presented as mean ±SEM. ns indicates no significant difference, *P < 0.05, **P < 0.01, ***P < 0.001, ****P < 0.0001. The exact sample sizes (n), p-values, statistical tests and number of times the experiment was replicated can be found in the “Statistics and Reproducibility” section.
Figure 3.
Figure 3.. Treg-Specific Ablation of Usp22 Results in Autoimmunity and Enhances Anti-Tumor Immunity
a) Body weight differences between Usp22+/+Foxp3YFP-Cre WT or Usp22fl/flFoxp3YFP-Cre KO littermate mice. b) Hematoxylin-and-eosin (H&E) staining of kidney, lung, colon and liver sections from 7-month-old Usp22+/+Foxp3YFP-Cre WT or Usp22fl/flFoxp3YFP-Cre KO mice. Original magnification at 100x (fold). c) Body weight of Rag−/− recipient mice over time after adoptive transfer of CD4+CD25CD44loCD62hi (CD45.1+) naïve T cells sorted from SJL mice alone or together with CD4+YFP+ (CD45.2+) Treg cells from 9-week-old Usp22+/+Foxp3YFP-Cre WT or Usp22fl/flFoxp3YFP-Cre KO mice, presented relative to weight at day 0. d) H&E staining of colon tissues from the Rag−/− recipient mice shown in panel c, 7 weeks post-transfer. Original magnification at 100x. e) Clinical severity of EAE in Usp22+/+Foxp3YFP-Cre WT or Usp22fl/flFoxp3YFP-Cre KO mice was monitored for 20 days post immunization with MOG peptide. f) EG7 lymphoma tumor volume in Usp22+/+Foxp3YFP-Cre WT or Usp22fl/flFoxp3YFP-Cre KO mice. Mice were subcutaneously inoculated with 1×10⁶ EG7 cells. Tumor volume was measured every 1–2 days by scaling along 3 orthogonal axes (x, y, and z) and calculated as (xyz)/2. g) Representative flow cytometry analysis of the expression of CD44 and CD62L in both CD4+ and CD8+ T cells of spleen from Usp22+/+Foxp3YFP-Cre WT or Usp22fl/flFoxp3YFP-Cre KO EG7 tumor-bearing mice. h) The frequency of effector T cells (CD44hiCD62Llo) from Usp22+/+Foxp3YFP-Cre WT or Usp22fl/flFoxp3YFP-Cre KO EG7 tumor-bearing mice summarized. i) Statistical analysis of tumor-infiltrating lymphocyte (TIL) percentages from EG7-bearing Usp22+/+Foxp3YFP-Cre WT or Usp22fl/flFoxp3YFP-Cre KO mice collected 19 days after tumor inoculation. j) Statistical analysis of tumor-infiltrating Treg percentages from EG7 tumor-bearing Usp22+/+Foxp3YFP-Cre WT or Usp22fl/flFoxp3YFP-Cre KO mice collected 19 days after tumor inoculation. k) Foxp3 MFI of the CD4+Foxp3+ EG7 tumor-infiltrating Treg population in Usp22+/+Foxp3YFP-Cre WT or Usp22fl/flFoxp3YFP-Cre KO mice summarized. All data are presented as mean ±SEM. ns indicates no significant difference, *P < 0.05, **P < 0.01, ***P < 0.001, ****P < 0.0001. The exact sample sizes (n), p-values, statistical tests and number of times the experiment was replicated can be found in the “Statistics and Reproducibility” section.

References

    1. Sakaguchi S, Yamaguchi T, Nomura T & Ono M Regulatory T Cells and Immune Tolerance. Cell 133, 775–787 (2008). - PubMed
    1. Zhou X et al. Instability of the transcription factor Foxp3 leads to the generation of pathogenic memory T cells in vivo. Nature Immunology 10, 1000–1007 (2009). - PMC - PubMed
    1. Bailey-Bucktrout SL & Bluestone JA Regulatory T cells: stability revisited. Trends in Immunology 32, 301–306 (2011). - PMC - PubMed
    1. Overacre-Delgoffe AE & Vignali DA A. Treg Fragility: A Prerequisite for Effective Antitumor Immunity? Cancer Immunol Res 6, 882–887 (2018). - PMC - PubMed
    1. Bluestone JA & Tang Q Treg cells—the next frontier of cell therapy. Science 362, 154–155 (2018). - PubMed

Method References

    1. Szklarczyk D et al. STRING v11: protein-protein association networks with increased coverage, supporting functional discovery in genome-wide experimental datasets. Nucleic Acids Res. 47, D607–D613 (2019). - PMC - PubMed
    1. Samstein RM et al. Foxp3 Exploits a Pre-Existent Enhancer Landscape for Regulatory T Cell Lineage Specification. Cell 151, 153–166 (2012). - PMC - PubMed
    1. Zhou X et al. Selective miRNA disruption in T reg cells leads to uncontrolled autoimmunity. The Journal of Experimental Medicine 205, 1983(2008). - PMC - PubMed
    1. Luche H, Weber O, Nageswara Rao T, Blum C & Fehling HJ Faithful activation of an extra-bright red fluorescent protein in ‘knock-in’ Cre-reporter mice ideally suited for lineage tracing studies. Eur. J. Immunol 37, 43–53 (2007). - PubMed
    1. Bailey-Bucktrout SL et al. Self-antigen driven activation induces instability of regulatory T cells during an inflammatory autoimmune response. Immunity 39, 949–962 (2013). - PMC - PubMed

Publication types

MeSH terms