. 2020 Jul;583(7814):90-95.
doi: 10.1038/s41586-020-2265-1. Epub 2020 May 6.

Whole-genome sequencing of a sporadic primary immunodeficiency cohort

James E D Thaventhiran #  1   2   3 Hana Lango Allen #  4   5   6   7 Oliver S Burren #  8   9 William Rae #  8   9 Daniel Greene  4   6   10 Emily Staples  9 Zinan Zhang  8   9   11 James H R Farmery  10   12 Ilenia Simeoni  4   6 Elizabeth Rivers  13   14 Jesmeen Maimaris  13   14 Christopher J Penkett  4   6 Jonathan Stephens  4   5   6 Sri V V Deevi  4   6 Alba Sanchis-Juan  4   5   6 Nicholas S Gleadall  4   5 Moira J Thomas  15   16 Ravishankar B Sargur  17   18 Pavels Gordins  19 Helen E Baxendale  8   9   20 Matthew Brown  4   6 Paul Tuijnenburg  21   22 Austen Worth  13   14 Steven Hanson  23   24 Rachel J Linger  6   25 Matthew S Buckland  23   24 Paula J Rayner-Matthews  4   6 Kimberly C Gilmour  13   14 Crina Samarghitean  4   6 Suranjith L Seneviratne  23   24 David M Sansom  23   24 Andy G Lynch  12   26   27 Karyn Megy  4   6 Eva Ellinghaus  28 David Ellinghaus  29   30 Silje F Jorgensen  31   32 Tom H Karlsen  28 Kathleen E Stirrups  4   6 Antony J Cutler  33 Dinakantha S Kumararatne  9   34 Anita Chandra  8   9   34 J David M Edgar  35   36 Archana Herwadkar  37 Nichola Cooper  38 Sofia Grigoriadou  39 Aarnoud P Huissoon  40   41 Sarah Goddard  42 Stephen Jolles  43 Catharina Schuetz  44 Felix Boschann  45 Primary Immunodeficiency Consortium for the NIHR BioresourcePaul A Lyons  8   9 Matthew E Hurles  46 Sinisa Savic  47   48   49 Siobhan O Burns  23   24 Taco W Kuijpers  21   22   50 Ernest Turro  4   5   6   10 Willem H Ouwehand  4   5   6   51 Adrian J Thrasher  13   14 Kenneth G C Smith  52   53
Collaborators, Affiliations

Whole-genome sequencing of a sporadic primary immunodeficiency cohort

James E D Thaventhiran et al. Nature. 2020 Jul.

Erratum in

  • Publisher Correction: Whole-genome sequencing of a sporadic primary immunodeficiency cohort.
    Thaventhiran JED, Lango Allen H, Burren OS, Rae W, Greene D, Staples E, Zhang Z, Farmery JHR, Simeoni I, Rivers E, Maimaris J, Penkett CJ, Stephens J, Deevi SVV, Sanchis-Juan A, Gleadall NS, Thomas MJ, Sargur RB, Gordins P, Baxendale HE, Brown M, Tuijnenburg P, Worth A, Hanson S, Linger RJ, Buckland MS, Rayner-Matthews PJ, Gilmour KC, Samarghitean C, Seneviratne SL, Sansom DM, Lynch AG, Megy K, Ellinghaus E, Ellinghaus D, Jorgensen SF, Karlsen TH, Stirrups KE, Cutler AJ, Kumararatne DS, Chandra A, Edgar JDM, Herwadkar A, Cooper N, Grigoriadou S, Huissoon AP, Goddard S, Jolles S, Schuetz C, Boschann F; Primary Immunodeficiency Consortium for the NIHR Bioresource; Lyons PA, Hurles ME, Savic S, Burns SO, Kuijpers TW, Turro E, Ouwehand WH, Thrasher AJ, Smith KGC. Thaventhiran JED, et al. Nature. 2020 Aug;584(7819):E2. doi: 10.1038/s41586-020-2556-6. Nature. 2020. PMID: 32678341

Abstract

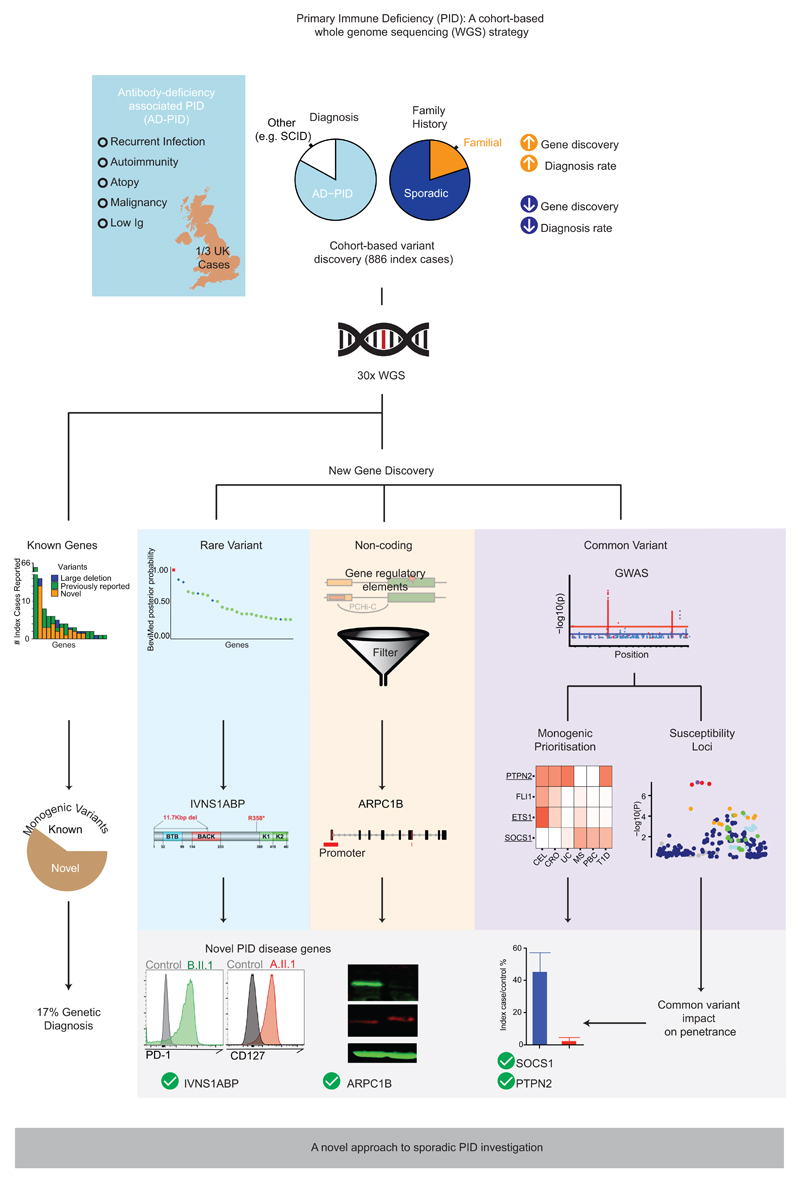
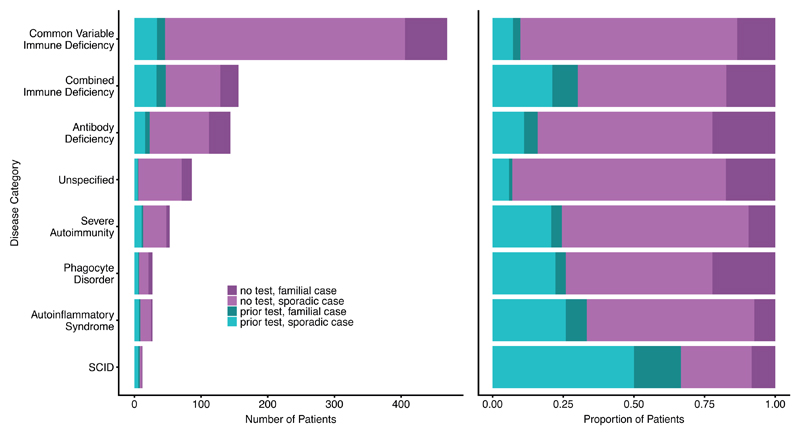
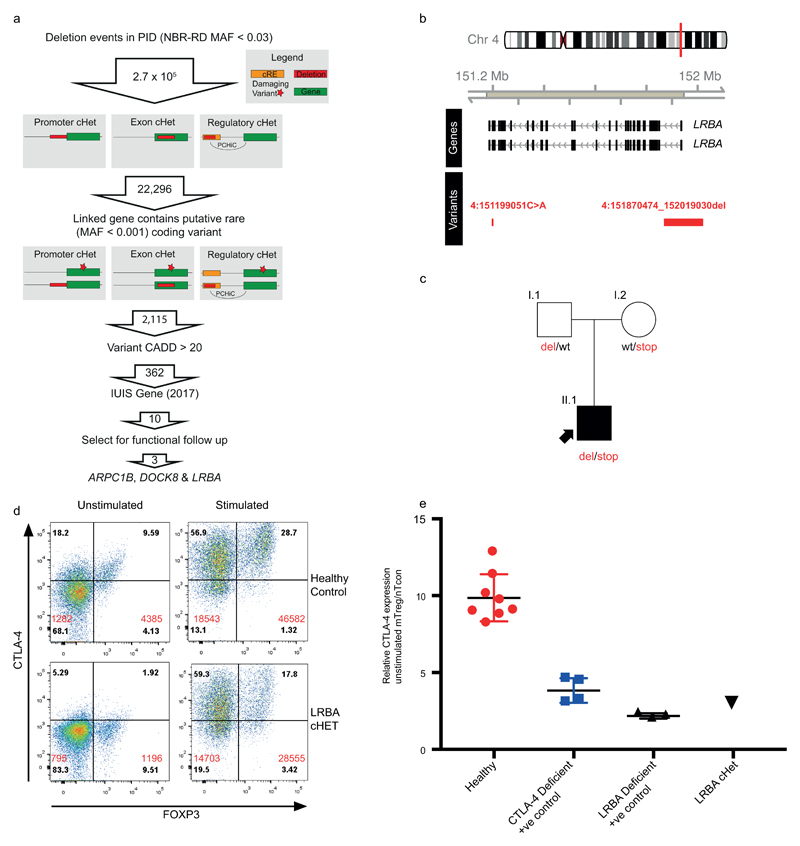
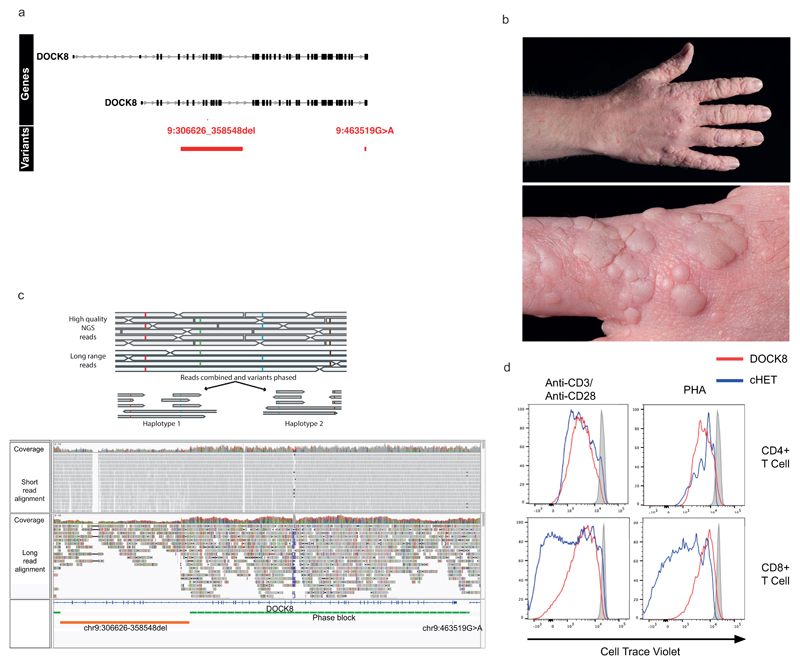
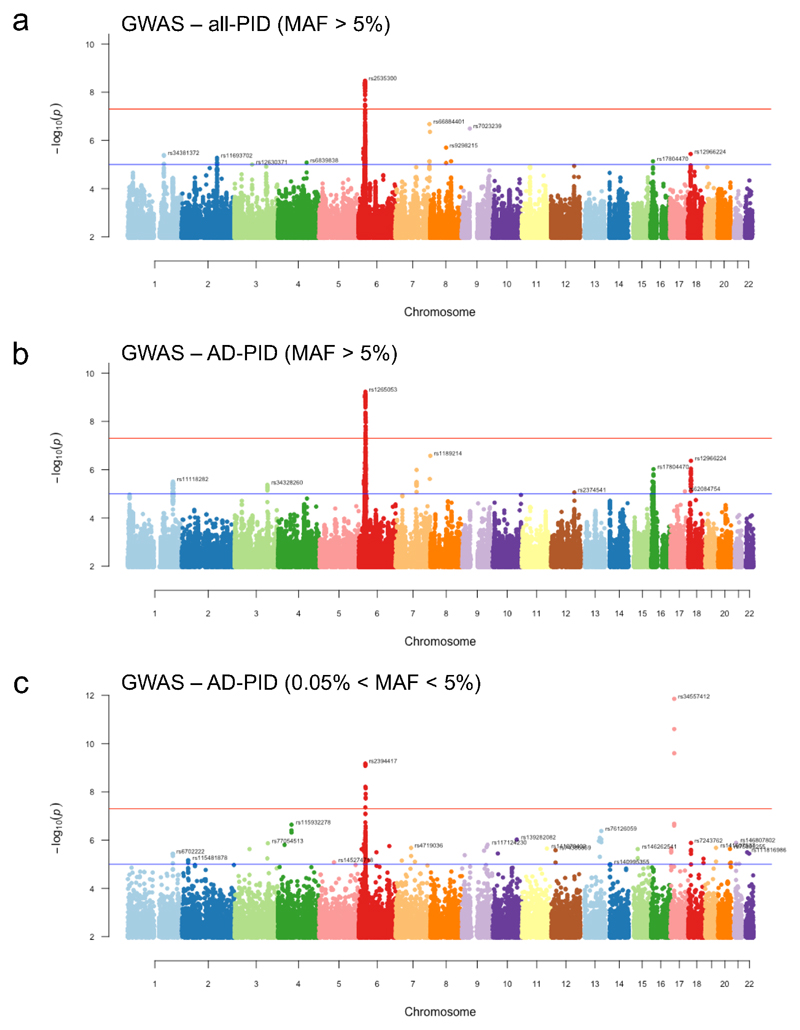
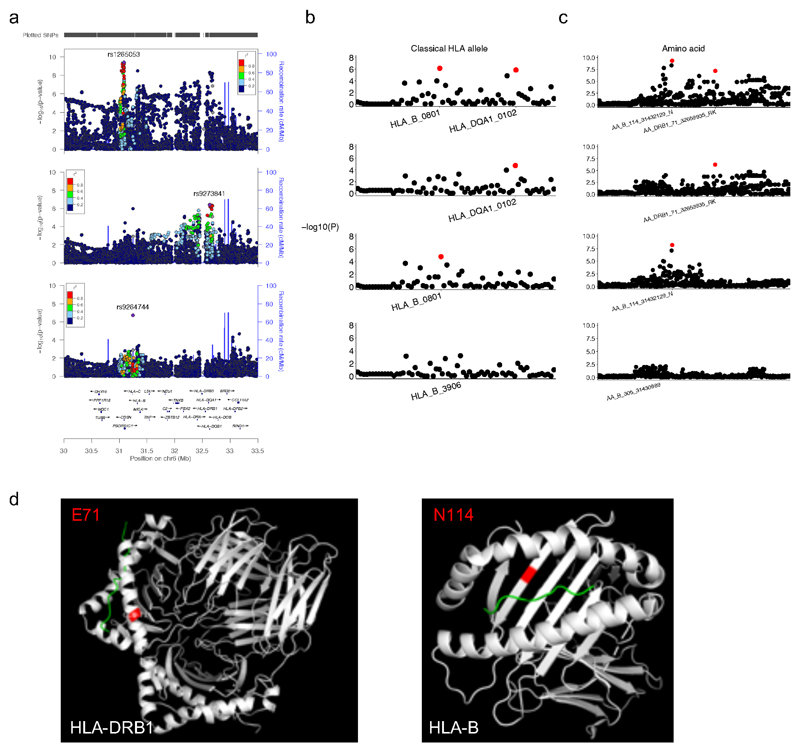
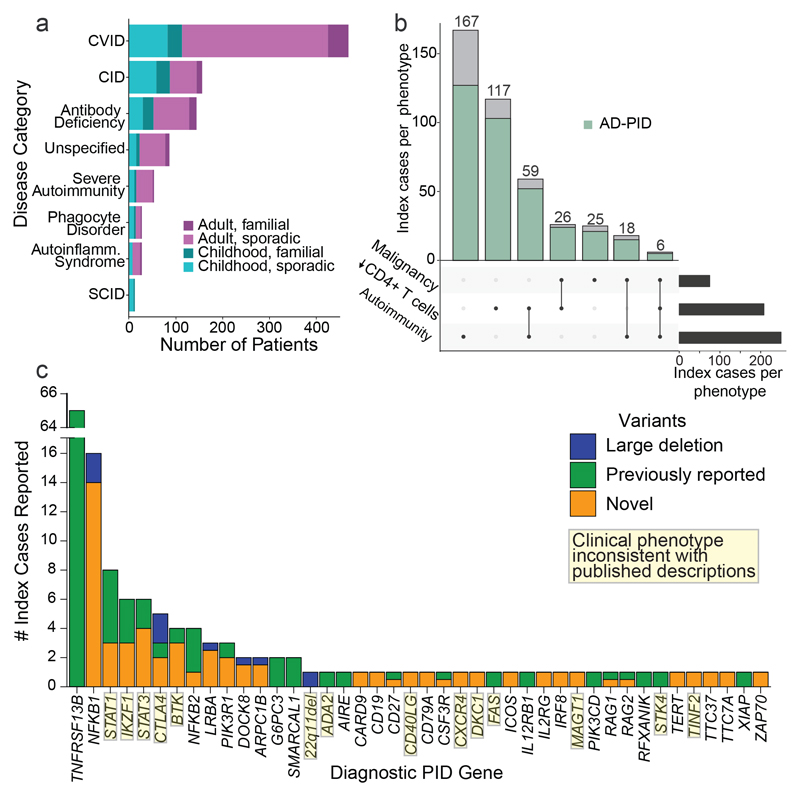
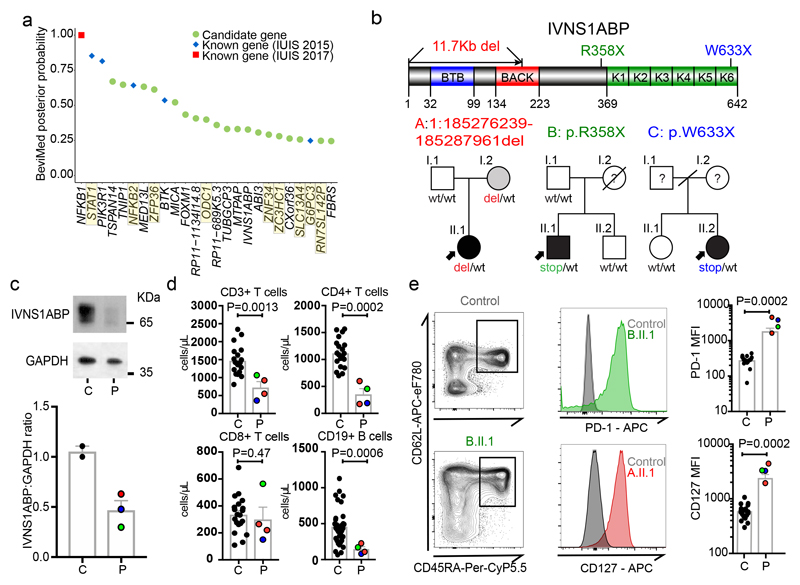
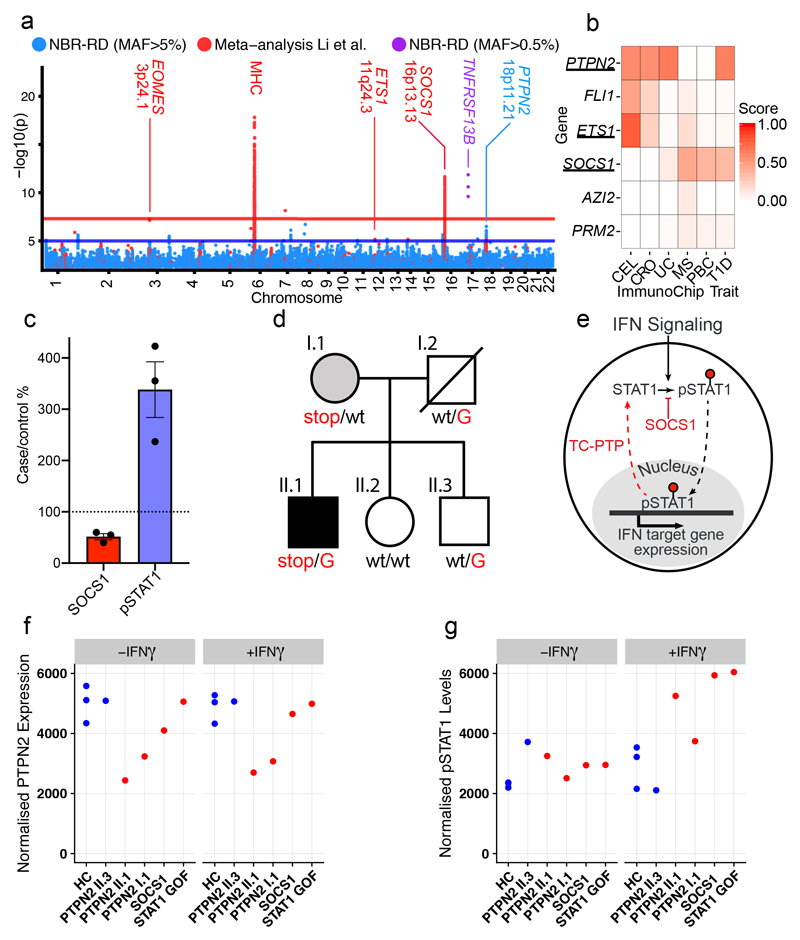
Primary immunodeficiency (PID) is characterized by recurrent and often life-threatening infections, autoimmunity and cancer, and it poses major diagnostic and therapeutic challenges. Although the most severe forms of PID are identified in early childhood, most patients present in adulthood, typically with no apparent family history and a variable clinical phenotype of widespread immune dysregulation: about 25% of patients have autoimmune disease, allergy is prevalent and up to 10% develop lymphoid malignancies1-3. Consequently, in sporadic (or non-familial) PID genetic diagnosis is difficult and the role of genetics is not well defined. Here we address these challenges by performing whole-genome sequencing in a large PID cohort of 1,318 participants. An analysis of the coding regions of the genome in 886 index cases of PID found that disease-causing mutations in known genes that are implicated in monogenic PID occurred in 10.3% of these patients, and a Bayesian approach (BeviMed4) identified multiple new candidate PID-associated genes, including IVNS1ABP. We also examined the noncoding genome, and found deletions in regulatory regions that contribute to disease causation. In addition, we used a genome-wide association study to identify loci that are associated with PID, and found evidence for the colocalization of-and interplay between-novel high-penetrance monogenic variants and common variants (at the PTPN2 and SOCS1 loci). This begins to explain the contribution of common variants to the variable penetrance and phenotypic complexity that are observed in PID. Thus, using a cohort-based whole-genome-sequencing approach in the diagnosis of PID can increase diagnostic yield and further our understanding of the key pathways that influence immune responsiveness in humans.


Conflict of interest statement

Competing interests

The authors declare no competing financial interests.

Figures

Extended Data Figure 1
Extended Data Figure 1. Graphical abstract
Extended Data Figure 2
Extended Data Figure 2. Genetic testing in the PID cohort prior to WGS recruitment, in sporadic versus familial cases.
Any type of genetic test is included, such as single exon/gene sequencing, MLPA, or targeted gene panel/exome sequencing. The information was supplied on the referral form and is likely an underestimate of the number of patients with additional genetic testing.
Extended Data Figure 3
Extended Data Figure 3. BeviMed simulation study of Positive Predictive Value (PPV) with increasing disease cohort size.
We simulated genotypes at 25 rare variant sites in a hypothetical locus amongst 20,000 controls and a further 1,000, 2,000, 3,000, 4,000 or 5,000 cases. We simulated that 0.2%, 0.3%, 0.4% or 0.5% of the cases had the hypothetical locus as their causal locus. We distinguish between cases due to the hypothetical locus (CHLs) and cases due to other loci (COLs). The allele frequency of 20 variants was set to 1/10,000 amongst the cases and COLs. The allele frequency of the remaining 5 variants was set to zero amongst the controls and COLs. One of the five variants was assigned a heterozygous genotype amongst the CTLs at random. Thus, we represent a dominant disorder caused by variants with full penetrance. As inference is typically performed across thousands of loci, with only a small number being causal, we assumed a mixture of 100 to 1 non-causal to causal loci. In order to compute the PPV for a given threshold on the posterior probability of association (PPA), we computed PPAs for 10,000 datasets without permutation of the case/control labels and 10,000 further datasets with a permutation of the case/control labels. We then sampled 1,000 PPAs from the permuted set and 10 PPAs from the non-permuted set to compute the PPV obtained when the PP threshold was set to achieve 100% power. The mean over 2,000 repetitions of this procedure is shown on the y-axis. The x-axis shows the number of cases in a hypothetical cohort. As the number of cases increases from 1,000 to 5,000, the PPV increases above 87.5% irrespective of the proportion of cases with the same genetic aetiology. This demonstrates the utility of expanding the size of the PID case collection for detecting even very rare aetiologies resulting in the same broad phenotype as cases with different aetiologies. In practice, the PPV/power relationship may be much better, as the wealth of phenotypic information of the cases can allow subcategorization of cases to better approximate shared genetic aetiologies.
Extended Data Figure 4
Extended Data Figure 4. Candidate cHET filtering strategy and LRBA patient.
(a) Filtering strategy to identify candidate compound heterozygous (cHET) pathogenic variants consisting of a rare coding variant in a PID-associated gene and a deletion of a cis-regulatory element for the same gene. (b) Regional plot of the compound heterozygous variants. Gene annotations for are taken from Ensembl Version 75, and the transcripts shown are those with mRNA identifiers in RefSeq (ENST00000357115 and ENST00000510413). The position of each variant relative to the gene transcript is shown by a red bar, with the longer bar indicating the extent of the deleted region. Variant coordinates are shown for the GRCh37 genome build. (c) Pedigree of LRBA patient demonstrating phase of the causal variants. (d) FACS dotplot of CTLA-4 and FoxP3 expression in LRBA cHET patient and a healthy control (representative of 2 independent experiments). Numbers in black are the percentage in each quadrant. Numbers in red are the MFI of CTLA-4 staining in FoxP3 -ve and FoxP3 +ve cells. (e) Normalised CTLA-4 expression, assessed as previously described in Hou et al. (Blood, 2017), in the LRBA cHET patient (n=1), healthy controls (n=8) and positive control CTLA-4 (n=4) and LRBA (n=3 deficient patients. Horizontal bars indicate mean +/- SEM.
Extended Data Figure 5
Extended Data Figure 5. DOCK8 cHET patient.
(a) Regional plot of the compound heterozygous variants. Gene annotations for are taken from Ensembl Version 75, and the transcripts shown are those with mRNA identifiers in RefSeq (ENST00000432829 and ENST00000469391). The position of each variant relative to the gene transcript is shown by a red bar, with the longer bar indicating the extent of the deleted region. Variant coordinates are shown for the GRCh37 genome build. (b) Photographs of the extensive HPV associated wart infection in the DOCK8 cHET patient. (c) cHET variant phasing. Top: cartoon representation of phasing using high quality heterozygous calls from short read WGS data and long-read nanopore sequencing data. Bottom panel: WGS and nanopore data from the DOCK8 patient. The two variants (large deletion and missense substitution) are shown in the bottom track (orange), and a single phase block (green) that spans the entire region between the two variants confirmed them to be in-trans. (d) Dye-dilution proliferation assessment in response to phytohaemagglutinin (PHA) and anti-CD3/28 beads in CD4+ and CD8+ T cells in patient and control cells (representative of 2 independent experiments). Staining was performed with CFSE dye (Invitrogen, Carlsbad, CA, USA) with the same additional fluorochrome markers as described in the flow cytometry methods section.
Extended Data Figure 6
Extended Data Figure 6. Manhattan plots of (a) all-PID MAF>5%, (b) AD-PID MAF>5% and (c) AD-PID 0.5%
Sample sizes: all-PID cases n=886; AD-PID cases n=733; controls n=9,225. Each point represents an individual SNP association P-value, adjusted for genomic inflation. Only signals with P<1x10⁻² are shown. None of the SNPs in plot (c) appear in the results of the common variant GWAS in (b), and are therefore additional signals gained from a GWAS including variants of intermediate MAF. Red and blue lines represent genome-wide (P<5x10⁻⁸) and suggestive (P<1x10⁻⁵) associations, respectively. Note the additional genome-wide significant signal representing the TNFRSF13B locus, and several suggestive associations that only become apparent with variants in the 0.5% - 5% MAF range shown in (c). Suggestive loci are indicated by the rsID of the lead SNP in each chromosome. Note that lead SNPs in AD-PID GWAS (b) may differ from meta-analysis lead SNPs.
Extended Data Figure 7
Extended Data Figure 7. MHC locus conditional analyses in AD-PID GWAS (cases n=733, controls n=9,225).
(a) Locuszoom association plots of AD-PID GWAS MHC locus initial (top) and conditional (middle, bottom) analyses results. The x and left y axes represent the chromosomal position and the -log10 of the association P-value, respectively. Each point represents an analysed SNP, with the lead SNP indicated by a purple diamond and all other points coloured according to the strength of their LD with the lead SNP. Purple lines represent HapMap CEU population recombination hotspots. The bottom panel shows a selection of genes in the region, with over 150 genes omitted. Top: association plot of the most significant signal rs1265053, which is in the Class I region and close to HLA-B and HLA-C genes. Middle: plot showing the association remaining upon conditioning on rs1265053, with the strongest signal rs9273841 mapping to the Class II region close to HLA-DRB1 and HLA-DQA1 genes. Bottom: plot showing the association signal remaining upon conditioning on both rs1265053 and rs9273841. (b,c) MHC locus conditional analyses of the classical HLA alleles (b) and amino acids of individual HLA genes (c). Each point represents a single imputed classical allele or amino acid, with those marked in red indicating those added as covariates to the logistic regression model: the Class I signal (second row plots), the Class II signal (third row plots), and both Class I and Class II signals (bottom row plots). The HLA allele and amino acid shown in the bottom plots are those with the lowest P-value remaining after conditioning on both Class I and Class II signals; as there are no genome-wide significant signals remaining, the results suggest there are two independent signals at the MHC locus. (d) Protein modelling of two independent MHC locus signals: HLA-DRB1 residue E71 and HLA-B residue N114 using PDB 1BX2 and PDB 4QRQ respectively. Protein is depicted in white, highlighted residue in red, and peptide is in green.
Figure 1
Figure 1. Description of the immunodeficiency cohort and disease associations in coding regions.
(a) Number of index cases recruited under different phenotypic categories (red – adult cases, blue – paediatric cases, lighter shade – sporadic (no family history of PID), darker shade - family history of PID). CVID – Common variable immunodeficiency, CID – combined immunodeficiency, and SCID – severe combined immunodeficiency. (b) Number of index cases with malignancy, autoimmunity and CD4+ lymphopenia. (black bar – total number of cases, blue bar - number of cases with AD-PID phenotype). (c) Number of patients with reported genetic findings subdivided by gene. Previously reported variants are those identified as immune disease-causing in the HGMD-Pro database.
Figure 2
Figure 2. Discovery of novel PID genes in a large cohort WGS analysis.
(a) BeviMed assessment of enrichment for candidate disease-causing variants in individual genes, in the PID cohort relative to the rest of the NBR-RD cohort (cases n=886, controls n= 9,284). The top 25 candidate genes are shown. Genes highlighted in yellow are those flagged as potentially confounded by population stratification (see Supplementary Note 2). Prioritized genes known to cause PID according to the International Union of Immunological Societies (IUIS) in 2015 (blue) and 2017 (red). (b) Pedigrees of 3 unrelated kindreds with damaging IVNS1ABP variants and linear protein position of variants. (c) Western blot of IVNS1ABP and GAPDH in whole cell lysates of PBMCs. (Top) Representative blot from A.II.1 (P) and Control (C). For gel source data, see Supplementary Figure 1. (Bottom) Graph of relative IVNS1ABP normalized to GAPDH. (representative of 4 independent experiments). (d) Immunophenotyping of CD3+ T cells, CD4+, CD8+ T cells, and CD19+ B cells in C = healthy controls (n=20) and P = IVNS1ABP patients (n=4). (e) Assessment of CD127 and PD-1 expression in naïve T cells. (Left) Representative gating of naïve (CD45RA+ CD62L+) CD4+ T cells in a control and B.II.1.(Middle) FACS histograms of PD-1 and CD127 from controls and IVNS1ABP patients (B.II.1 and A.II.1). (Right) PD-1 and CD127 mean fluorescence intensity (MFI) values from controls (C, n=20) and patients (P, n=4). All tests two-sided Mann Whitney U. Lines present means, bars = S.E.M.
Figure 3
Figure 3. Assessment of WGS data for regulatory region deletions that impact upon PID.
(a) Genomic configuration of the ARPC1B gene locus highlighting the compound heterozygous gene variants. ExAC shows that the non-coding deletion is outside of the exome-targeted regions. (b) Pedigree of patient in (a) and co-segregation of ARPC1B genotype (wt – wild-type, del – deletion, fs – frameshift). (c) Western blot of ARPC1A and ARPC1B in neutrophil and platelet lysates from the patient (P) and control (C, n=1). For gel source data, see Supplementary Figure 1. (d) Podosomes were identified by staining adherent, fixed monocyte-derived macrophages for vinculin, phalloidin and the nuclear stain DAPI. Quantification was performed by counting podosomes on at least 100 cells per sample from 10 fields of view at 60x magnification.
Figure 4
Figure 4. Antibody deficiency (AD-PID) GWAS identifies common variants that mediate disease risk and suggests novel monogenic candidate genes.
(a) A composite Manhattan plot for the AD-PID GWAS. Blue – common variants (MAF>0.05) analysed in this study (NBR-RD) only (cases n=773, controls n=9,225), red – variants from fixed effects meta-analysis with data from Li et al. (cases n=1,511, controls n=20,224); and purple – genome-wide significant low frequency (0.005<MAF<0.05) variants in TNFRSF13B locus. Loci of interest are labelled with putative causal protein coding gene names. (b) COGS prioritisation scores of candidate monogenic causes of PID using previous autoimmune targeted genotyping studies (Supplementary Table 4) across suggestive AD-PID loci (n=4). For clarity, only diseases prioritising one or more genes are shown. CEL – coeliac disease, CRO- Crohn’s disease, UC – ulcerative colitis, MS – multiple sclerosis, PBC – primary biliary cirrhosis and T1D – type 1 diabetes (c) Graph of relative pSTAT1 and SOCS1 in lysates made from 2 hour IFN-γ treated T cell blasts from SOCS1 mutation patients and controls. (Lines present mean, error bars=S.E.M.) (d) The pedigree of the PTPN2 mutation patient. Carriers of the rs2847297-G risk allele are indicated. (e) Simplified model of how SOCS1 and TC-PTP limit the phosphorylated-STAT1 triggered by interferon signalling. (f) Graph of relative PTPN2 and pSTAT1 from the indicated patients and controls, in lysates made from T cell blasts incubated ± IFN-γ for 2 hours. (PTPN2 normalized to tubulin level, pSTAT1 normalised to STAT1 levels, representative of 2 independent experiments)

References

    1. Gathmann B, et al. Clinical picture and treatment of 2212 patients with common variable immunodeficiency. J Allergy Clin Immunol. 2014;134:116–126.e11. - PubMed
    1. Lenardo M, Lo B, Lucas CL. Genomics of Immune Diseases and New Therapies. Annu Rev Immunol. 2016;34:121–149. - PMC - PubMed
    1. Bousfiha A, et al. The 2017 IUIS Phenotypic Classification for Primary Immunodeficiencies. J Clin Immunol. 2018;38:129–143. - PMC - PubMed
    1. Greene D, Richardson S, Turro E. A Fast Association Test for Identifying Pathogenic Variants Involved in Rare Diseases. Am J Hum Genet. 2017;101:104–114. - PMC - PubMed
    1. Casanova J-L. Human genetic basis of interindividual variability in the course of infection. Proc Natl Acad Sci U S A. 2015;112:E7118–27. - PMC - PubMed

Publication types

MeSH terms

Substances

Grants and funding