Meta-Analysis
. 2020 Jun;582(7811):240-245.
doi: 10.1038/s41586-020-2263-3. Epub 2020 May 6.

Identification of type 2 diabetes loci in 433,540 East Asian individuals

Cassandra N Spracklen #  1   2 Momoko Horikoshi #  3 Young Jin Kim #  4 Kuang Lin #  5 Fiona Bragg  5 Sanghoon Moon  4 Ken Suzuki  3   6   7   8 Claudia H T Tam  9   10 Yasuharu Tabara  11 Soo-Heon Kwak  12 Fumihiko Takeuchi  13 Jirong Long  14 Victor J Y Lim  15 Jin-Fang Chai  15 Chien-Hsiun Chen  16 Masahiro Nakatochi  17 Jie Yao  18   19 Hyeok Sun Choi  20 Apoorva K Iyengar  1 Hannah J Perrin  1 Sarah M Brotman  1 Martijn van de Bunt  21   22 Anna L Gloyn  21   22   23   24 Jennifer E Below  25   26 Michael Boehnke  27 Donald W Bowden  28   29 John C Chambers  30   31   32   33   34 Anubha Mahajan  21   22   35 Mark I McCarthy  21   22   23   35 Maggie C Y Ng  25   28 Lauren E Petty  25   26 Weihua Zhang  31   32 Andrew P Morris  22   36   37 Linda S Adair  38 Masato Akiyama  6   39   40 Zheng Bian  41 Juliana C N Chan  9   10   42   43 Li-Ching Chang  16 Miao-Li Chee  44 Yii-Der Ida Chen  18   19 Yuan-Tsong Chen  16 Zhengming Chen  5 Lee-Ming Chuang  45   46 Shufa Du  38 Penny Gordon-Larsen  38 Myron Gross  47 Xiuqing Guo  18   19 Yu Guo  41 Sohee Han  4 Annie-Green Howard  48 Wei Huang  49 Yi-Jen Hung  50   51 Mi Yeong Hwang  4 Chii-Min Hwu  52   53 Sahoko Ichihara  54 Masato Isono  13 Hye-Mi Jang  4 Guozhi Jiang  9   10 Jost B Jonas  55 Yoichiro Kamatani  6   56 Tomohiro Katsuya  57   58 Takahisa Kawaguchi  11 Chiea-Chuen Khor  44   59   60 Katsuhiko Kohara  61 Myung-Shik Lee  62   63 Nanette R Lee  64 Liming Li  65 Jianjun Liu  59   66 Andrea O Luk  9   10 Jun Lv  65 Yukinori Okada  8   67 Mark A Pereira  68 Charumathi Sabanayagam  44   69   70 Jinxiu Shi  47 Dong Mun Shin  4 Wing Yee So  9   42 Atsushi Takahashi  6   71 Brian Tomlinson  9   72 Fuu-Jen Tsai  73 Rob M van Dam  15   66 Yong-Bing Xiang  74   75 Ken Yamamoto  76 Toshimasa Yamauchi  7 Kyungheon Yoon  4 Canqing Yu  65 Jian-Min Yuan  77   78 Liang Zhang  44 Wei Zheng  14 Michiya Igase  79 Yoon Shin Cho  20 Jerome I Rotter  18   19 Ya-Xing Wang  80 Wayne H H Sheu  51   53   81 Mitsuhiro Yokota  82 Jer-Yuarn Wu  16 Ching-Yu Cheng  44   69   70 Tien-Yin Wong  44   69   70 Xiao-Ou Shu  14 Norihiro Kato  13 Kyong-Soo Park  12   83   84 E-Shyong Tai  15   66   85 Fumihiko Matsuda  11 Woon-Puay Koh  15   86 Ronald C W Ma  9   10   42   43 Shiro Maeda  3   60   87 Iona Y Millwood  5   88 Juyoung Lee  4 Takashi Kadowaki  89 Robin G Walters  90   91 Bong-Jo Kim  92 Karen L Mohlke  93 Xueling Sim  94
Affiliations
Meta-Analysis

Identification of type 2 diabetes loci in 433,540 East Asian individuals

Cassandra N Spracklen et al. Nature. 2020 Jun.

Abstract

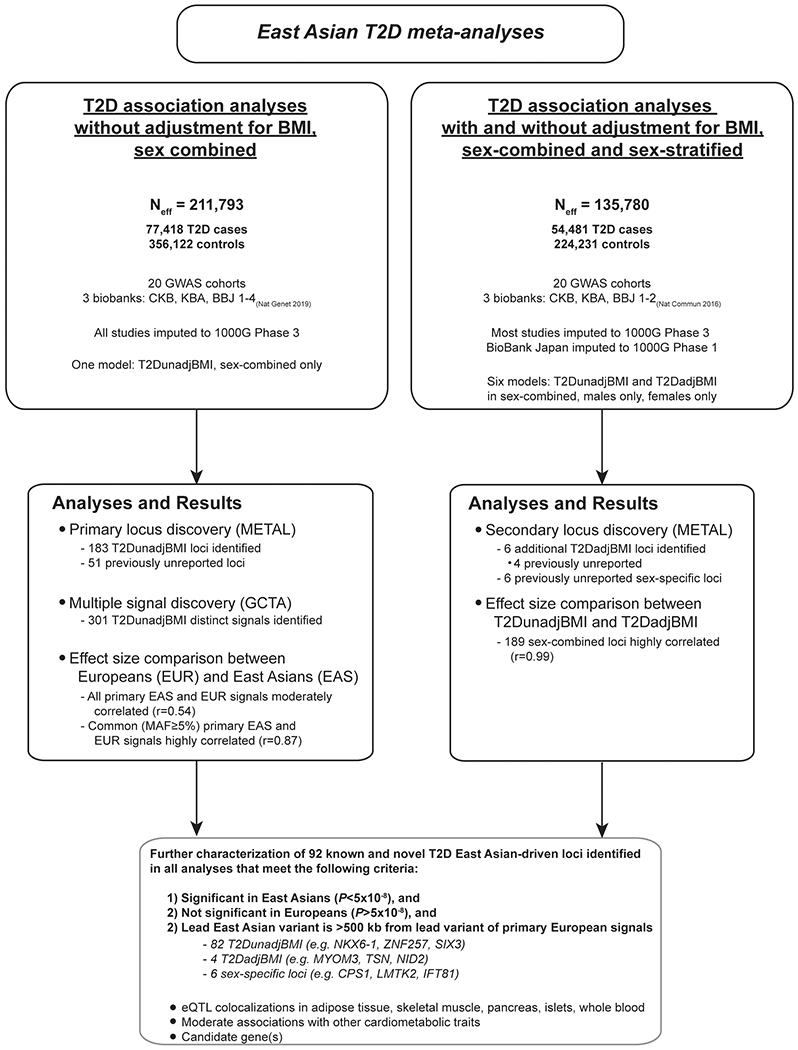
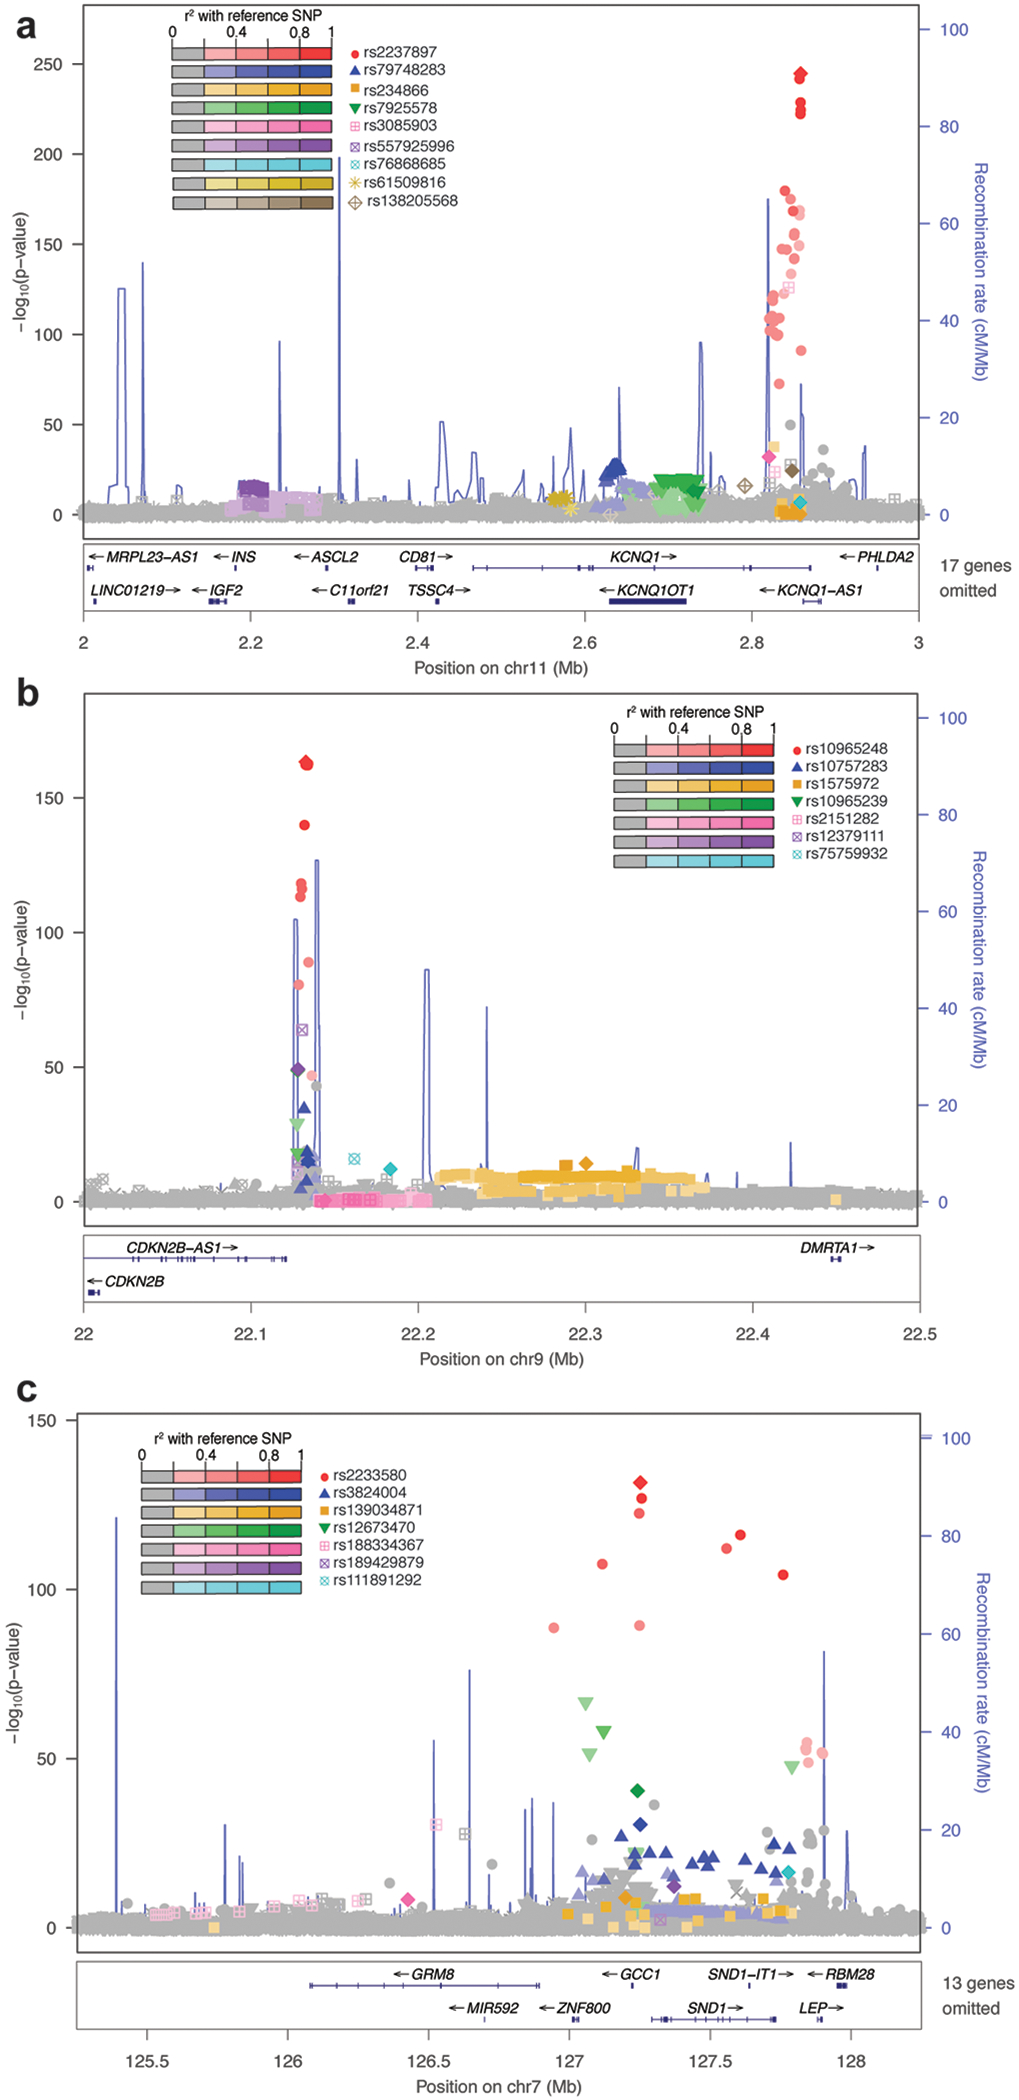
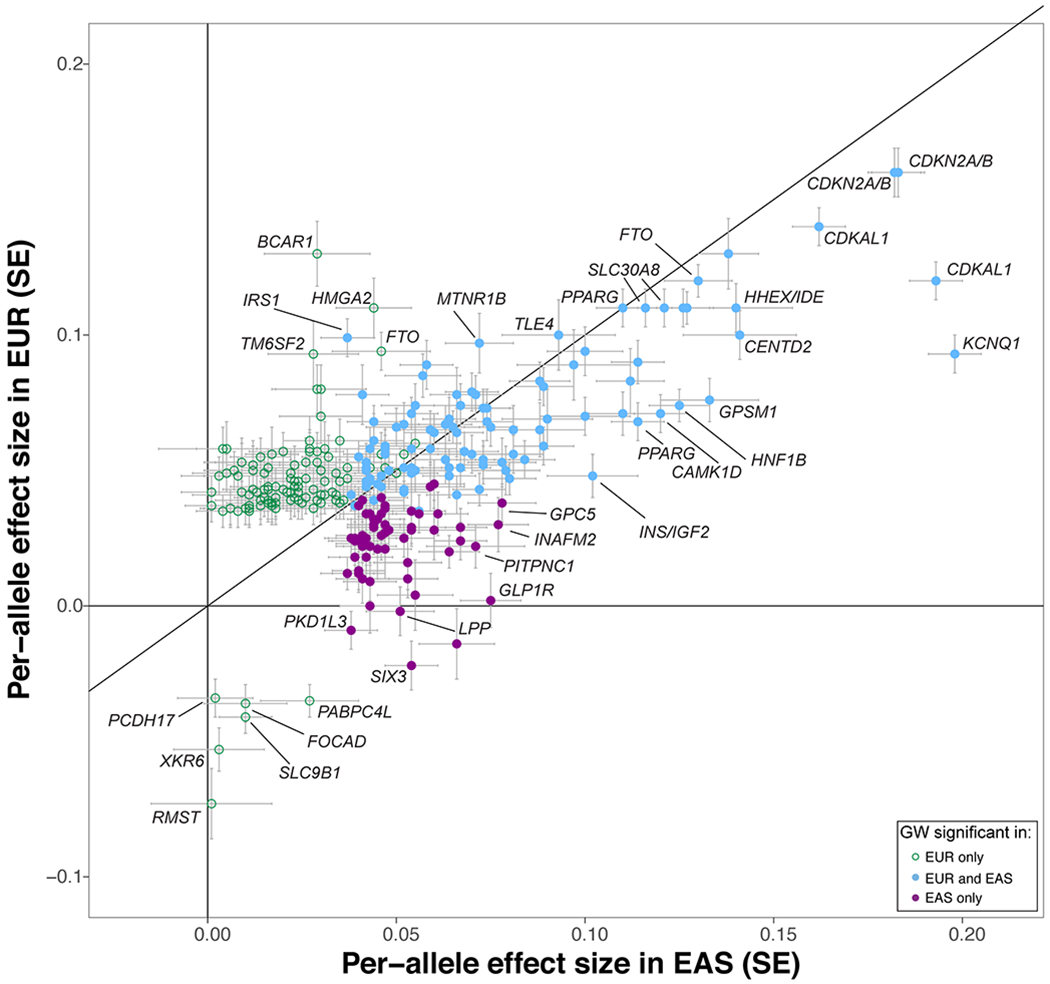
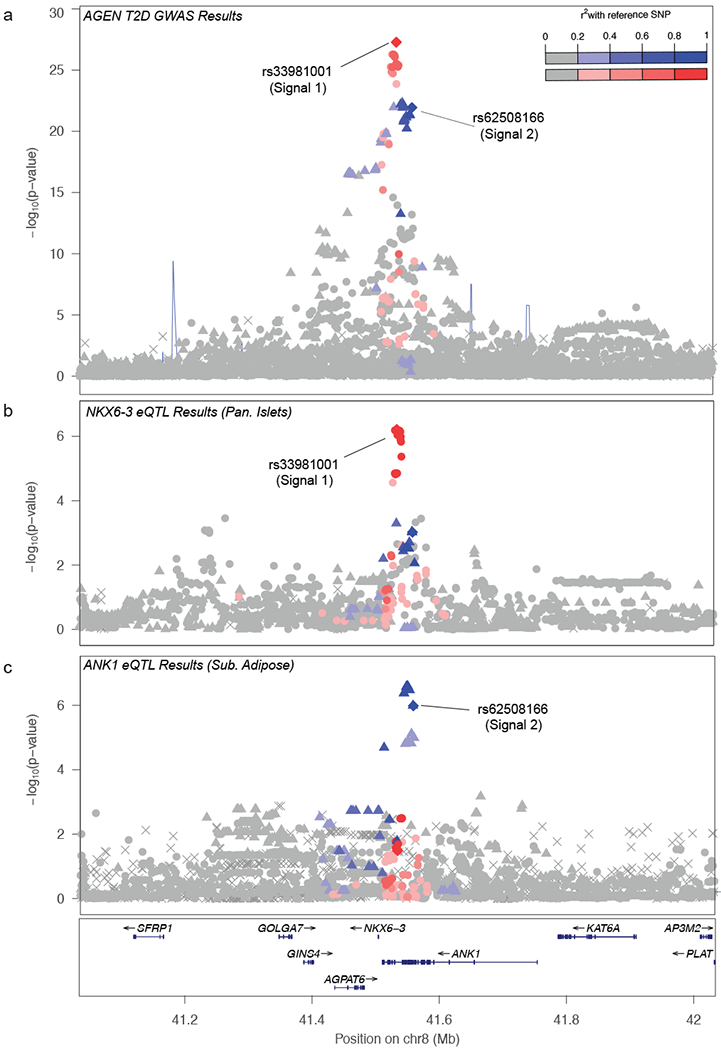
Meta-analyses of genome-wide association studies (GWAS) have identified more than 240 loci that are associated with type 2 diabetes (T2D)1,2; however, most of these loci have been identified in analyses of individuals with European ancestry. Here, to examine T2D risk in East Asian individuals, we carried out a meta-analysis of GWAS data from 77,418 individuals with T2D and 356,122 healthy control individuals. In the main analysis, we identified 301 distinct association signals at 183 loci, and across T2D association models with and without consideration of body mass index and sex, we identified 61 loci that are newly implicated in predisposition to T2D. Common variants associated with T2D in both East Asian and European populations exhibited strongly correlated effect sizes. Previously undescribed associations include signals in or near GDAP1, PTF1A, SIX3, ALDH2, a microRNA cluster, and genes that affect the differentiation of muscle and adipose cells3. At another locus, expression quantitative trait loci at two overlapping T2D signals affect two genes-NKX6-3 and ANK1-in different tissues4-6. Association studies in diverse populations identify additional loci and elucidate disease-associated genes, biology, and pathways.


Conflict of interest statement

COMPETING INTERESTS

The authors declare no competing interest.

Figures

Extended Data Figure 1:
Flow chart of study design, depicting the different data analyses performed.
Extended Data Figure 2:
Extended Data Figure 2:. Manhattan plot for East Asian T2D meta-analysis association results in model unadjusted for BMI.
−log10(P) values from two-sided fixed-effects inverse-variance genome-wide meta-analysis association results for each variant (y-axis; maximal Neff=211,793) was plotted against the genomic position (hg19; x-axis). Known T2D loci achieving genome-wide significance (P<5.0x10⁻⁸) meta-analysis are shown in blue. Loci achieving genome-wide significance that are previously unreported for T2D association are shown in red.
Extended Data Figure 3:
Extended Data Figure 3:. The relationship between effect size and minor allele frequency.
Odds ratios (y-axis) and minor allele frequencies (x-axis) for 189 primary association signals from the T2D BMI-unadjusted models. Odds ratios are from two-sided fixed-effects inverse-variance meta-analysis on a maximal effective sample size of 211,793.
Extended Data Figure 4:
Extended Data Figure 4:. Regional association plots at three T2D-associated loci with the strongest association P-value and more than five distinct association signals in East Asians.
(A) INS/IGF2/KCNQ1, (B) CDKN2A/B, (C) PAX4/LEP. −log10(P) values were from the two-sided fixed-effect inverse-variance meta-analysis. Distinct signals (P<1.0x10⁻⁶ from GCTA conditional analyses) were plotted; Neff for each distinct signal are reported in Supplementary Table 4. Variants are colored based on East Asian 1000G Phase 3 LD with the lead variants for each association signal, shown as diamonds.
Extended Data Figure 5:
Extended Data Figure 5:. Effect size comparison of lead variants in sex-combined models unadjusted and adjusted for BMI.
At 189 lead variants identified in the East Asian BMI-unadjusted sex-combined T2D meta-analysis, per-allele effect sizes (β) from the BMI-adjusted sex-combined model were plotted against the BMI-unadjusted sex-combined model. Both sex-combined models were from two-sided fixed-effect inverse-variance meta-analyses and included the same set of studies for comparable sample size. Each point denotes the per-allele effect size; standard errors of the effect size estimates extend out as grey lines. Effect sizes between the two models are highly correlated with a Pearson correlation coefficient r=0.99 (Supplementary Table 4).
Extended Data Figure 6:
Extended Data Figure 6:. Regional plots of male-specific T2D-associated locus, ALDH2.
For each plot, −log10(P) values from association results from two-sided fixed-effect inverse-variance meta-analyses for each variant (y-axis) was plotted against the genomic position (hg19; x-axis). The lead variant rs12231737 plotted is the lead variant from the BMI-unadjusted male-specific meta-analysis (Neff=65,202) and also the sex-combined meta-analysis (Neff=138,947) from the same subset of individuals included in the sex-stratified analyses (female-specific Neff=70,051). This lead variant rs12231737 is in high LD with rs77768175, identified from the larger BMI-unadjusted sex-combined meta-analysis (East Asian r2=0.80). (A) Males only, (B) sex-combined, and (C) females only. Variants are shaded based on East Asian 1000G Phase 3 LD with the lead variant, shown as a purple diamond.
Extended Data Figure 7:
Extended Data Figure 7:. Effect size comparison of common lead variants (MAF≥5%) identified in this East Asian meta-analysis and a previously published European T2D GWAS meta-analysis.
For 278 unique lead variants with MAF≥5% in both the East Asian and European BMI-unadjusted meta-analyses, per-allele effect sizes (β) from Mahajan et al. (y-axis) were plotted against per-allele effect sizes from this East Asian meta-analysis (x-axis). Effect sizes from both meta-analyses were from two-sided fixed-effect inverse-variance meta-analyses (maximal Neff=211,793 for East Asian and 231,436 for European meta-analyses). Each point denotes the per-allele effect size; standard errors of the effect size estimates extend out as grey lines. Variants are colored purple if they were significant in the East Asian meta-analysis only, green if they were significant in European meta-analysis only, and blue if they were significant in both the East Asian and European meta-analyses. (see Methods and Supplementary Table 7).
Extended Data Figure 8:
Extended Data Figure 8:. Effect size comparison of lead variants identified in East Asian BMI-unadjusted meta-analysis and previously published European T2D GWAS meta-analysis.
For 332 lead variants identified from the two BMI-unadjusted meta-analyses, per-allele effect sizes (β) from a European meta-analysis (y-axis) were plotted against per-allele effect sizes from this East Asian meta-analysis (x-axis). Effect sizes from both meta-analyses were from two-sided fixed-effect inverse-variance meta-analysis (maximal Neff=211,793 for East Asian and 231,436 for European meta-analyses). Each point denotes the per-allele effect size; standard errors of the effect size estimates extend out as grey lines. (A) 152 lead variants significant in the East Asian meta-analysis (purple) or both the East Asian and European meta-analysis (blue) and (B) 192 lead variants significant in the European meta-analysis (green) or both the East Asian and European meta-analysis (blue). These plots include only one variant per locus, in contrast to Figure 2 and Extended Data Figure 7.
Extended Data Figure 9:
Extended Data Figure 9:. Forest plots of BMI-unadjusted meta-analysis association results at SIX3-SIX2 locus.
Odds ratios (black boxes) and 95% confidence intervals (horizontal lines extending out) for T2D associations at the lead East Asian variant (rs12712928) are presented (A) across ancestries of African-American (AFR), East Asian (EAS), European (EUR), Hispanic (HIS), and South Asian (SAS) individuals, (B) within four major East Asian populations (Chinese, Japanese, Korean, and Malay/Filipino combined due to small sample sizes), (C) from each contributing cohort. Effect sizes from East Asian study, ancestry, population, and combined meta-analysis were from two-sided fixed-effect inverse-variance meta-analysis. The size of the box is proportional to the sample size of each contributing study/ancestry/population, which are available in Supplementary Table 8. This East Asian study had >90% power to detect the observed association with a MAF=0.40, OR=1.06, and 77,418 T2D cases. Given the number of T2D cases and frequency of rs12712928-C within the other datasets, at 80% power, we can reasonably exclude association OR >1.07 in EUR and >1.15 in AFR, HIS, and SAS between rs12782928 and T2D. Full study names can be found in Supplementary Table 1 and corresponding sample sizes can be found in Supplementary Table 2.
Figure 1:
Figure 1:. Two distinct T2D-association signals at the ANK1-NKX6-3 locus associated with expression levels of two transcripts in two tissues.
(A) Regional association plot for East Asian sex-combined BMI-unadjusted two-sided fixed-effect inverse-variance meta-analysis at ANK1-NKX6-3 locus. Approximate conditional analysis using GTCA identified three distinct T2D-association signals (P<1x10⁻⁵) at this locus (signal 1, rs33981001, Neff=211,793; signal 2, rs62508166, Neff=211,793; signal 3, rs144239281, Neff=208,431, in order of strength of association). Using 1000G Phase3 East Asian LD, variants are colored in red and blue with the first and second distinct signals respectively (lead variants represented as diamonds). (B) Variant rs12549902, in high LD (EAS LD r2=0.80, EUR r2=0.83) with T2D signal 1, shows the strongest association with expression levels of NXK6-3 in pancreatic islets in 118 individuals. (C) Variant rs516946, in high LD (EAS LD r2=0.96, EUR r2=0.80) with T2D signal 2, shows the strongest association with expression levels of ANK1 in subcutaneous adipose tissue in 770 individuals. As rs62508166 is not available in the subcutaneous adipose tissue data set, a variant in perfect LD (rs28591316) was used and is represented by the blue diamond.
Figure 2:
Figure 2:. Effect size comparison of lead variants identified in this East Asian T2D GWAS BMI-unadjusted meta-analysis and previous European T2D GWAS meta-analysis.
For 332 unique lead variants identified from the two BMI unadjusted meta-analyses, per-allele effect sizes (β) from the European meta-analysis (y-axis) were plotted against per-allele effect sizes from this East Asian meta-analysis (x-axis). Effect sizes from both meta-analyses were from two-sided fixed-effect inverse-variance meta-analysis (maximal Neff=211,793 for East Asian and 231,436 for European meta-analyses). Each point denotes the per-allele effect size; standard errors of the effect size estimates extend out as grey lines. (A) All 332 lead variants; (B) 278 lead variants with minor allele frequency ≥5% in both ancestries. Variants are colored purple if they were significant (P<5x10⁻⁸) in the East Asian analysis only, green if they were significant in European analysis only, and blue if they were significant in both the East Asian and European analyses (see Methods and Supplementary Table 7). The dashed diagonal line represents the trend line across all plotted variants. Compared to Supplementary Table 7, 70 variants are not plotted; 31 variants were present only in the analysis of East Asian individuals (median effect size 0.065; interquartile range 0.049-0.110) and 39 variants were present only in the analysis of European individuals (median effect size 0.083; interquartile range 0.063-0.170).
Figure 3:
Figure 3:. rs117624659 at NKX6-1 locus exhibits allelic differences in transcriptional activity.
(A) rs117624659 (Neff=211,214; purple diamond) shows the strongest association with T2D in the region. P values were from two-sided fixed-effect inverse-variance meta-analysis. Variants are colored based on 1000G Phase 3 East Asian LD with rs117624659. (B) rs117624659 and an additional candidate variant rs142390274 in high pairwise LD (r2>0.80) span a 22 kb region approximately 75 kb upstream of NKX6-1. rs117624659 overlaps a region of open chromatin in pancreatic islets and lies within a region conserved across vertebrates. (C) rs117624659-T, associated with increased risk of T2D, showed greater transcriptional activity in an element cloned in both forward and reverse orientations with respect to NKX6-1 in MIN6 cells compared to rs117624659-C and an “empty vector” containing a minimal promoter. Black lines represent mean (center horizontal line) and standard error (extended lines) relative luciferase activity from two-sided, unpaired t-tests using data from n=5 biologically independent samples/independent experiments.

References

    1. Mahajan A et al. Fine-mapping type 2 diabetes loci to single-variant resolution using high-density imputation and islet-specific epigenome maps. Nat Genet 50, 1505–1513, doi:10.1038/s41588-018-0241-6 (2018). - DOI - PMC - PubMed
    1. Suzuki K et al. Identification of 28 new susceptibility loci for type 2 diabetes in the Japanese population. Nat Genet 51, 379–386, doi:10.1038/s41588-018-0332-4 (2019). - DOI - PubMed
    1. Moon YS et al. Mice lacking paternally expressed Pref-1/Dlk1 display growth retardation and accelerated adiposity. Molecular and cellular biology 22, 5585–5592, doi:10.1128/mcb.22.15.5585-5592.2002 (2002). - DOI - PMC - PubMed
    1. van de Bunt M et al. The miRNA profile of human pancreatic islets and beta-cells and relationship to type 2 diabetes pathogenesis. PLoS One 8, e55272, doi:10.1371/journal.pone.0055272 (2013). - DOI - PMC - PubMed
    1. Scott LJ et al. The genetic regulatory signature of type 2 diabetes in human skeletal muscle. Nat Commun 7, 11764, doi:10.1038/ncomms11764 (2016). - DOI - PMC - PubMed

Publication types

MeSH terms

Grants and funding