
Complement genes contribute sex-biased vulnerability in diverse disorders

Nolan Kamitaki et al. Nature. 2020 Jun.

Abstract

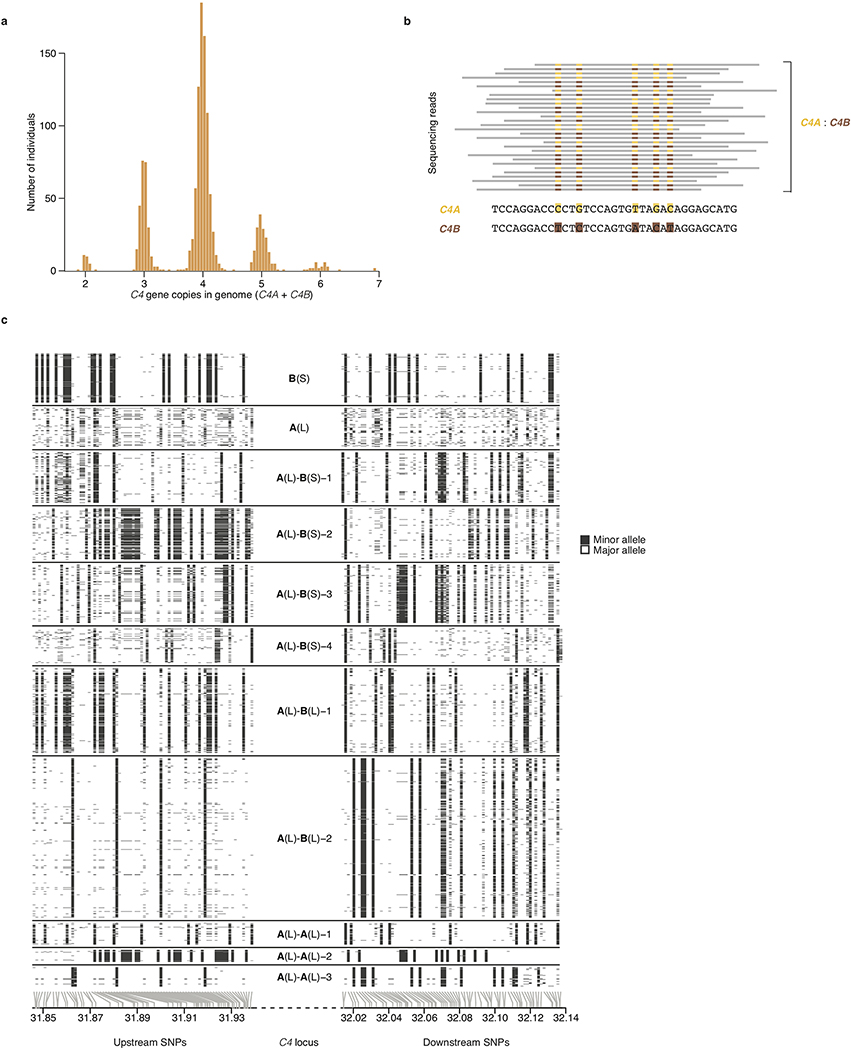
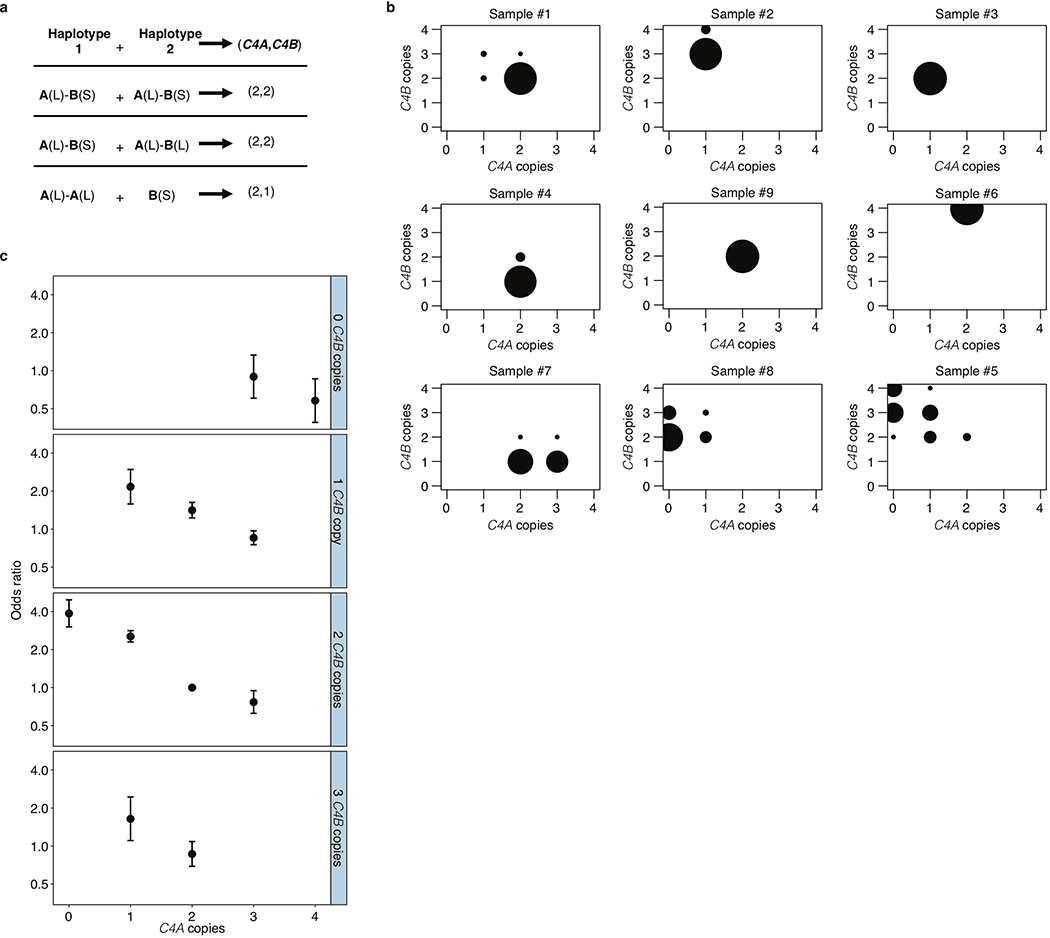
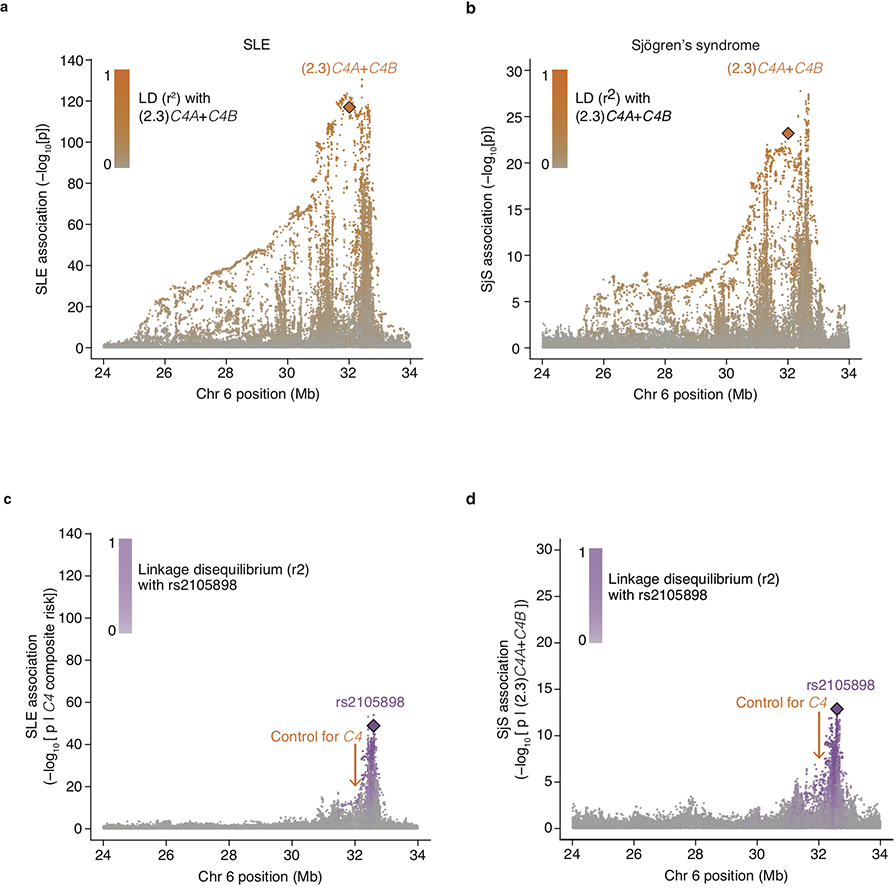
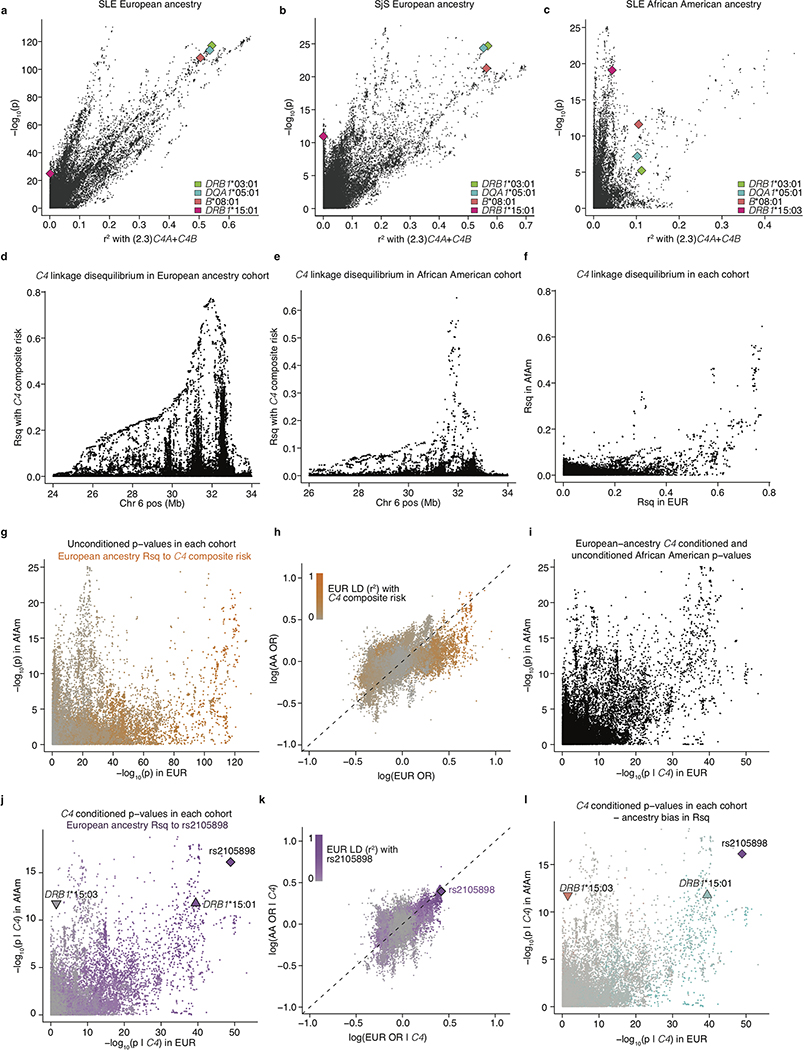
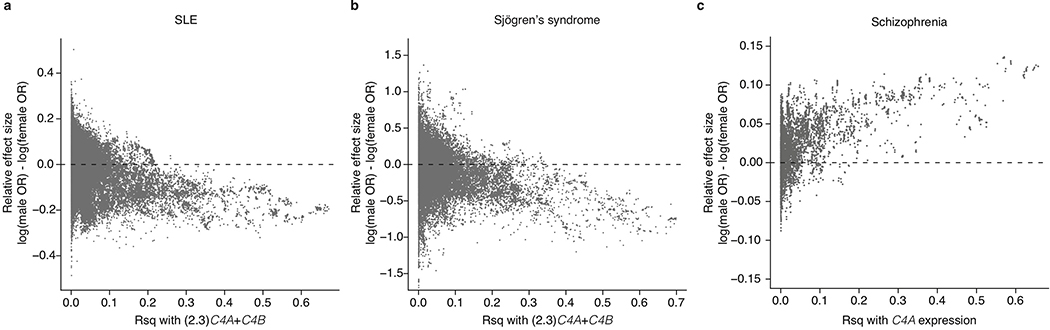
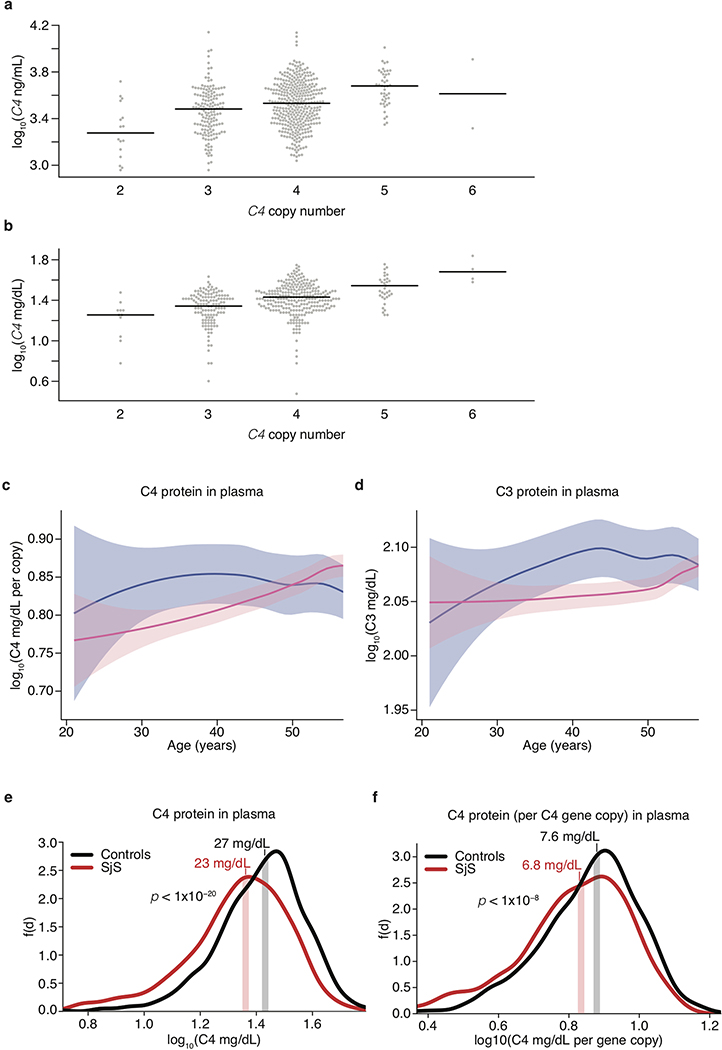
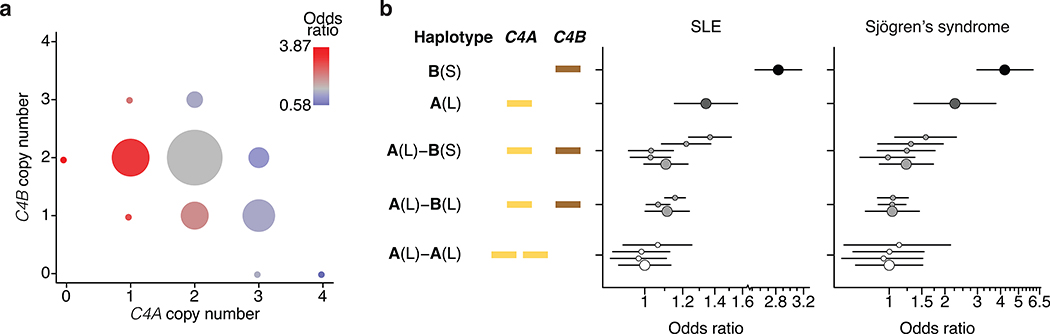
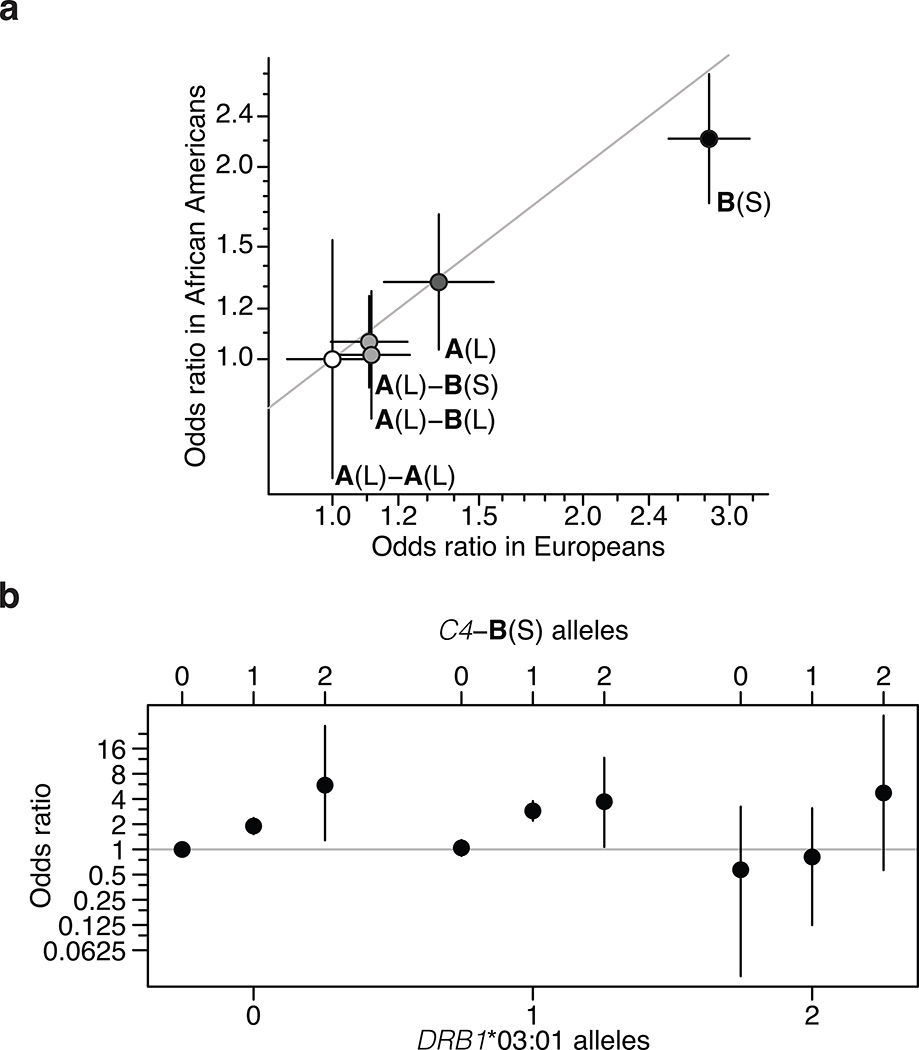
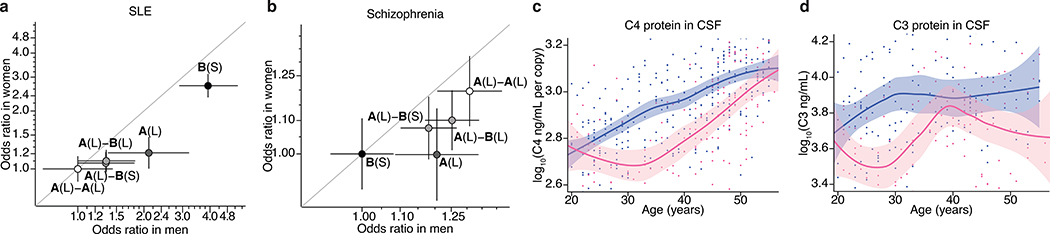
Many common illnesses, for reasons that have not been identified, differentially affect men and women. For instance, the autoimmune diseases systemic lupus erythematosus (SLE) and Sjögren's syndrome affect nine times more women than men1, whereas schizophrenia affects men with greater frequency and severity relative to women2. All three illnesses have their strongest common genetic associations in the major histocompatibility complex (MHC) locus, an association that in SLE and Sjögren's syndrome has long been thought to arise from alleles of the human leukocyte antigen (HLA) genes at that locus3-6. Here we show that variation of the complement component 4 (C4) genes C4A and C4B, which are also at the MHC locus and have been linked to increased risk for schizophrenia7, generates 7-fold variation in risk for SLE and 16-fold variation in risk for Sjögren's syndrome among individuals with common C4 genotypes, with C4A protecting more strongly than C4B in both illnesses. The same alleles that increase risk for schizophrenia greatly reduce risk for SLE and Sjögren's syndrome. In all three illnesses, C4 alleles act more strongly in men than in women: common combinations of C4A and C4B generated 14-fold variation in risk for SLE, 31-fold variation in risk for Sjögren's syndrome, and 1.7-fold variation in schizophrenia risk among men (versus 6-fold, 15-fold and 1.26-fold variation in risk among women, respectively). At a protein level, both C4 and its effector C3 were present at higher levels in cerebrospinal fluid and plasma8,9 in men than in women among adults aged between 20 and 50 years, corresponding to the ages of differential disease vulnerability. Sex differences in complement protein levels may help to explain the more potent effects of C4 alleles in men, women's greater risk of SLE and Sjögren's syndrome and men's greater vulnerability to schizophrenia. These results implicate the complement system as a source of sexual dimorphism in vulnerability to diverse illnesses.


Conflict of interest statement

Competing interests

The authors declare no competing interests.

Figures

Extended Data Figure 1.
Extended Data Figure 1.. A panel of 2,530 reference haplotypes (created from whole-genome sequence data) containing C4 alleles and SNPs across the MHC genomic region enables imputation of C4 alleles into large-scale SNP data.
(a) Distributions (across 1,265 individuals) of total C4 gene copy number (C4A + C4B), as measured from read depth of coverage across the C4 locus, in whole-genome sequencing data. (b) The relative numbers of reads that overlap sequences specific to C4A or C4B (together with the total C4 gene copy number as in a) are used to infer the underlying copy numbers of the C4A and C4B genes. For example, in an individual with four C4 genes, the presence of equal numbers of reads specific to C4A or C4B suggests the presence of two copies each of C4A and C4B. Precise statistical approaches (including inference of probabilistic dosages), and further approaches for phasing C4 allelic states with nearby SNPs to create reference haplotypes, are described in Methods. (c) The SNP haplotypes flanking each C4 allele are shown as rows (SNPs as columns), with white and black representing the major and minor allele of each SNP. Gray lines at the bottom indicate the physical location of each SNP along chromosome 6. The differences among the haplotypes are most pronounced closest to C4 (toward the center of the plot), as historical recombination events in the flanking megabases will have caused the haplotypes to be less consistently distinct at greater genomic distances from C4. The patterns indicate that many combinations of C4A and C4B gene copy numbers have arisen recurrently on more than one SNP haplotype, a relationship that can be used in association analyses (Fig. 1b).
Extended Data Figure 2.
Extended Data Figure 2.. Aggregation of joint C4A and C4B genotype probabilities per individual across imputed C4 structural alleles for estimation of SLE risk for each combination.
(a) An individual’s joint C4A and C4B gene copy number can be calculated by summing the C4A and C4B gene contents for each possible pair of two inherited alleles. Many pairings of possible inherited alleles result in the same joint C4A and C4B gene copy number. (b) Each individual’s C4A and C4B gene copy number was imputed from their SNP data, using the reference haplotypes summarized in Extended Data Fig. 1c. For >95% of individuals (exemplified by samples 1–6 in the figure), this inference can be made with >90% certainty/confidence (the areas of the circles represent the posterior probability distribution over possible C4A/C4B gene copy numbers). For the remaining individuals (exemplified by samples 7–9 in the figure), greater statistical uncertainty persists about C4 genotype. To account for this uncertainty, in downstream association analysis, all C4 genotype assignments are handled as probabilistic gene dosages – analogous to the genotype dosages that are routinely used in large-scale genetic association studies that use imputation. (c) Odds ratios and 95% confidence intervals underlying each of the C4-genotype risk estimates in Fig. 1a presented as a series of panels for each observed copy number of C4B, with increasing copy number of C4A for that C4B dosage (x-axis). Data are from analysis of 6,748 SLE cases and 11,516 controls of European ancestry.
Extended Data Figure 3.
Extended Data Figure 3.. Conditional association analyses for genetic markers across the extended MHC genomic region within the European-ancestry SLE and Sjögren’s syndrome (SjS) cohort.
(a) Association of SLE with genetic markers (SNPs and imputed HLA alleles) across the extended MHC locus within the European-ancestry SLE cohort (6,748 cases and 11,516 controls). Orange diamond: an initial estimate of C4-related genetic risk, calculated as a weighted sum of the number of C4A and C4B gene copies: (2.3)C4A+C4B, with the weights derived from the relative coefficients estimated from logistic regression of SLE risk vs. C4A and C4B gene dosages. This risk score is imputed with an accuracy (r2) of 0.77. Points representing all other genetic variants in the MHC locus are shaded orange according to their level of linkage disequilibrium–based correlation to this C4-derived risk score. (b) As in a, but for a European-ancestry Sjögren’s syndrome (SjS) cohort (673 cases and 1,153 controls). The orange diamond here also represents (2.3)C4A+C4B, with this weighting derived from the relative coefficients estimated from logistic regression of SjS risk vs. C4A and C4B gene dosages (c) Association of SLE with genetic markers (SNPs and imputed HLA alleles) across the extended MHC locus within the European-ancestry SLE cohort controlling for C4 composite risk (weighted sum of risk associated with various combinations of C4A and C4B). Variants are shaded in purple by their LD with rs2105898, an independent association identified from trans-ancestral analyses. (d) As in c, but in association with a European-ancestry SjS cohort. Here a simpler linear model of risk contributed by C4A and C4B was used instead of a weighted sum across all possible combinations.
Extended Data Figure 4.
Extended Data Figure 4.. Using C4 gene variation to understand the appearance of trans-ancestral disparity in MHC association signals, and to fine-map an additional genetic effect
All panels show association signals (for SLE and SjS) for variants in a multi-megabase region of human chromosome 6 containing the MHC region including the HLA and C4 genes. (a) Relationship between SLE association [-log10(p), y-axis] and LD to the weighted C4 risk score (x-axis) for genetic markers and imputed HLA alleles across the extended MHC locus. In this European-ancestry cohort, it is unclear (from this analysis alone) whether the association with the markers in the predominant ray of points (at a ~45° angle from the x-axis) is driven by variation at C4 or by the long haplotype containing DRB1*03:01 (green), DQA1*05:01 (blue), and B*08:01 (red). In addition, at least one independent association signal (a ray of points at a higher angle in the plot, with strong association signals and only weak LD-based correlation to C4 and DRB1*0301) with some LD to DRB1*15:01 (maroon) is also present. (b) Analysis as in a, but for associations to SjS in a cohort of European ancestry. As in SLE, it is initially unclear whether the genetic association signal is driven by variation at C4 or by linked HLA alleles, DRB1*03:01 (green), DQA1*05:01 (blue), and B*08:01 (red). There is also an independent association signal with LD to DRB1*15:01 (maroon). (c) Analysis as in a, but of an African American SLE case–control cohort (in which LD in the MHC region is more limited). Many MHC-region SNPs associate with SLE in proportion to their LD with the weighted C4 risk score inferred from the earlier analysis of the European-ancestry cohort; this C4-derived risk score itself associates with SLE at p = 4.3×10⁻¹⁹ in a logistic regression on 1,494 SLE cases and 5,908 controls. No similarly strong association is observed for DRB1*03:01, DQA1*05:01, or B*08:01, HLA alleles which are in strong LD with C4 risk on European-ancestry (but not African American) haplotypes. An independent association signal is also present in this cohort, more clearly in LD with the DRB1*15:03 allele (maroon). (d) LD in the European-ancestry SLE cohort between the composite C4 risk term (weighted sum of risk associated with various combinations of C4A and C4B from Fig. 2a) and variants in the MHC region as r2 (y-axis). (e) As in d, but for the African American SLE cohort. (f) LD (to C4 composite risk) for the same variants in European-ancestry individuals (x-axis) and African Americans (y-axis). Note the abundance of variants that have greater LD with C4 risk among European-ancestry individuals than among African Americans. Also, several groups of variants have equivalent LD (to C4 risk) in European ancestry individuals but exhibit a range of LD to C4 risk among African Americans. (g) Associations with SLE (-log10 p-values) for the same variants in European ancestry (x-axis) and African American (y-axis) case-control cohorts. Orange shading represents the extent of LD with C4 risk in European ancestry individuals. Variants with strong European-specific association to SLE are generally in strong LD with C4 risk among Europeans-ancestry individuals. (h) Comparison of the inferred effect size from association of genetic markers with SLE (unconditioned log-odds ratios) among European-ancestry (x-axis) and African American (y-axis) research participants. As also seen in g, variants with discordant associations to SLE (across populations) tend also to be in strong LD to C4 risk among European-ancestry individuals. (i) As in g, but now controlling for the effect of C4 variation in analysis of the European-ancestry cohort (x-axis). Note that controlling for C4 risk in European-ancestry individuals alone greatly aligns (relative to g) the patterns of association between European ancestry and African American cohorts. (j) As in i, but now also controlling for the effect of C4 in associations of the African American cohort. Note that due to the lack of strong LD relationships between C4 and variants in the MHC region in African Americans (e), this further adjustment does not change results strongly (relative to i). The independent signal, rs2105898, and HLA alleles, DRB1*15:01 and DRB1*15:03, are also highlighted. LD with rs2105898 in European-ancestry individuals is indicated by purple shading. (k) Comparison of the inferred effect sizes from association of genetic markers with SLE (log-odds ratios) controlling for C4-derived risk among European-ancestry (x-axis) and African American (y-axis) research participants. Two SNPs (rs2105898 and rs9271513) that form a short haplotype common to both ancestry groups are among the strongest associations in both cohorts. (Their association to SLE in the European-ancestry cohort was initially much less remarkable than that of other SNPs that are in strong LD with C4.) LD with rs2105898 in European-ancestry individuals is indicated by purple shading. (l) As in i, but with variants shaded by whether they exhibit greater LD to rs2105898 in Europeans (blue) or African Americans (red).
Extended Data Figure 5.
Extended Data Figure 5.. Relationship of rs2105898 alleles to a known ZNF143 binding motif in the XL9 region of the MHC class II locus
(a) Location of rs2105898 (yellow line at center) within the XL9 region, with relevant tracks showing overlapping histone marks and transcription factor binding peaks (from ENCODE), visualized with the UCSC genome browser. (b) ZNF143 consensus binding motif as a sequence logo, with the letters colored if the base is present in >5% of observed instances. The alleles of rs2105898 are indicated by outlined box surrounding the base.
Extended Data Figure 6.
Extended Data Figure 6.. Relationships between sex bias of disease associations and LD to C4 risk for variants in the MHC region.
(e) Relationship between male bias in SLE risk (difference between male and female log–odds ratios) and LD with C4 risk for common (minor allele frequency [MAF] > 0.1) genetic markers across the extended MHC region. For each SNP, the allele for which sex risk bias is plotted is the allele that is positively correlated (via LD) with C4-derived risk score. (f) Relationship between male bias in SjS risk (log-odds ratios) and LD with C4 risk for common (minor allele frequency [MAF] > 0.1) genetic markers across the extended MHC region. For each SNP, the allele for which sex risk bias is plotted is the allele that is positively correlated (via LD) with C4-derived risk score. (g) Relationship of male bias in schizophrenia risk (log–odds ratios) and LD to C4A expression for common (MAF > 0.1) genetic markers across the extended MHC region. For each SNP, the allele for which sex risk bias is plotted is the allele that is positively correlated (via LD) with imputed C4A expression, as previously described.
Extended Data Figure 7.
Extended Data Figure 7.. Correlation of C4 protein measurements in cerebrospinal fluid and blood plasma with imputed C4 gene copy number and relationship of plasma complement to sex and SjS status
(a) Measurements of C4 protein in CSF obtained by ELISA are presented as log10(ng/mL) (y-axis) for each observed or imputed copy number of total C4 (x-axis, here showing most likely copy number from imputation). Because C4 gene copy number affects C4 protein levels so strongly, we normalized C4 protein measurements to each donor’s C4 gene copy number in subsequent analyses (Fig. 3c). Bars indicate median values for each C4 copy number. (b) Measurements of C4 protein in blood plasma obtained by immunoturbidimetric assays are presented as log10(mg/dL) (y-axis) for each imputed most-likely copy number of C4 genes (x-axis). Because C4 gene copy number affects C4 protein levels so strongly, we normalized C4 protein measurements by C4 gene copy number in subsequent analyses as in c. Due to the number of observations (n = 1,844 total), the plot is downsampled to 500 points; the median bars shown are for all individuals (before downsampling). (c) Levels of C4 protein in blood plasma from 182 adult men and 1662 adult women as a function of age. Concentrations are normalized to the number of C4 gene copies in an individual’s genome (a strong independent source of variance) and shown on a log10 scale as a LOESS curve. Shaded regions represent 95% confidence intervals derived during LOESS. (d) Levels of C3 protein in blood plasma as a function of age from the same individuals in panel c. Concentrations are shown on a log10 scale as a LOESS curve. Shaded regions represent 95% confidence intervals derived during LOESS. (e) C4 protein in blood plasma was measured in 670 individuals with SjS (red) and 1,151 individuals without SjS (black) and is shown on a log10 scale (x-axis). Vertical stripes represent median levels for cases and controls separately. Comparison of the two sets was done with a non-parametric two-sided Mann-Whitney rank–sum test (p = 4.8×10⁻²¹). (f) As in e, but concentrations are normalized to the number of C4 gene copies in an individual’s genome and this per-copy amount is shown on a log10 scale (x-axis). Comparison of the two sets was done with a non-parametric two-sided Mann-Whitney rank–sum test (p = 7.6×10⁻⁹).
Figure 1.
Figure 1.. Association of SLE and Sjögren’s syndrome (SjS) with C4 alleles
(a) Levels of SLE risk associated with 11 common combinations of C4A and C4B gene copy number. The color of each circle reflects the level of SLE risk (odds ratio) associated with a specific combination of C4A and C4B gene copy numbers relative to the most common combination (two copies of C4A and two copies of C4B) in gray. The area of each circle is proportional to the number of individuals with that number of C4A and C4B genes. Paths from left to right on the plot reflect the effect of increasing C4A gene copy number (greatly reduced risk); paths from bottom to top reflect the effect of increasing C4B gene copy number (modestly reduced risk); and diagonal paths from upper left to lower right reflect the effect of exchanging C4B for C4A copies (modestly reduced risk). Data are from analysis of 6,748 SLE cases and 11,516 controls of European ancestry. The odds ratios are reported with confidence intervals in Extended Data Fig. 2c. (b) SLE and SjS risk associated with common combinations of C4 structural allele and MHC SNP haplotype. For each C4 locus structure, separate odds ratios are reported for each “haplogroup,” i.e., the MHC SNP haplotype background on which the C4 structure segregates. Data are from analyses of 6,748 SLE cases and 11,516 controls for the left plot and 673 SjS cases and 1,153 controls for the right plot. Error bars represent 95% confidence intervals around the effect size estimate for each allele.
Figure 2.
Figure 2.. C4 and trans-ancestral analysis of the MHC association signal in SLE
(a) Common C4 alleles exhibit similar strengths of association (odds ratios) in European-ancestry and African American (1,494 SLE cases; 5,908 controls) cohorts. Error bars represent 95% confidence intervals around the effect size estimate for each sex. (b) Analysis of SLE risk across combinations of C4-B(S) and DRB1*03:01 genotypes in an African American SLE case–control cohort, in which the two alleles exhibit very little LD (r2 = 0.10). On each DRB1*03:01 genotype background, additional C4-B(S) alleles increase risk (i.e. within each grouping). Whereas on each C4-B(S) background, DRB1*03:01 alleles have no appreciable relationship with risk (this can be seen by comparing, for example, the first of the three points from each group). Error bars represent 95% confidence intervals around the effect size estimate for each combination of C4-B(S) and DRB1*03:01.
Figure 3.
Figure 3.. Sex differences in the magnitude of C4 genetic effects and complement protein concentrations.
(a) SLE risk (odds ratios) associated with the four most common C4 alleles in men (x-axis) and women (y-axis) among 6,748 affected and 11,516 unaffected individuals of European ancestry. For each sex, the lowest-risk allele (C4-A(L)-A(L)) is used as a reference (odds ratio of 1.0). Shading of each point reflects the relative level of SLE risk (darker = greater risk) conferred by C4A and C4B copy numbers as in Fig. 2b. Error bars represent 95% confidence intervals around the effect size estimate for each sex. (b) Schizophrenia risk (odds ratios) associated with the four most common C4 alleles in men (x-axis) and women (y-axis) among 28,799 affected and 35,986 unaffected individuals of European ancestry, aggregated by the Psychiatric Genomics Consortium. For each sex, the lowest-risk allele (C4-B(S)) is used as a reference (odds ratio of 1.0). For visual comparison with a, shading of each allele reflects the relative level of SLE risk. Error bars represent 95% confidence intervals around the effect size estimate for each sex. (c) Concentrations of C4 protein in cerebrospinal fluid sampled from 340 adult men (blue) and 167 adult women (pink) as a function of age with local polynomial regression (LOESS) smoothing. Concentrations are normalized to the number of C4 gene copies in an individual’s genome (a strong independent source of variance, Extended Data Fig. 7a) and shown on a log10 scale as a LOESS curve. Shaded regions represent 95% confidence intervals derived during LOESS. (d) Levels of C3 protein in cerebrospinal fluid from 179 adult men and 125 adult women as a function of age. Concentrations are shown on a log10 scale as a LOESS curve. Shaded regions represent 95% confidence intervals derived during LOESS.

Comment in

References

    1. Ngo ST, Steyn FJ & McCombe PA Gender differences in autoimmune disease. Front Neuroendocrinol 35, 347–369, doi:10.1016/j.yfrne.2014.04.004 (2014). - DOI - PubMed
    1. Abel KM, Drake R & Goldstein JM Sex differences in schizophrenia. Int Rev Psychiatry 22, 417–428, doi:10.3109/09540261.2010.515205 (2010). - DOI - PubMed
    1. Langefeld CD et al. Transancestral mapping and genetic load in systemic lupus erythematosus. Nature Communications 8, 16021, doi:10.1038/ncomms16021 (2017). - DOI - PMC - PubMed
    1. International MHC et al. Mapping of multiple susceptibility variants within the MHC region for 7 immune-mediated diseases. Proc Natl Acad Sci U S A 106, 18680–18685, doi:10.1073/pnas.0909307106 (2009). - DOI - PMC - PubMed
    1. Hanscombe KB et al. Genetic fine mapping of systemic lupus erythematosus MHC associations in Europeans and African Americans. Hum Mol Genet 27, 3813–3824, doi:10.1093/hmg/ddy280 (2018). - DOI - PMC - PubMed

Publication types

MeSH terms