. 2020 Jun;582(7811):234-239.
doi: 10.1038/s41586-020-2302-0. Epub 2020 May 13.

A positively selected FBN1 missense variant reduces height in Peruvian individuals

Affiliations

A positively selected FBN1 missense variant reduces height in Peruvian individuals

Samira Asgari et al. Nature. 2020 Jun.

Abstract

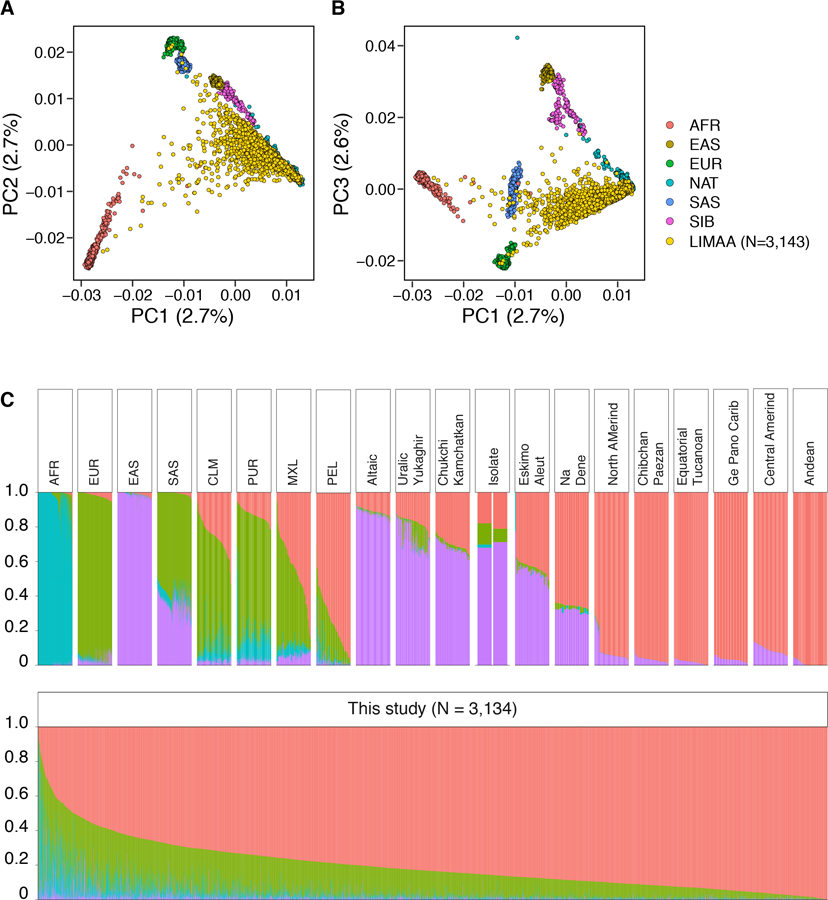
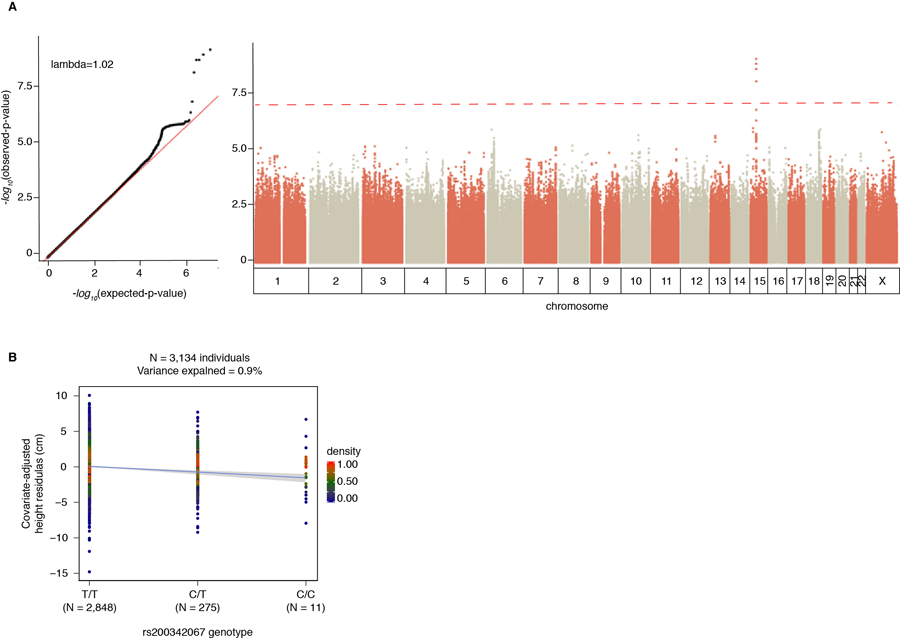
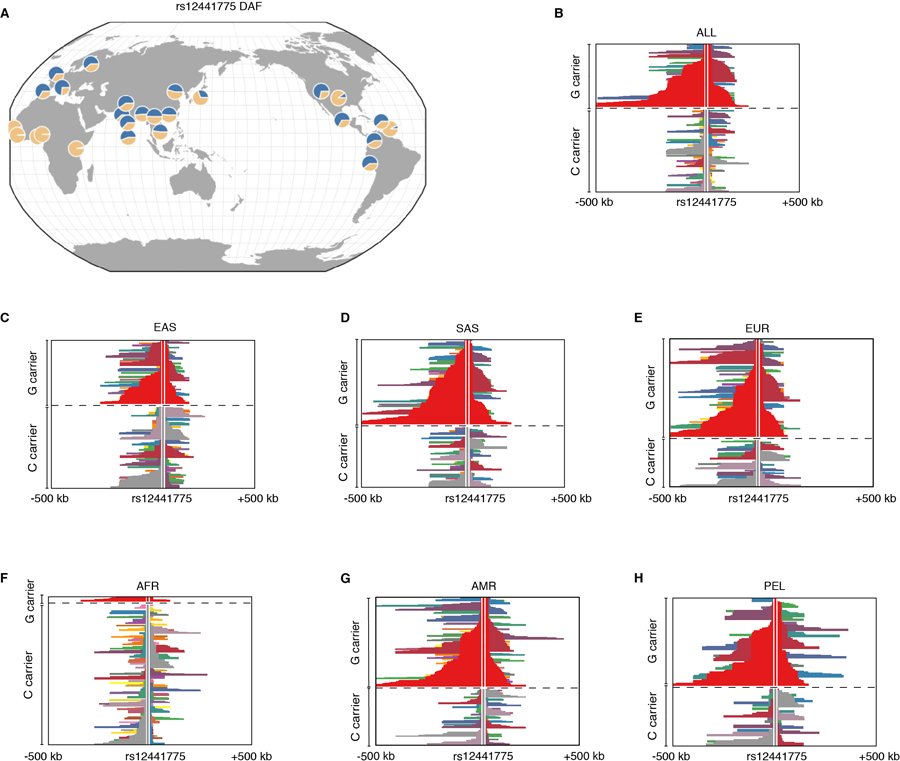
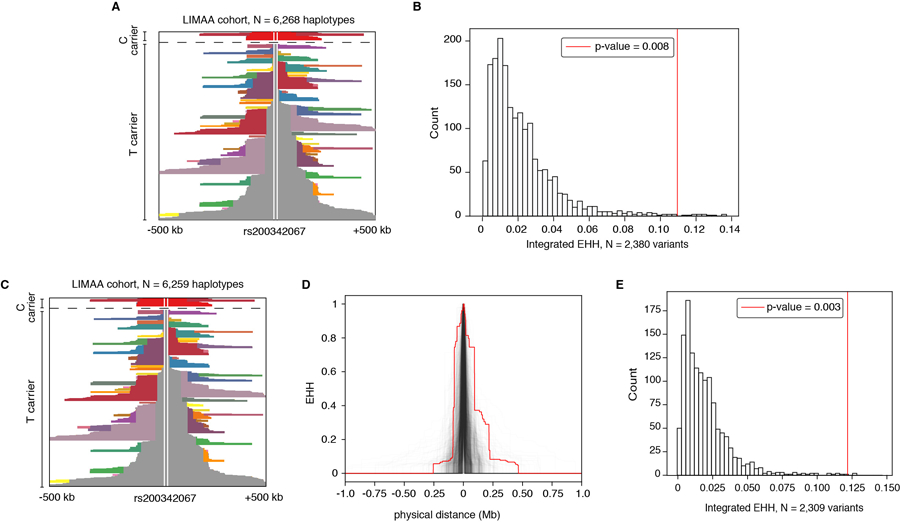
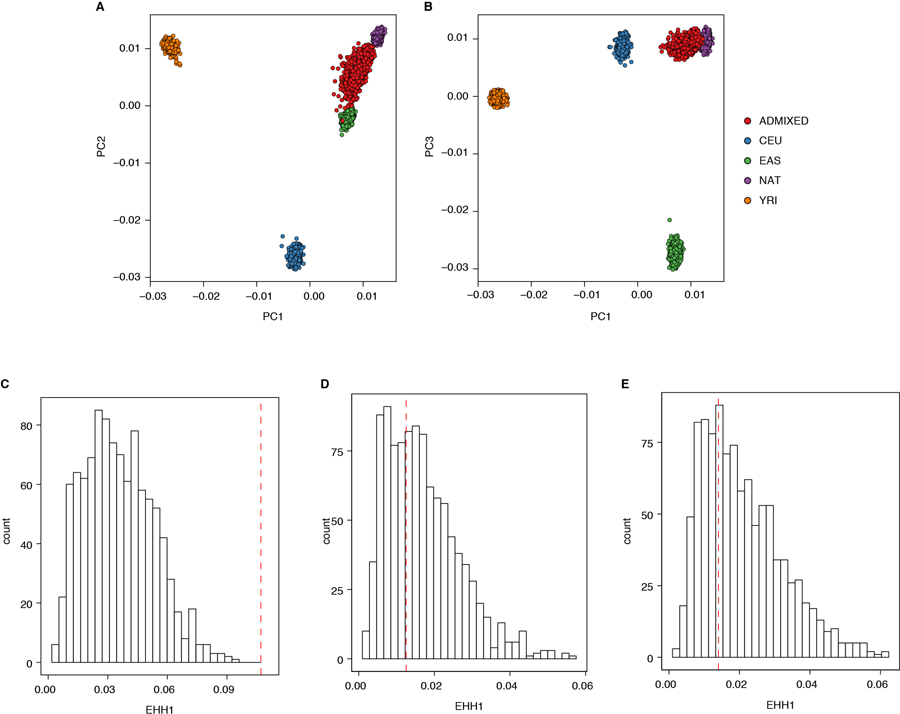
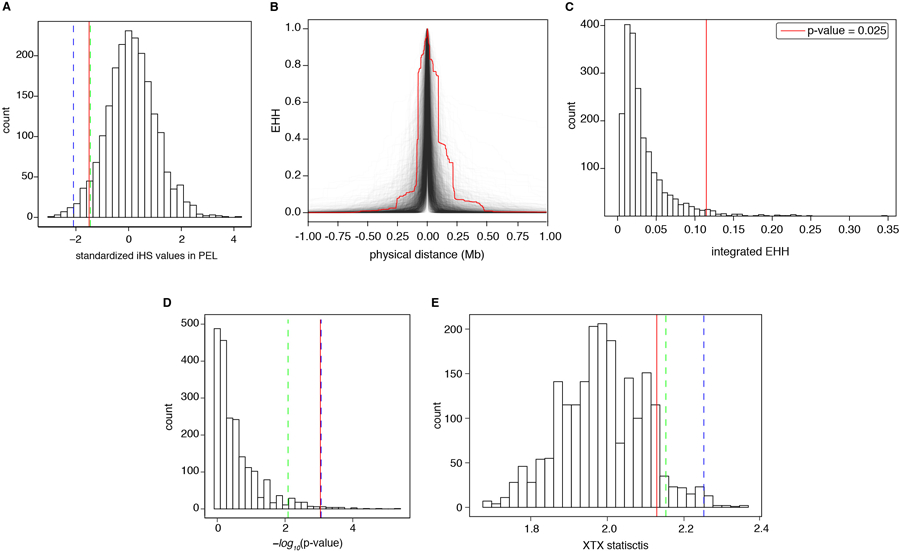
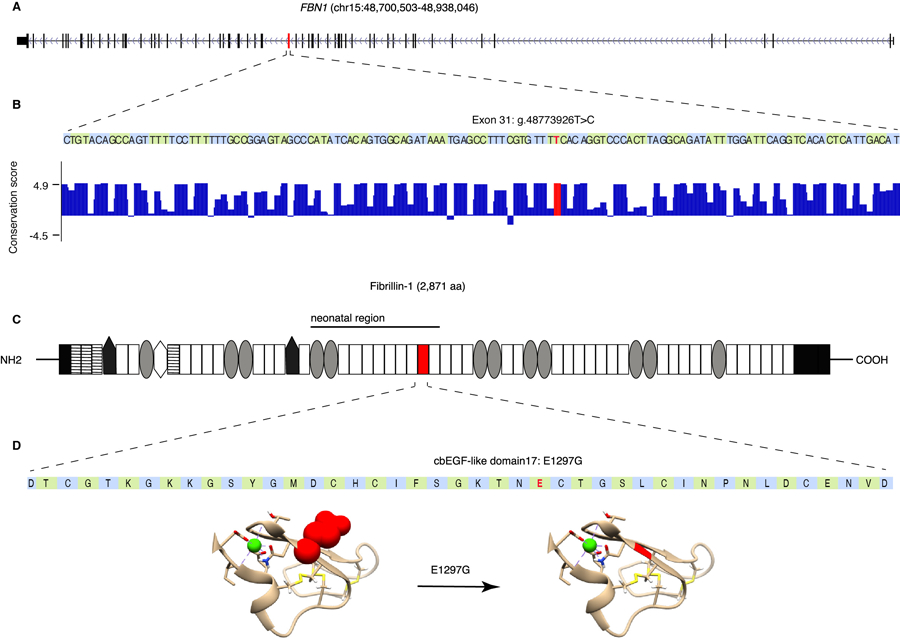
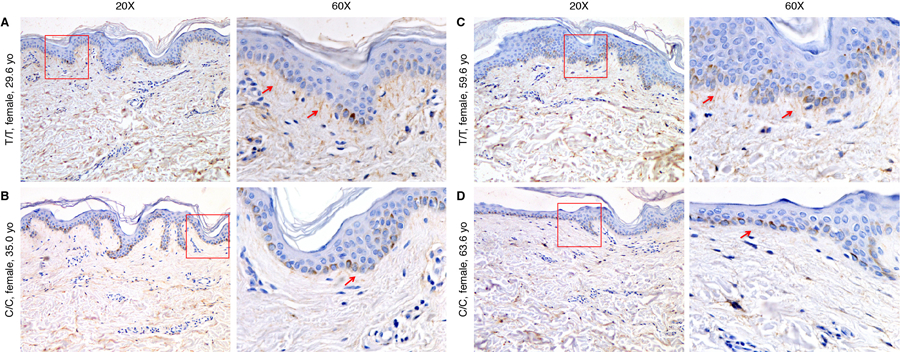
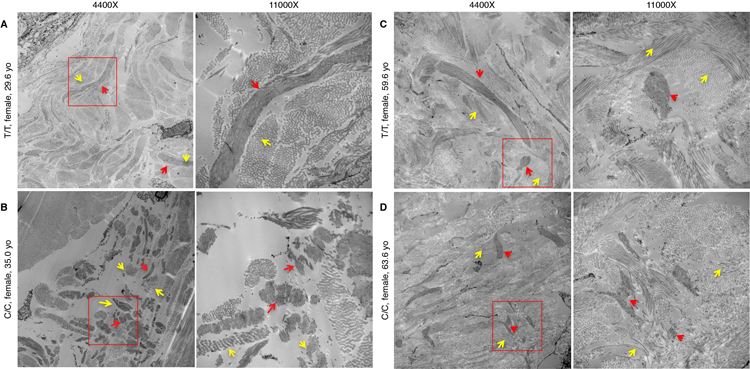
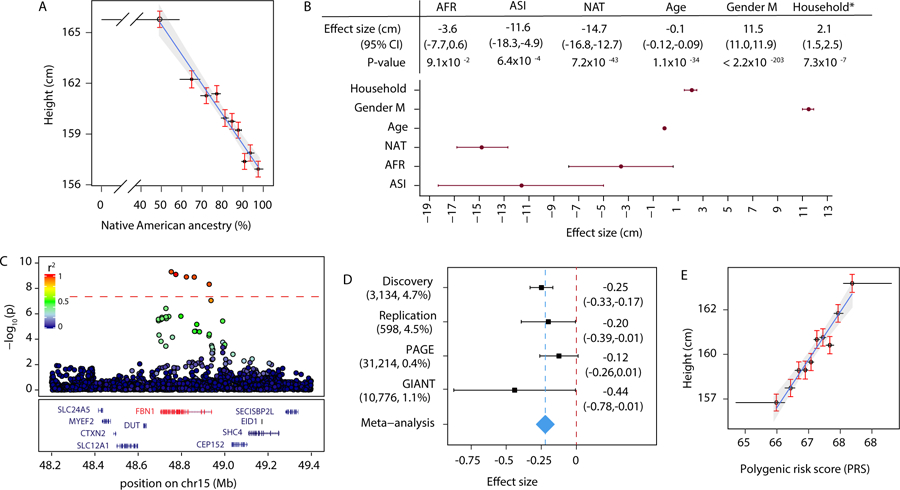
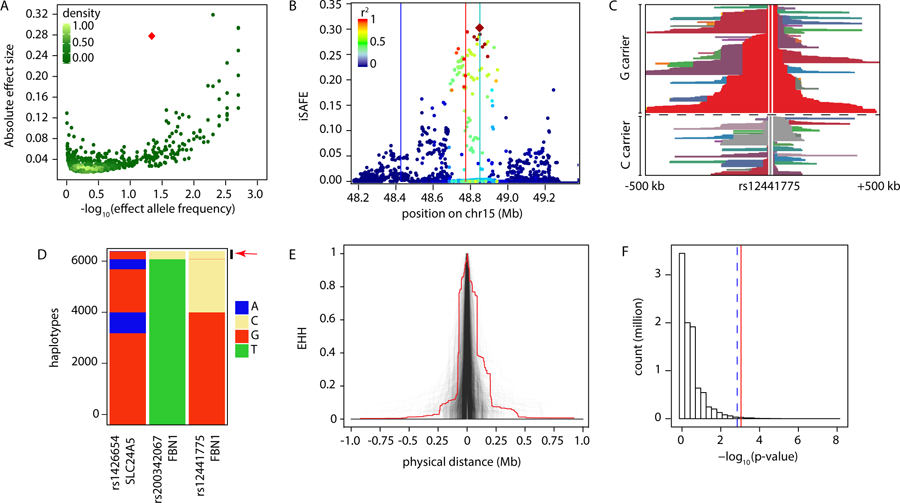
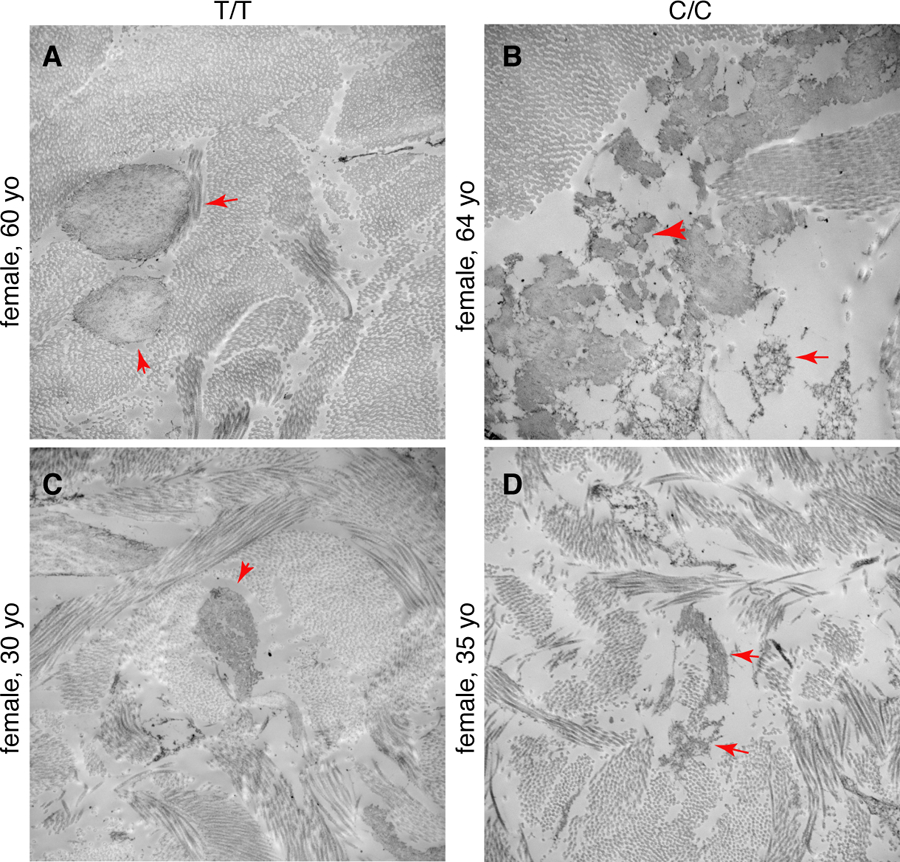
On average, Peruvian individuals are among the shortest in the world1. Here we show that Native American ancestry is associated with reduced height in an ethnically diverse group of Peruvian individuals, and identify a population-specific, missense variant in the FBN1 gene (E1297G) that is significantly associated with lower height. Each copy of the minor allele (frequency of 4.7%) reduces height by 2.2 cm (4.4 cm in homozygous individuals). To our knowledge, this is the largest effect size known for a common height-associated variant. FBN1 encodes the extracellular matrix protein fibrillin 1, which is a major structural component of microfibrils. We observed less densely packed fibrillin-1-rich microfibrils with irregular edges in the skin of individuals who were homozygous for G1297 compared with individuals who were homozygous for E1297. Moreover, we show that the E1297G locus is under positive selection in non-African populations, and that the E1297 variant shows subtle evidence of positive selection specifically within the Peruvian population. This variant is also significantly more frequent in coastal Peruvian populations than in populations from the Andes or the Amazon, which suggests that short stature might be the result of adaptation to factors that are associated with the coastal environment in Peru.


Conflict of interest statement

Competing interests: Authors declare no competing interests.

Figures

Extended Data Figure 1:
A and B) PCA analysis of genotyping data from Peruvians included in this study (N=3,134 individuals) merged with the data from continental populations from the 1000 Genomes Project phase 3 (N=3469 individuals) as well as the data from Siberian and Native American populations from Reich et al. 2012 Nature study (N=738 individuals) as reference panel (number of variants=34,936). Dots: individuals, color: populations (AFR: Africa, AMR: South America, EAS: East Asia, SAS: South Asia, EUR: Europe, SIB: Siberian, NAT: Native American). C) Global ancestry analysis using ADMIXTURE (K=4). We observed varying levels of European, African, and Asian admixture in our cohort (N=3,134 individuals) with a median proportion of Native American, European, African, and Asian ancestry per individual of 0.83 (Interquartile range (IQR)=0.72–.91), 0.14 (0.08–0.21), 0.01 (0.003–0.03), and 0.003 (10−5–0.01) respectively. Vertical lines: individuals, colors: genomic proportion of a given ancestry in an individual’s genome. ADMIXTURE analysis (K=4) is done using all populations in 1000 Genomes Project phase 3 as well as Siberian and Native American populations from the Reich et al. 2012 Nature study as reference. AFR: African ancestry includes: Yoruba in Ibadan, Nigeria, Luhya in Webuye, Kenya, Gambian in Western Divisions in the Gambia, Mende in Sierra Leone, Esan in Nigeria, Americans of African Ancestry in SW USA; EUR: European ancestry, includes: Central European, Utah Residents (CEPH) with Northern and Western European Ancestry, Toscani in Italy, Finnish in Finland, British in England and Scotland, Iberian Population in Spain; EAS: East Asian, includes: Han Chinese in Beijing, China, Japanese in Tokyo, Japan, Southern Han Chinese, Chinese Dai in Xishuangbanna, China, Kinh in Ho Chi Minh City, Vietnam; SAS: South Asian, includes: Gujarati Indian from Houston, Texas, Punjabi from Lahore, Pakistan, Bengali from Bangladesh, Sri Lankan Tamil from the UK, Indian Telugu from the UK; PUR: Puerto Ricans from Puerto Rico; CLM: Colombian from Medellin, Colombia; MXL: Mexicans from Los Angeles, California; PEL: Peruvians from Lima, Peru. Altic: Altaic language family, includes: Yakut, Buryat, Evenki, Tuvinians, Altaian, Mongolian, Dolgan. North Amerind: Northern Amerindian language family, includes: Maya, Mixe, Kaqchikel, Algonquin, Ojibwa, and Cree. Central Amerind: Central Amerindian language family, includes Pima, Chorotega, Tepehuano, Zapotec, Mixtec, and Yaqui. Andean: Andean language family, includes: Quechua, Aymara, Inga, Chilote, Diaguita, Chono, Hulliche, and Yaghan. For a full list of all populations in all language groups see the Reich et al. 2012 Nature study.
Extended Data Figure 2:
Extended Data Figure 2:. Association of rs200342067 and height.
A) Single variant association analysis (N=3,134 individuals and 7,756,401 variants), dotted red line: genome-wide significance threshold of 5×10⁻⁸. Five SNPs overlapping the coding sequence of FBN1, passed the genome-wide significance threshold. We did not observe any inflation in test statistics (λ=1.02). Association p-values are two-sided Wald test p-values. B) rs200342067 in heterozygous individuals reduces height by 2.2 cm (4.4 cm in homozygous individuals, including 11 individuals with C/C genotype, 275 C/T genotype, and 2,848 T/T genotype) and could explain 0.9% of height phenotypic variance in our cohort (N=3,143 individuals). x-axis: rs200342067 genotype, y-axis: height residuals after adjustments for age, sex, and a GRM as random effect.
Extended Data Figure 3:
Extended Data Figure 3:. rs12441775 derived allele frequency (DAF, rs12441775*G) and extended haplotype structure in the 1000 Genomes Project.
A) The derived allele, rs12441775*G, have a high frequency in all non-African populations in the 1000 Genomes Project (average DAF in non-Africans=58% IQR=51–64 and in Africans=4% (1–5)). The Map is generated using the Geography of Genetic Variants (GGV) browser, see Marcus and November, 2016, Bioinformatics study and http://www.popgen.uchicago.edu/ggv. B–H) Haplotypes carrying rs12441775*G (major/derived) are longer than haplotypes carrying rs12441775*C (minor/ancestral) in the non-African population. Horizontal lines: haplotypes, rs12441775’s position is marked above the haplotype. At any given position, adjacent haplotypes with the same color carry identical genotypes between the core SNP (rs12441775) and the that site, dashed line separates the haplotypes carrying the derived (above the line) and ancestral (below the line). SAS: South Asian, EUR: European, EAS: East Asian, AFR: African, AMR: American, PEL: Peruvians from Lima, Peru.
Extended Data Figure 4:
Extended Data Figure 4:. Haplotypes carrying rs200342067 are longer than what is expected under neutral selection.
A) Haplotype decay around rs200342067 in our cohort (N=6,268 haplotypes). The rs200342067’s position is marked above the haplotype, haplotypes above the dashed line are the haplotypes carrying rs200342067*C (derived/minor, N=297 haplotypes) and haplotypes under the dashed line are the haplotypes carrying rs200342067*T (ancestral/major, N=5,971 haplotypes). B) Integrated Extended Haplotype Homozygosity (integrated EHH) for haplotypes carrying rs200342067*C (N=297 haplotypes) compared to integrated EHH for haplotypes carrying 2,380 variants with similar DAF (4.7±1%) that are overlapping the neutral regions of the genome in our cohort (N=3,134 individuals). Haplotypes carrying rs200342067*C are longer than 99.2% of the haplotypes in neutral regions of the genome. Vertical red line: integrated EHH for haplotypes carrying rs200342067*C (integrated EHH=0.115). C) The same as A excluding the nine haplotypes that carry both rs200342067*C and rs12441775*G alleles. D) EHH decay curves for haplotypes carrying rs200342067*C excluding the nine haplotypes that carry both rs200342067*C and rs12441775*G (N=288 haplotypes) compared to haplotypes carrying 2,309 variants that have similar DAF to the updated frequency of rs200342067*C (4.6±1%) and are overlapping the neutral regions of the genome in our cohort (N=3,134 individuals). Haplotypes carrying rs200342067*C are longer than 99.7% of the haplotypes in the neutral genomic regions. E) Integrated EHH for haplotypes shown in D. Vertical red line: integrated EHH for haplotypes carrying rs200342067*C but not rs12441775*G (integrated EHH=0.124).
Extended Data Figure 5:
Extended Data Figure 5:. Simulation of haplotypes under neutral demographic model.
A) PCA plot of simulated individuals (N=1000 simulated individuals and 2000 simulated haplotypes). Individuals were simulated using a demographic model matching Peru’s population history and under neutral selection. red dots: simulated individuals, other dots: reference populations from the 1000 Genomes project. B) We compared rs200342067*C’s integrated EHH with integrated EHH of 1000 variants that had similar DAF to rs200342067 (DAF=4.7±1%) and were overlapping the same genomic region as rs200342067 on simulated chromosome 15 (physical position 48773926±20kb). rs200342067’s integrated EHH is more extreme than integrated EHH observed for any of the variants in the simulated data. x-axis: integrated EHH, distribution: integrated EHH of variants in simulated haplotypes (N=2000 haplotypes), vertical red line: integrated EHH value of rs200342067 in our cohort (N=6,628 haplotypes, integrated EHH=0.115). C and D) Similar to A for two different neutral regions on chromosome 15. vertical red lines: integrated EHH of rs17580697 (C, integrated EHH=0.012, 76th percentile) and rs305008 (D, integrated EHH=0.010, 74th percentile) in our cohort (N=6,628 haplotypes).
Extended Data Figure 6:
Extended Data Figure 6:. Comparison of different selection statistics for rs200342067 and other variants with similar DAF and recombination rate.
A) Distribution of iHS for 2,062 independent (at least 1Mb apart) variants matched in DAF and local recombination rate to rs200342067. iHS values are calculated for Peruvian individuals in the 1000 Genomes Project (N=85 individuals) and were obtained from Johnson and Voight, 2018, Nature Evolution and Ecology, study. red line: rs200342067’s iHS (iHS=−1.5, 4.7th percentile), green and blue lines: 5th and first percentile of iHS distribution. B) EHH decay curves for rs200342067 (red line) as well as haplotypes carrying 2,062 independent variants (at least 1Mb apart) matched in DAF and local recombination rate to rs200342067 in our cohort (N=6,268 haplotypes (gray lines). C) Distribution of integrated EHH for haplotypes shown in B, haplotypes carrying rs200342067*C are longer than 97.5% of haplotypes carrying similar variants. x-axis: integrated EHH, red line: integrated EHH for rs200342067*C allele (integrated EHH=0.115). D) Histogram of Fisher’s exact test results comparing the extent of allele frequency differences between coastal (N=46 individuals) and non-coastal (N=104 individuals) regions in Peru for 2,062 independent variants that were matched in DAF and local recombination rate to rs200342067. x-axis: -log10 of two-sided Fisher’s exact test p-value, dashed blue and green vertical lines: 99th and 95th percentiles respectively, solid red line: -log10 of two-sided Fisher’s exact test p-value for rs200342067 (1.1% percentile, two-sided Fisher’s exact test p-value=0.0005). E) Bayenv2.0 XTX statistics, a measure of deviation from neutral patterns of population structure, for 2,062 independent variants that were matched in DAF and local recombination rate to rs200342067. x-axis: XTX statistics, red line: XTX value for rs200342067 (XTX= 2.13, 8.3th percentile), green and blue lines: 5th and first percentile of XTX distribution respectively.
Extended Data Figure 7:
Extended Data Figure 7:. Genomic context of rs200342067 (E1297G).
A) Schematic representation of FBN1, exons are shown as black bars. Exon 31 (ENSE00001753582) is shown in red. B) FBN1 exon 31 sequence and PhyloP per-nucleotide conservation score based on multiple sequence alignment of 100 vertebrate species (obtained from UCSC genome browser GRCh37 assembly conservation track). The T>C change due to rs200342067 occurs in a conserved nucleotide. C) Schematic representation of Fibrillin-1 (ENST00000316623.5). Fibrillin-1 consists of the following domains: N and C terminal (black rectangles), EGF-like domains (stripped rectangles), hybrid domains (black pentagons), TGFβ-binding domains (gray ovals), a proline-rich domain (white hexagon), and 43 calcium binding cbEGF-like domains (white rectangles). cbEGF-domain 17, the domain affected by rs200342067 (E1297G), is shown in red, E1297G is located between a conserved cysteine (p.Cys1296) involved in forming a disulfide bond with p.Cys1284 and a conserved asparagine (p.Asp1298) involved in calcium binding. D) Fibrillin-1 cbEGF-domain 17 sequence and 3D structure of cbEGF-domains 17 and 18 (the 3D structure was obtained based homology with fibrillin-1 cbEGF-domains 12 and 13 previously published by Smallridge et al, J Biol Chem 2003 (1LMJ in the Protein Data Bank). rs200342067 changes glutamic acid, a large amino acid with a negatively charged side chain, to glycine, the smallest amino acid with no side chain (shown in red). The side chains are shown for rs200342067 (red spheres), the calcium-interacting residues (beige sticks), and the cysteine residues involved in disulfide bonds (yellow sticks). Calcium ion is shown in green.
Extended Data Figure 8:
Extended Data Figure 8:. Immunohistochemical staining of fibrillin-1.
A–B) Fibrillin-1 staining in skin biopsies in two individuals with rs200342067 C/C genotype and C–D) two individuals with T/T genotype matched for age, sex, and ancestry proportions. Individuals with C/C genotype have less fibrillin-1 deposition in the dermal extracellular matrix (ECM) and shorter microfibrillar projections from the dermal-epidermal junction into the superficial (papillary) dermis (red arrows, 20x) as well as less fibrillin-1 deposition in the deeper dermis. Two magnification have been shown, the red rectangles in the first column (20x magnification) are magnified in the second column (60x).
Extended Data Figure 9:
Extended Data Figure 9:. Electron microscopy (EM) of fibrillin-1 in skin.
A–C) EM of the dermal-epidermal junction in two individuals with rs200342067 T/T genotype B–D) and two individuals with rs200342067 C/C genotype which are matched for age, sex, and ancestry proportions. Individuals with C/C genotype have short, fragmented, and less densely packed microfibrils with irregular edges (red arrows) and their microfibrils are embedded in less dense collagen bundles (yellow arrows) compared to the individuals with T/T genotype. Two magnification have been shown, the white rectangles in the first column (4400x magnification) are magnified in the second column (11000x).
Figure 1:
Figure 1:. Genetic architecture of height in the Peruvian population.
A) Height is negatively correlated with Native American ancestry proportion (N=3,134 individuals, Pearson’s r=−0.28, CI=−0.31 −0.25, t-value = −16.36, degrees of freedom (df) = 3132, one-sample t-test two-sided p-value=9.3×10−58). Point: median for a decile of Native American ancestry (x-axis) and the average height for that decile (y-axis). Error bars: range (x-axis) and standard error (se, y-axis). B) Increased Native American ancestry is associated with lower height after adjusting for age, sex, African and Asian ancestry proportions, household as a proxy for socioeconomic factors, and genetic relatedness (N=3,134 individuals). *Household effect size is calculated as the standard deviation (sd) in the model’s intercept. The effect sizes for African, Asian, and Native American ancestry are given relative to European ancestry. P-values are two-sided p-values from χ2 difference test. C) Locus-specific Manhattan plot of -log10 transformed GWAS p-values. One locus on chromosome 15 passed the genome-wide significance threshold (p-value<5×10⁻⁸, N=3,134 individuals). P-values are two-sided Wald test p-values. Dots: variants colored according to their LD with rs200342067 (total number of variants tested=7,756,401, number of variants shown=3,176). D) rs200342067 showed a similar MAF, direction of effect, and effect size in an independent cohort of Peruvians (N=598 individuals), and two independent cohorts of Latino/Hispanics (N=31,214 and 10,776 individuals respectively). Squares: rs200342067’s effect size on inverse normally transformed height, dashed blue line: meta-analysis effect size, diamond: meta-analysis se, error bars: 95% CI. Cohort’s size and rs200342067’s MAF is shown in parentheses and effect sizes (CIs) on the right. E) Height is positively correlated with polygenic risk scores (PRS) (N=3,134 individuals, Pearson’s r=0.22, CI=0.18–0.25, t-value = 12.36, df = 3132, one-sample t-test two-sided p-value=2.7×10⁻³⁴). Points: median for a PRS decile (x-axis) and the average height for that decile (y-axis). Error bars: range (x-axis) and se (y-axis).
Figure 2:
Figure 2:. rs200342067 is positively selected in the Peruvian population.
A) Conditional effect sizes and allele frequencies of 3,290 previously identified height-associated variants in the European population (N ~ 700,000 individuals, green dots) compared with the effect size and allele frequency of rs200342067 (red diamond) from this study (N=3,134 individuals, MAF=4.7%). Effect sizes are shown as the absolute effect size on invers normally transformed height. B) iSAFE plot for a 1.2Mb region around rs200342067 in our cohort (N=3,134 individuals). x-axis: physical position, y-axis: iSAFE score. Dots: variants colored according to their LD with rs12441775 (red diamond); Red, cyan, and blue vertical lines: physical position of rs200342067, rs12441775, and rs1426654 respectively. C) Haplotype decay around rs12441775 in our cohort (N=3,134 individuals). rs12441775’s position is marked above the haplotype, haplotypes above the dashed line carry rs12441775*G (derived/major, N=4,063 haplotypes) and haplotypes below the dashed carry rs12441775*C (ancestral/minor, N=2,205 haplotypes). D) Stacked barplot of haplotypes carrying rs200342067, rs12441775, and rs1426654 in our cohort (N=6,268 haplotypes). Only 3% of the haplotypes carrying rs200342067*C allele (red arrow) also carry rs12441775*G allele (AF=64.8%) and only 4% carry rs1426654*A (AF=17.9%). x-axis: SNPs, y-axis: haplotypes carrying derived or alternate allele of rs200342067, rs12441775, and rs1426654. E) Extended Haplotype Homozygosity (EHH) plots for haplotypes carrying the rs200342067*C (red line, N=297 haplotypes) compared to haplotypes carrying 2,380 variants that are overlapping the neutral regions of the genome and have similar DAF to rs200342067*C (4.7±1%, gray lines). Haplotypes carrying rs200342067*C are longer than 99.2% of the haplotypes in the neutral genomic regions. F) Histogram of Fisher’s exact test results comparing the extent of allele frequency differences between coastal (N=46 individuals) and non-coastal (N=104 individuals) regions in Peru. x-axis: -log10 p-value of two-sided Fisher’s exact test (N=9,381,550 variants), dashed blue line: 99th percentile, solid red line: rs200342067’s -log10 p-value (0.7th percentile, Fisher’s exact test two-sided p-value=0.0005); y-axis: variant count in millions.
Figure 3:
Figure 3:. Fibrillin-1 electron microscopy (EM) in the skin.
A–C) EM of the dermal-epidermal junction in two individuals with rs200342067 T/T genotype and B–D) two individuals with rs200342067 C/C genotype which are matched for age, sex, and ancestry proportions. Individuals with C/C genotype have short, fragmented, and less densely packed microfibrils with irregular edges (red arrows) and their microfibrils are embedded in less dense collagen bundles compared to the individuals with T/T genotype. Magnification: 11000x.

References

    1. NCD Risk Factor Collaboration (NCD-RisC). A century of trends in adult human height. Elife 5, (2016). - PMC - PubMed
    1. Homburger JR et al. Genomic Insights into the Ancestry and Demographic History of South America. PLoS Genet. 11, e1005602 (2015). - PMC - PubMed
    1. Harris DN et al. Evolutionary genomic dynamics of Peruvians before, during, and after the Inca Empire. Proc. Natl. Acad. Sci. U. S. A 115, E6526–E6535 (2018). - PMC - PubMed
    1. Ruiz-Linares A et al. Admixture in Latin America: geographic structure, phenotypic diversity and self-perception of ancestry based on 7,342 individuals. PLoS Genet. 10, e1004572 (2014). - PMC - PubMed
    1. Browning BL & Browning SR Improving the accuracy and efficiency of identity-by-descent detection in population data. Genetics 194, 459–471 (2013). - PMC - PubMed

Methods References:

    1. Luo Y et al. Early progression to active tuberculosis is a highly heritable trait driven by 3q23 in Peruvians. Nat. Commun 10, 3765 (2019). - PMC - PubMed
    1. Zelner JL et al. Identifying Hotspots of Multidrug-Resistant Tuberculosis Transmission Using Spatial and Molecular Genetic Data. J. Infect. Dis 213, 287–294 (2016). - PMC - PubMed
    1. Odone A et al. Acquired and Transmitted Multidrug Resistant Tuberculosis: The Role of Social Determinants. PLoS One 11, e0146642 (2016). - PMC - PubMed
    1. Zhou X & Stephens M Efficient multivariate linear mixed model algorithms for genome-wide association studies. Nat. Methods 11, 407–409 (2014). - PMC - PubMed
    1. Price AL et al. Long-range LD can confound genome scans in admixed populations. American journal of human genetics vol. 83 132–5; author reply 135–9 (2008). - PMC - PubMed

Publication types