. 2020 Jun;582(7811):265-270.
doi: 10.1038/s41586-020-2311-z. Epub 2020 May 20.

Sialylation of immunoglobulin E is a determinant of allergic pathogenicity

Affiliations

Sialylation of immunoglobulin E is a determinant of allergic pathogenicity

Kai-Ting C Shade et al. Nature. 2020 Jun.

Abstract

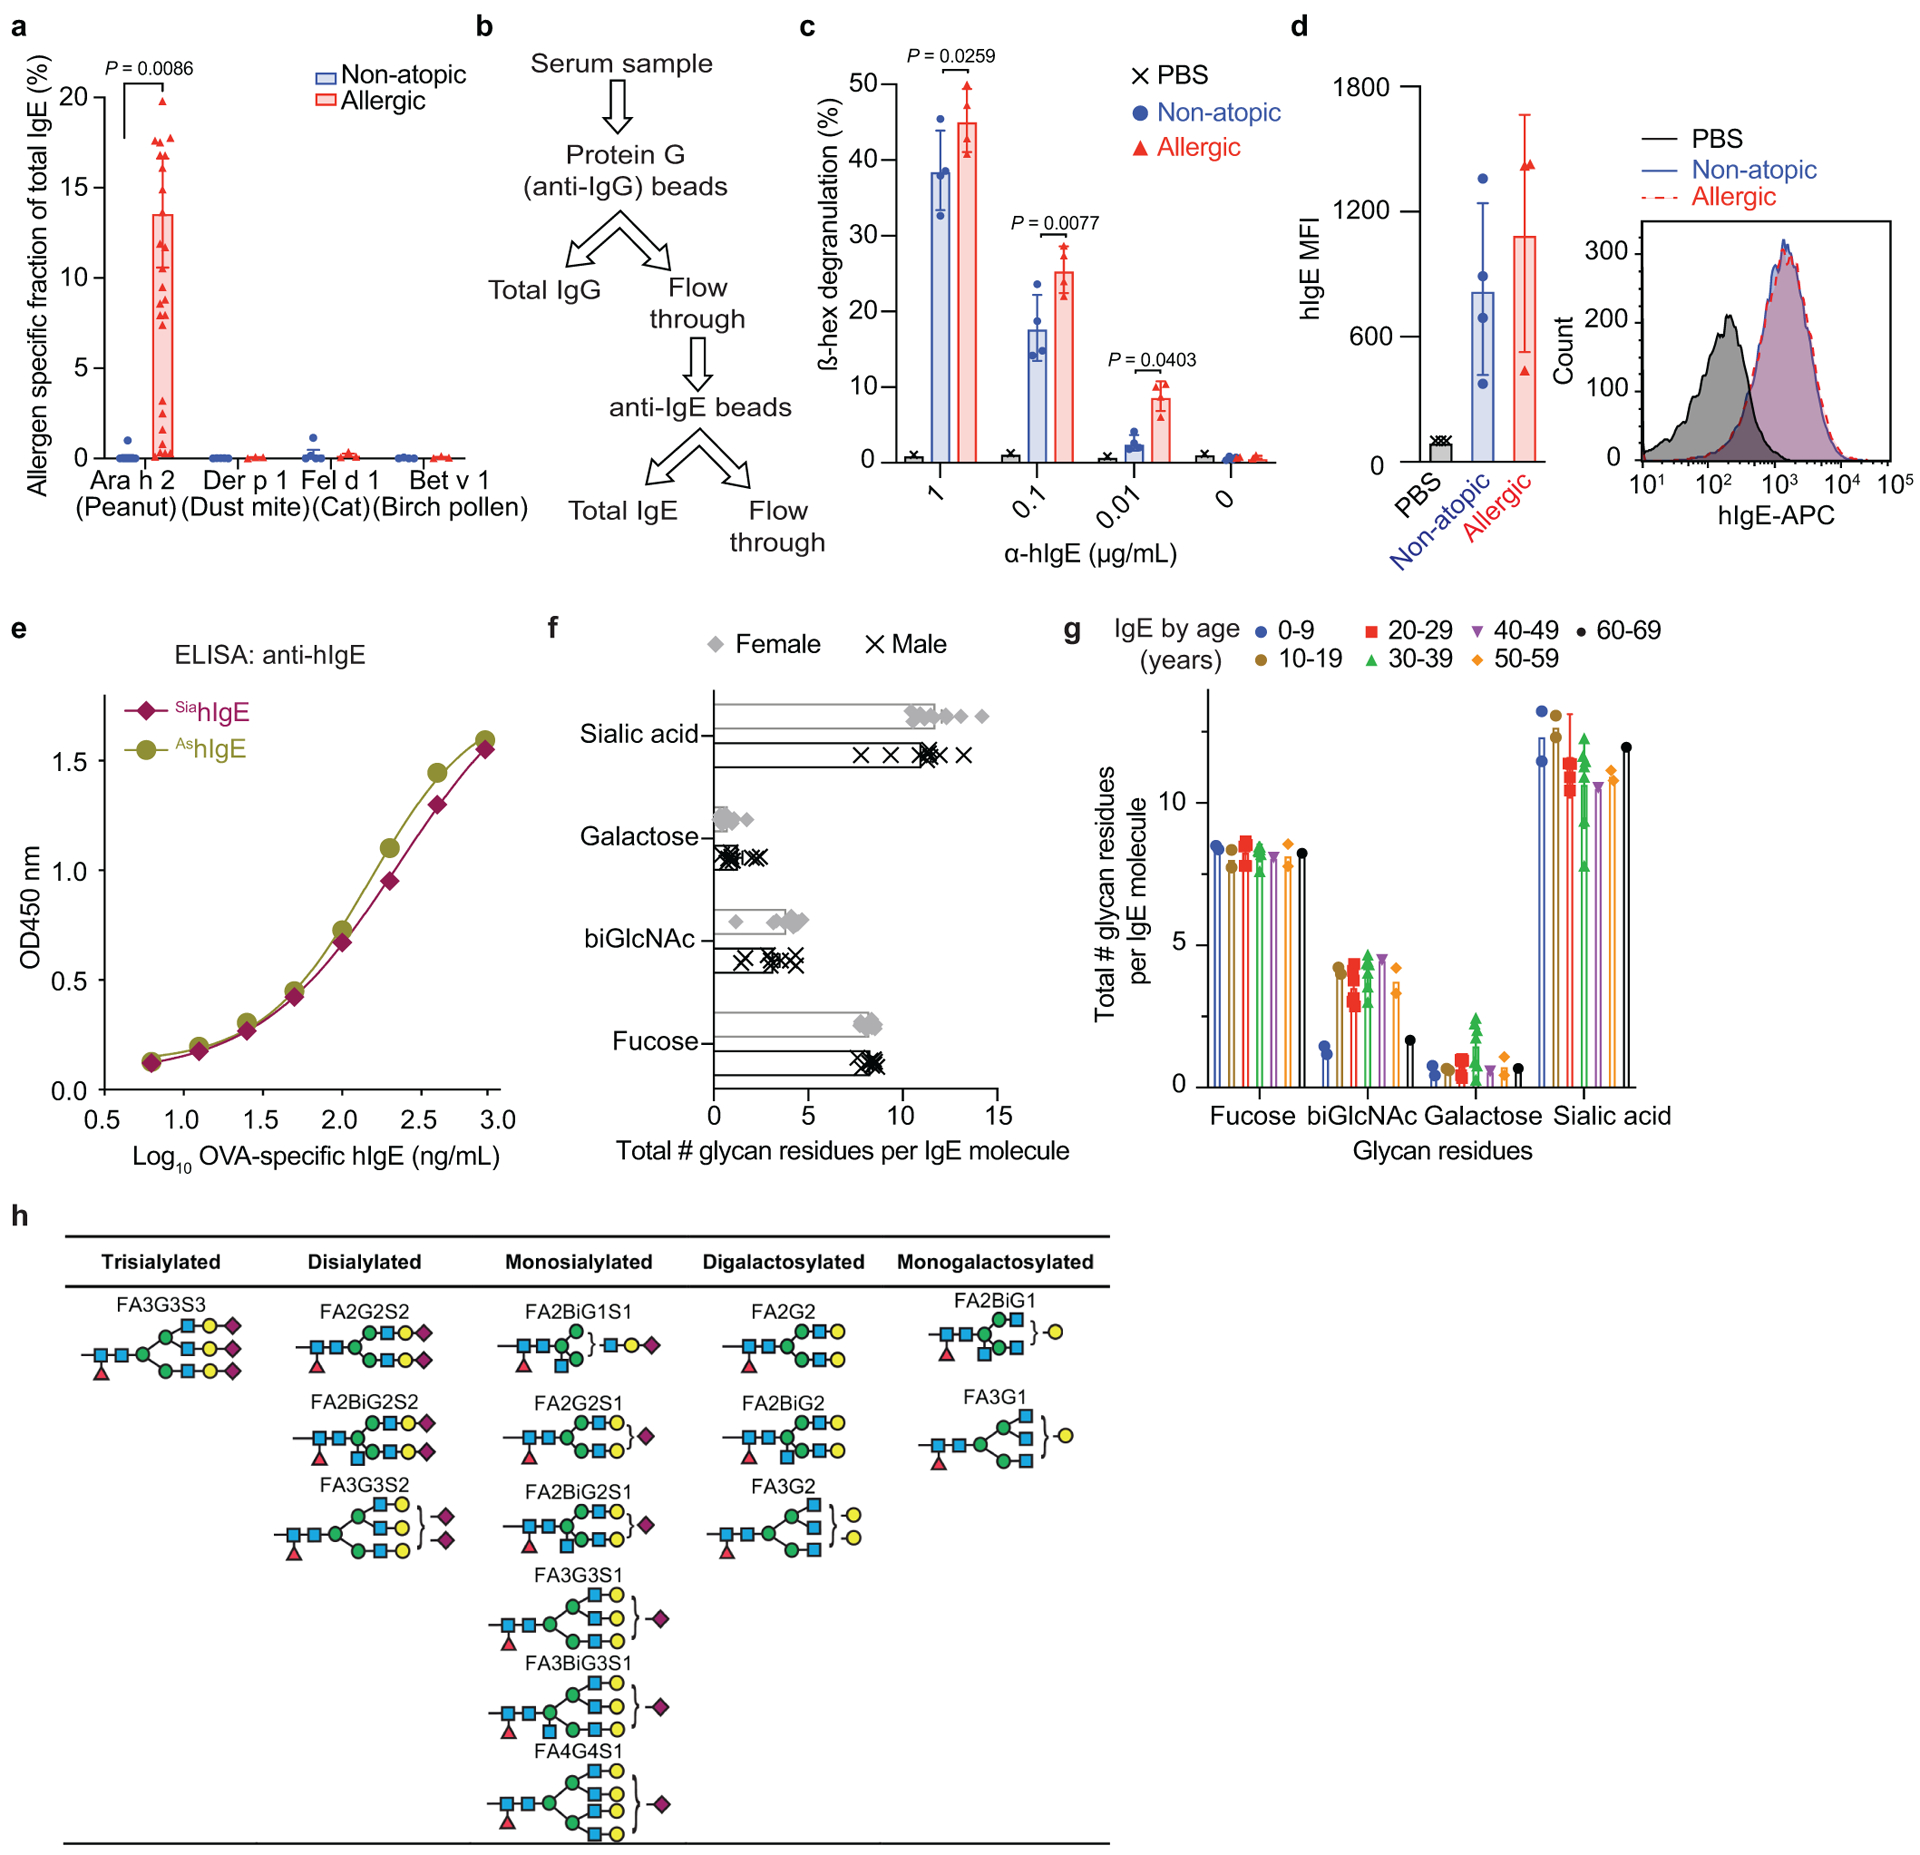
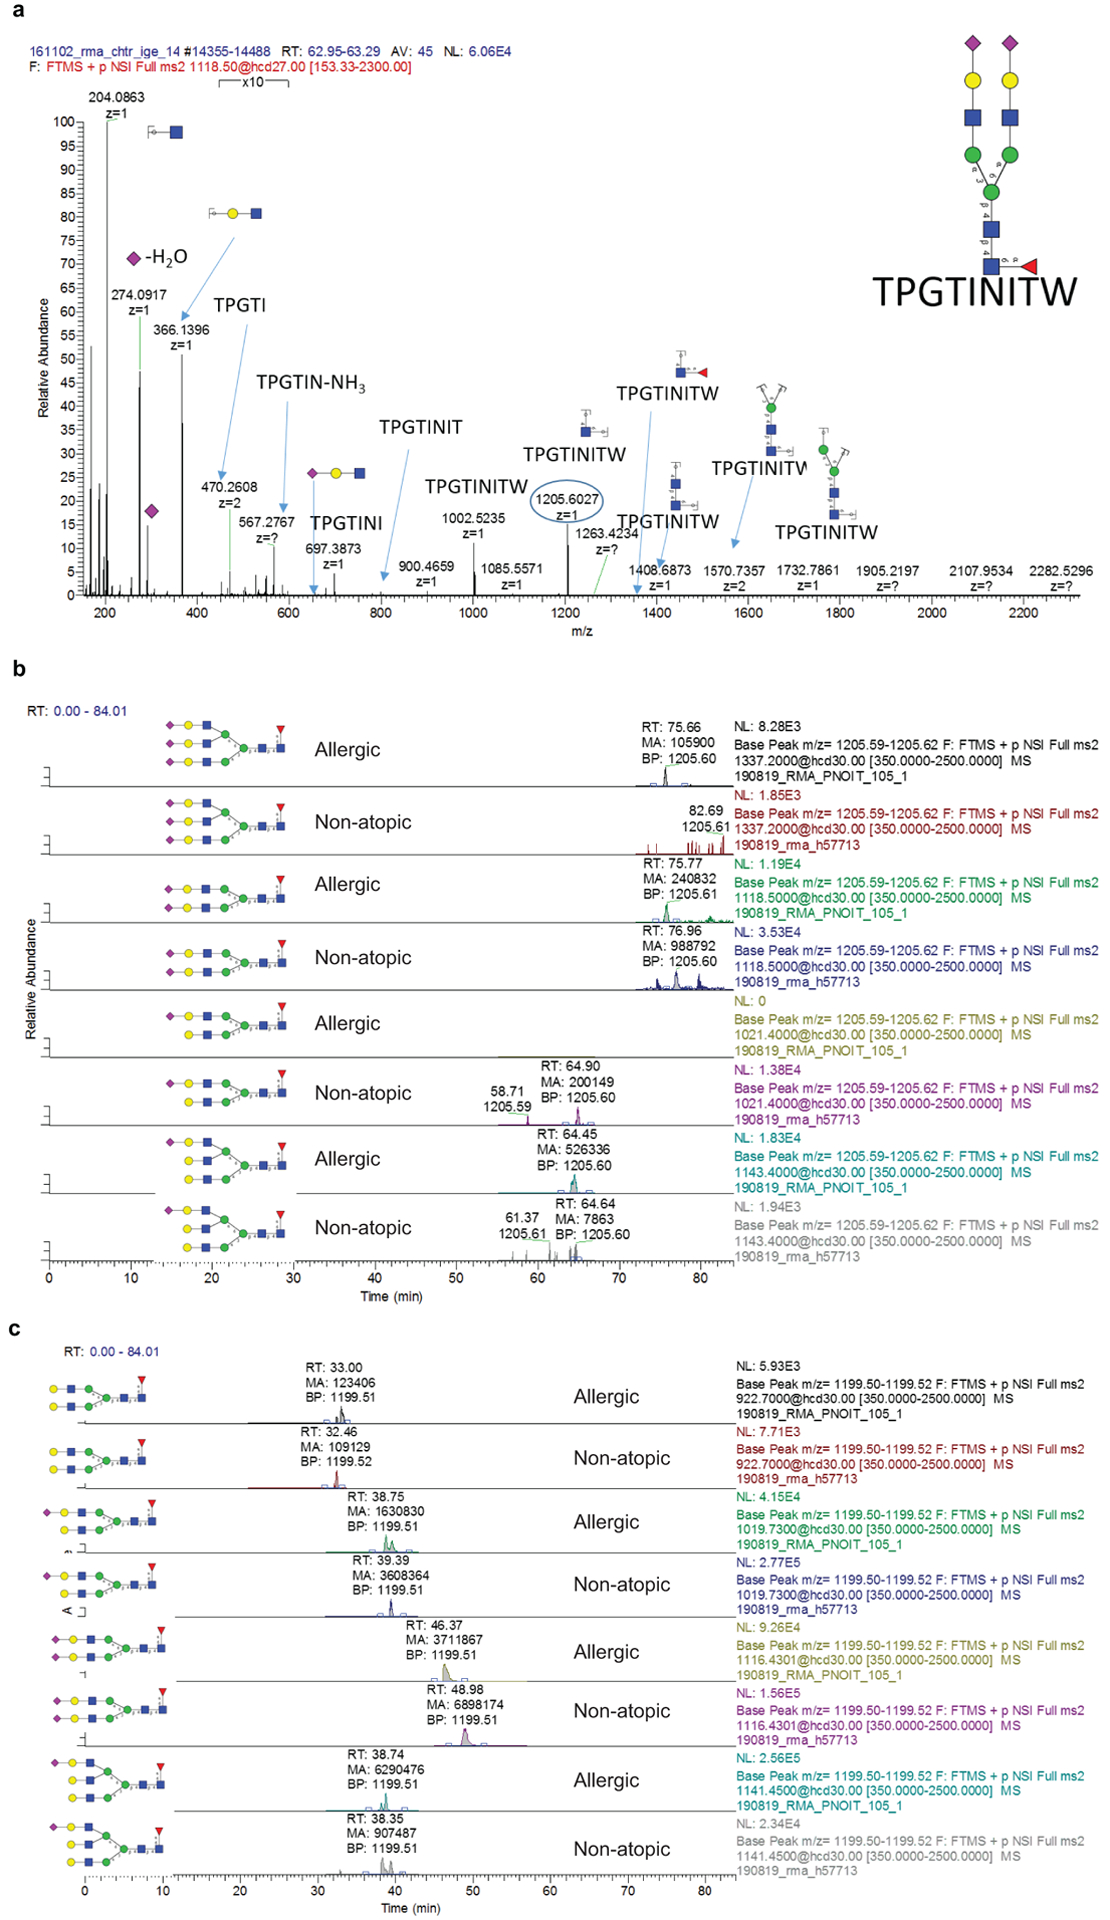
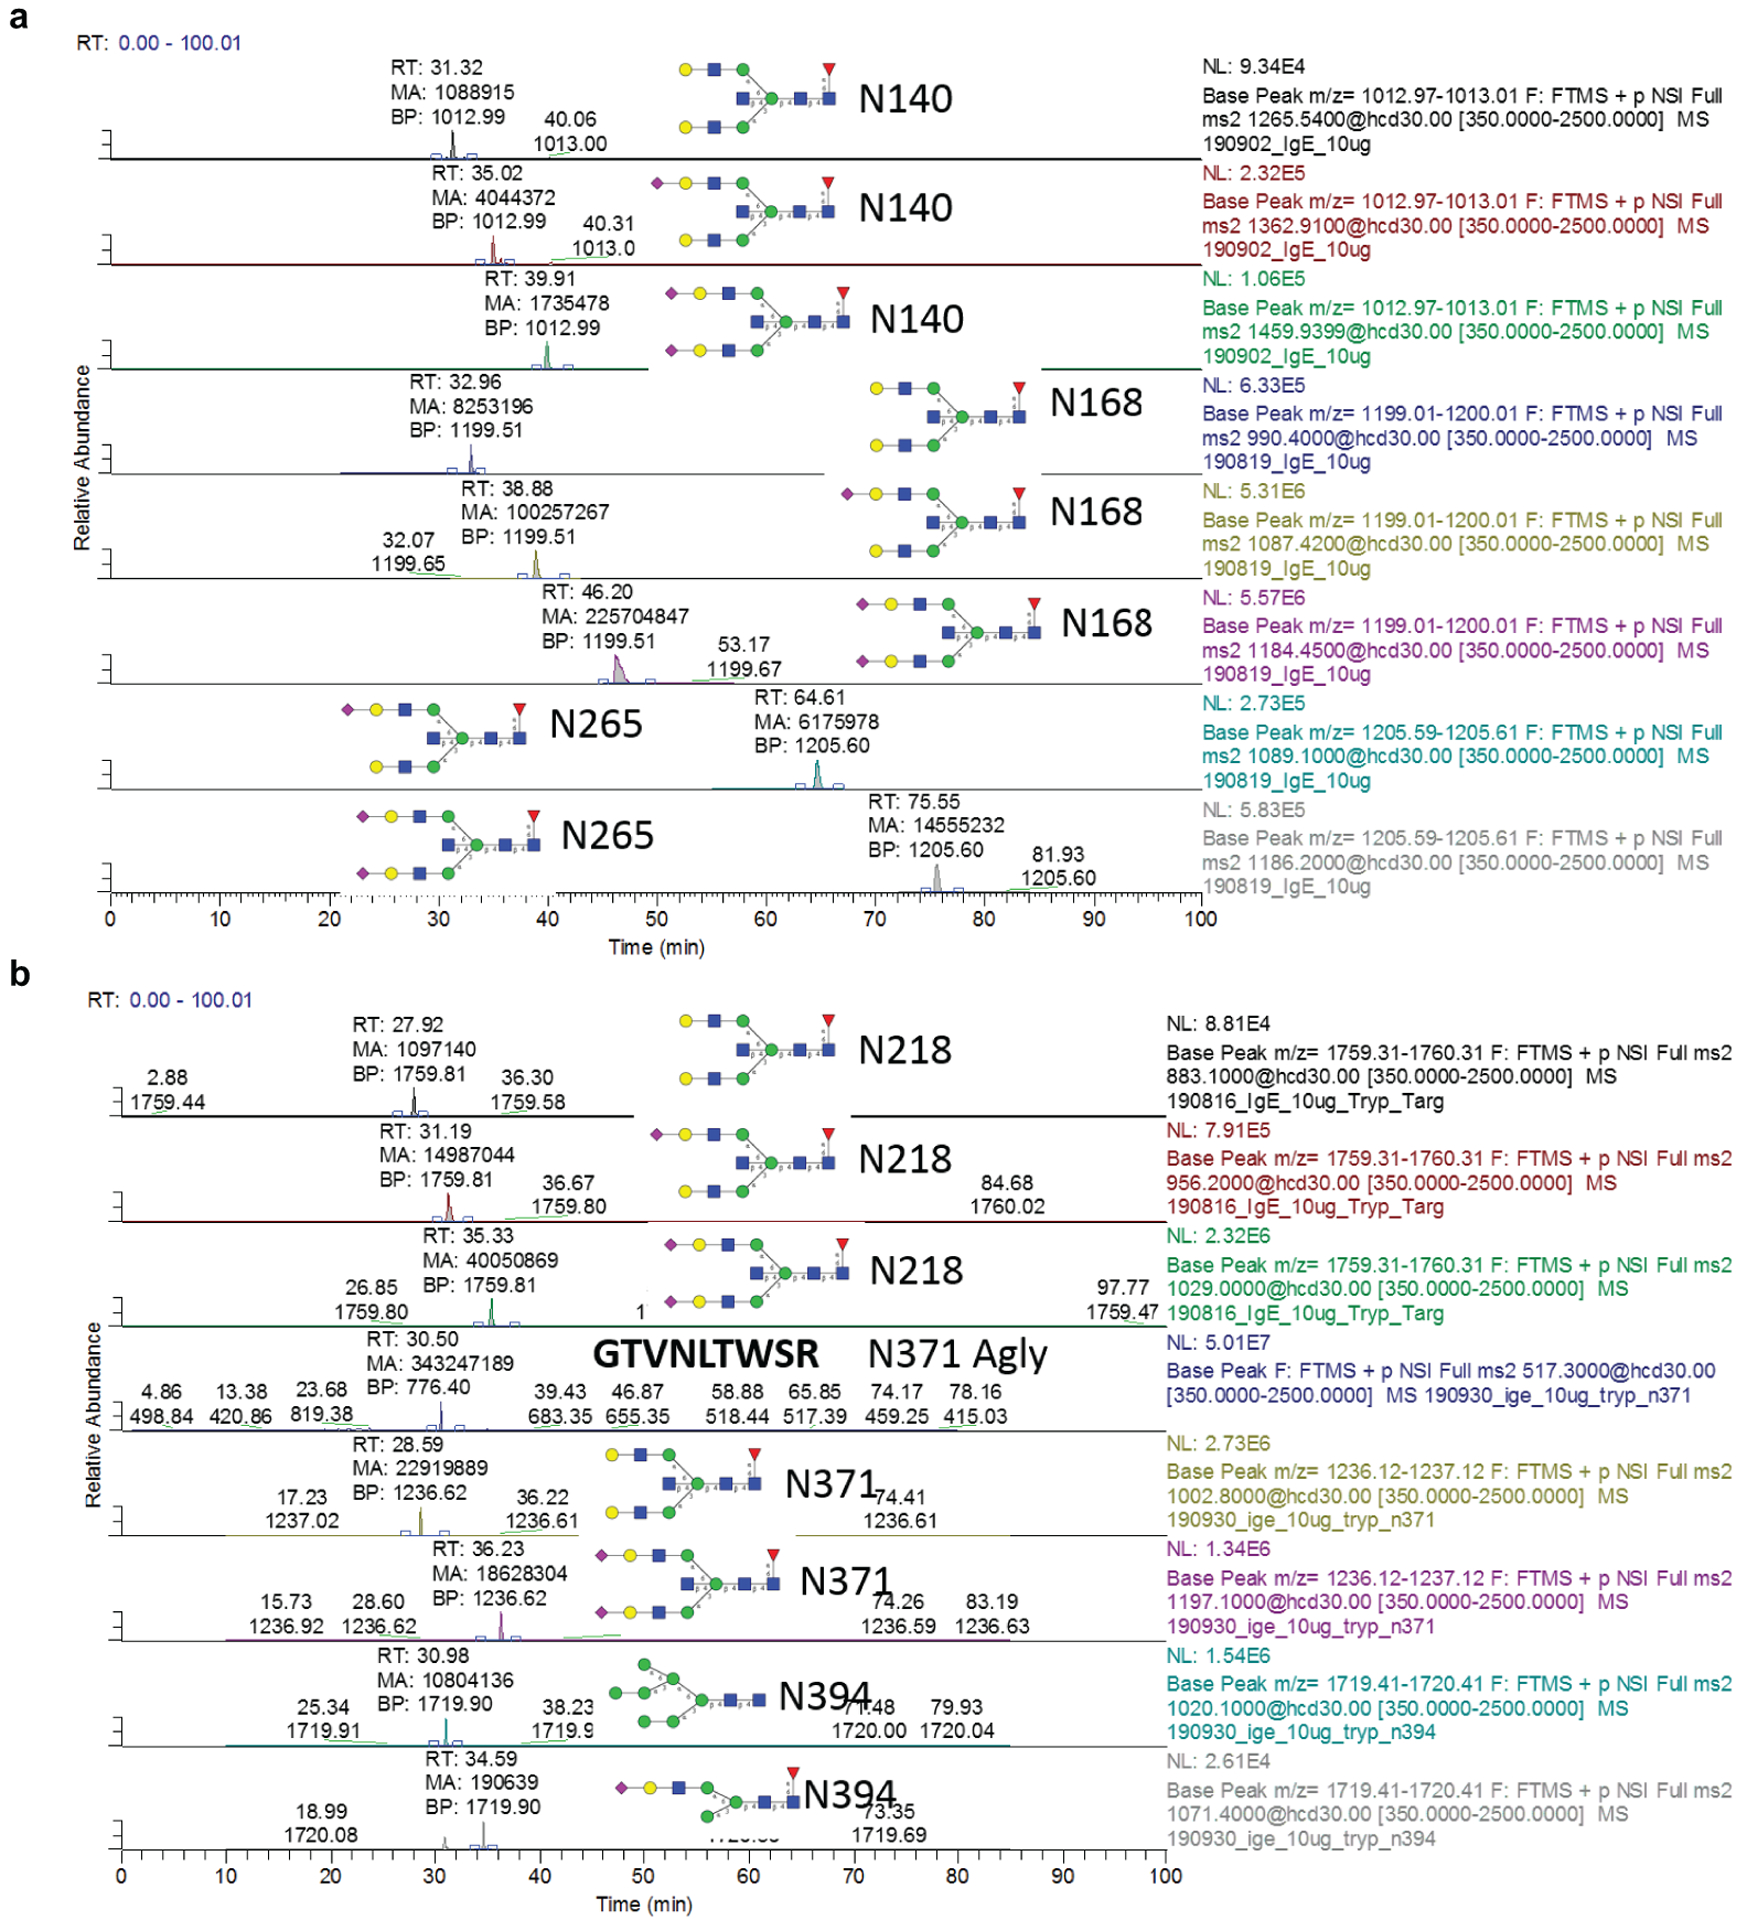
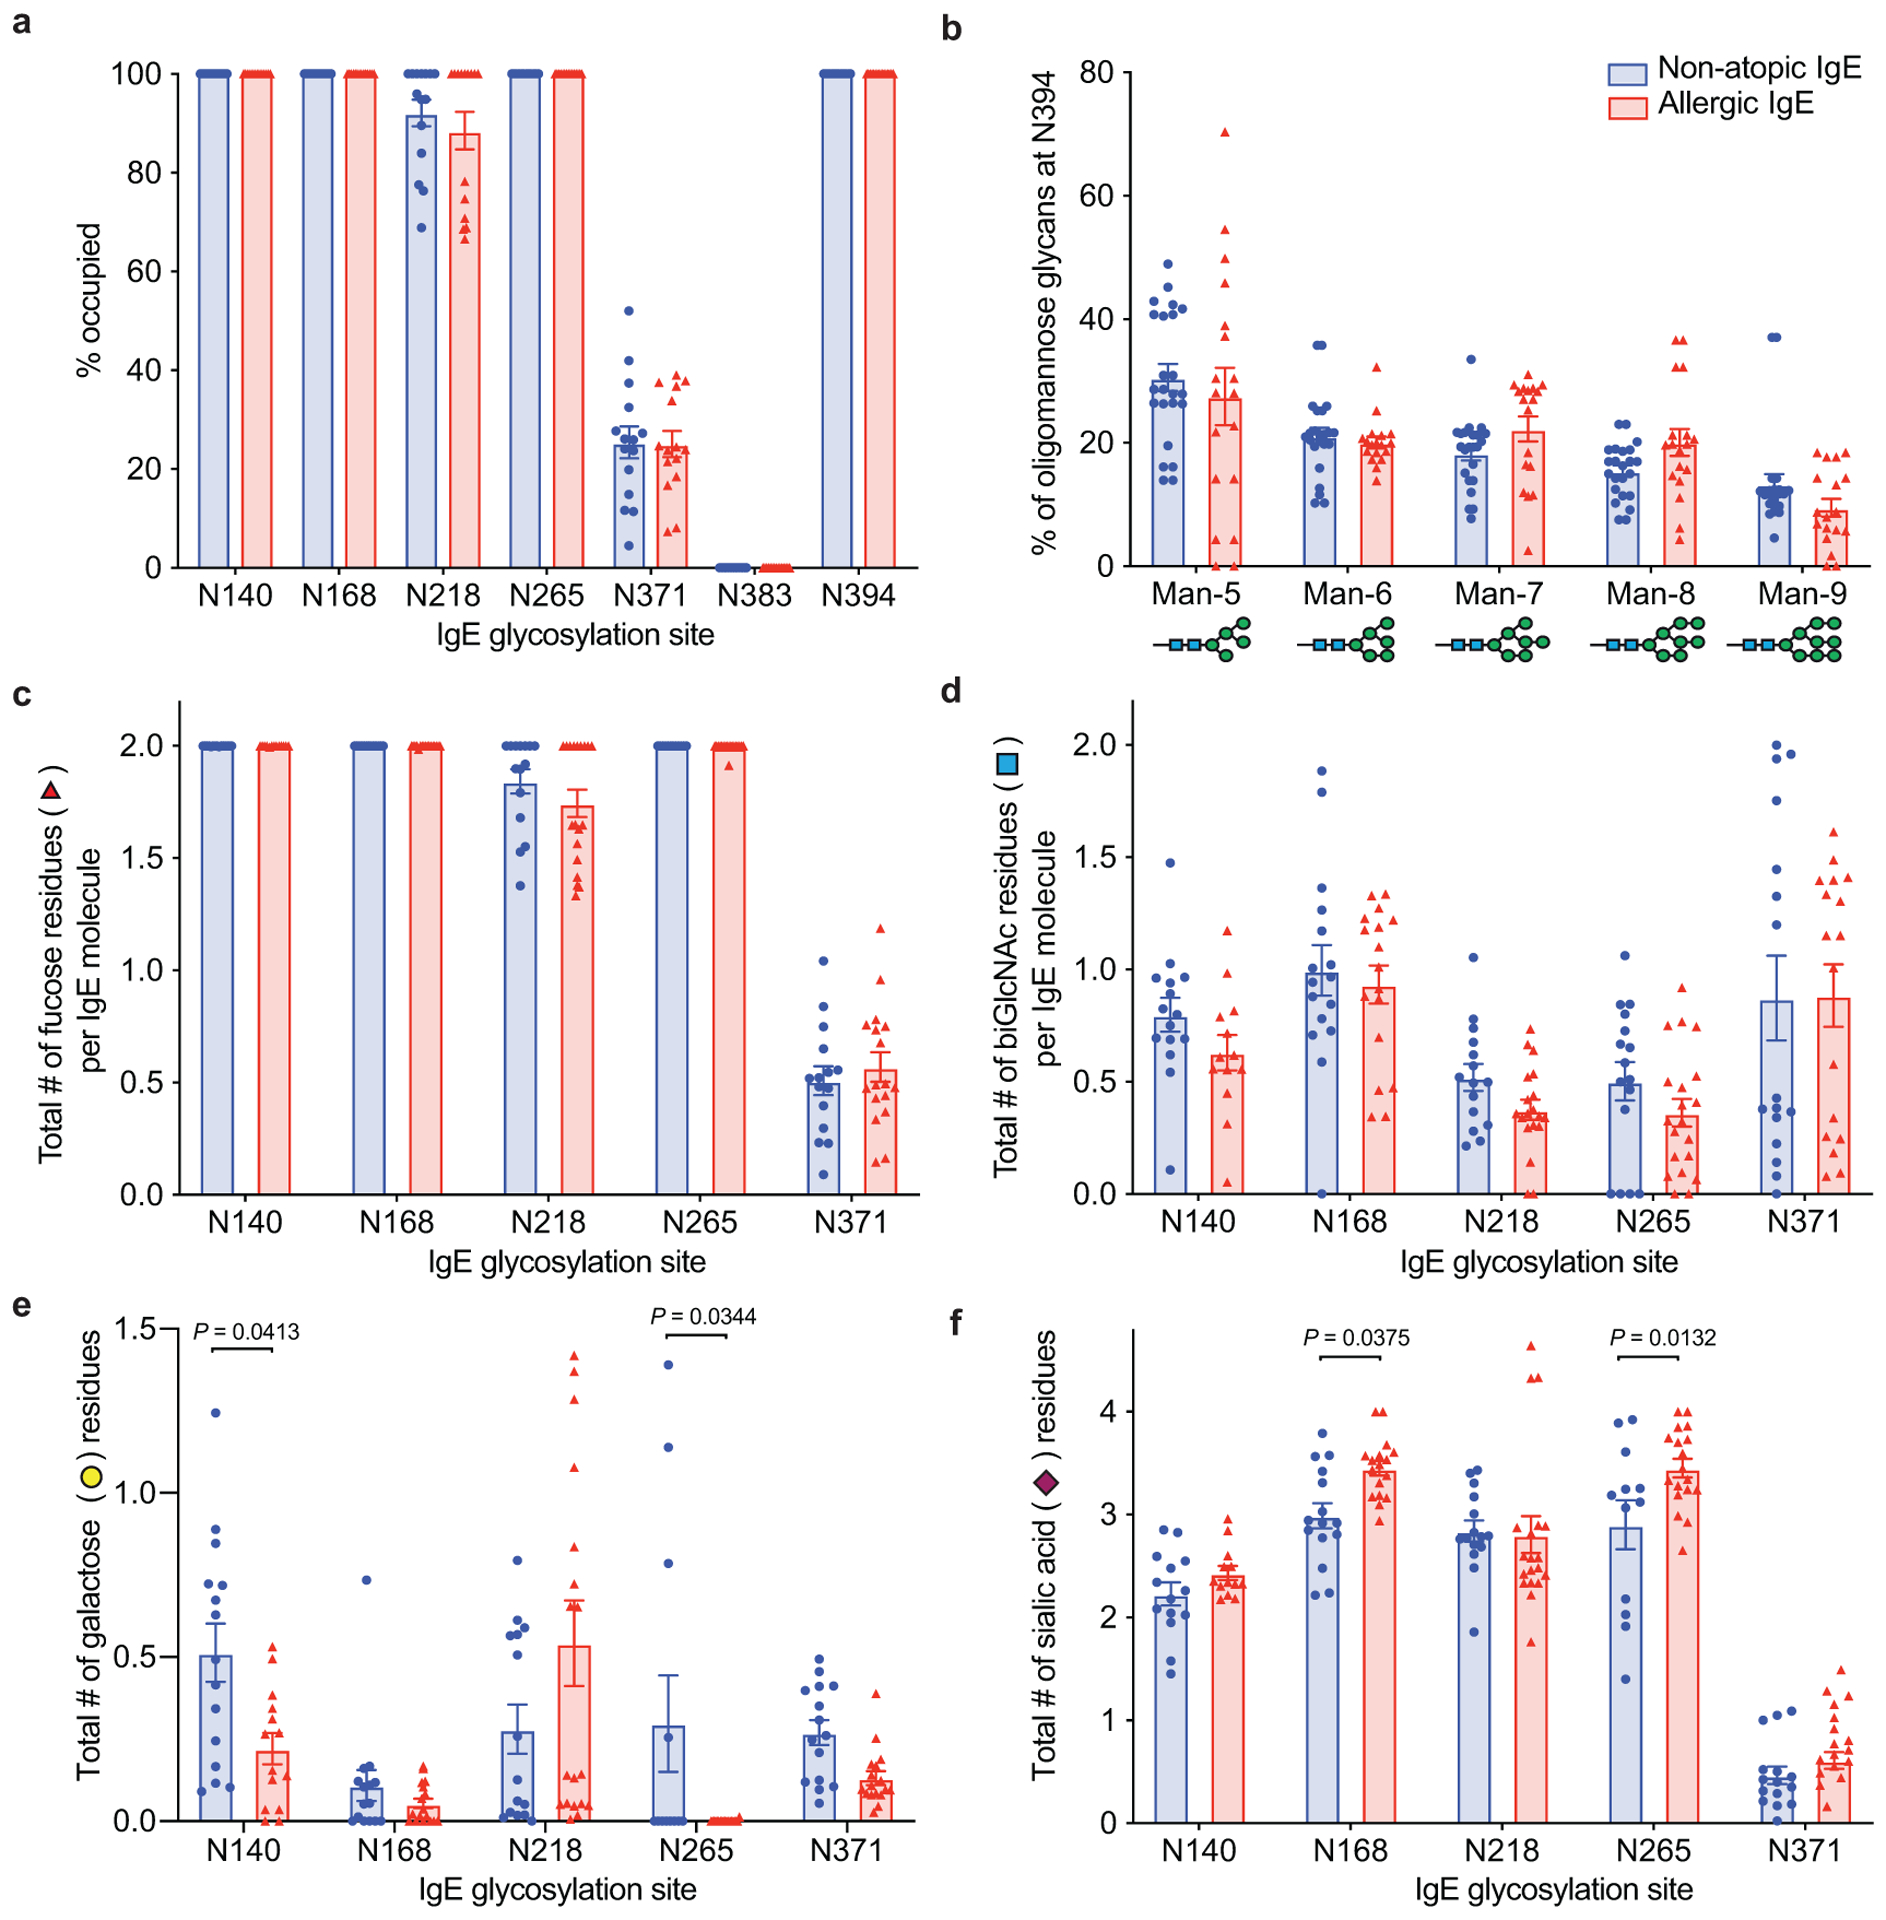
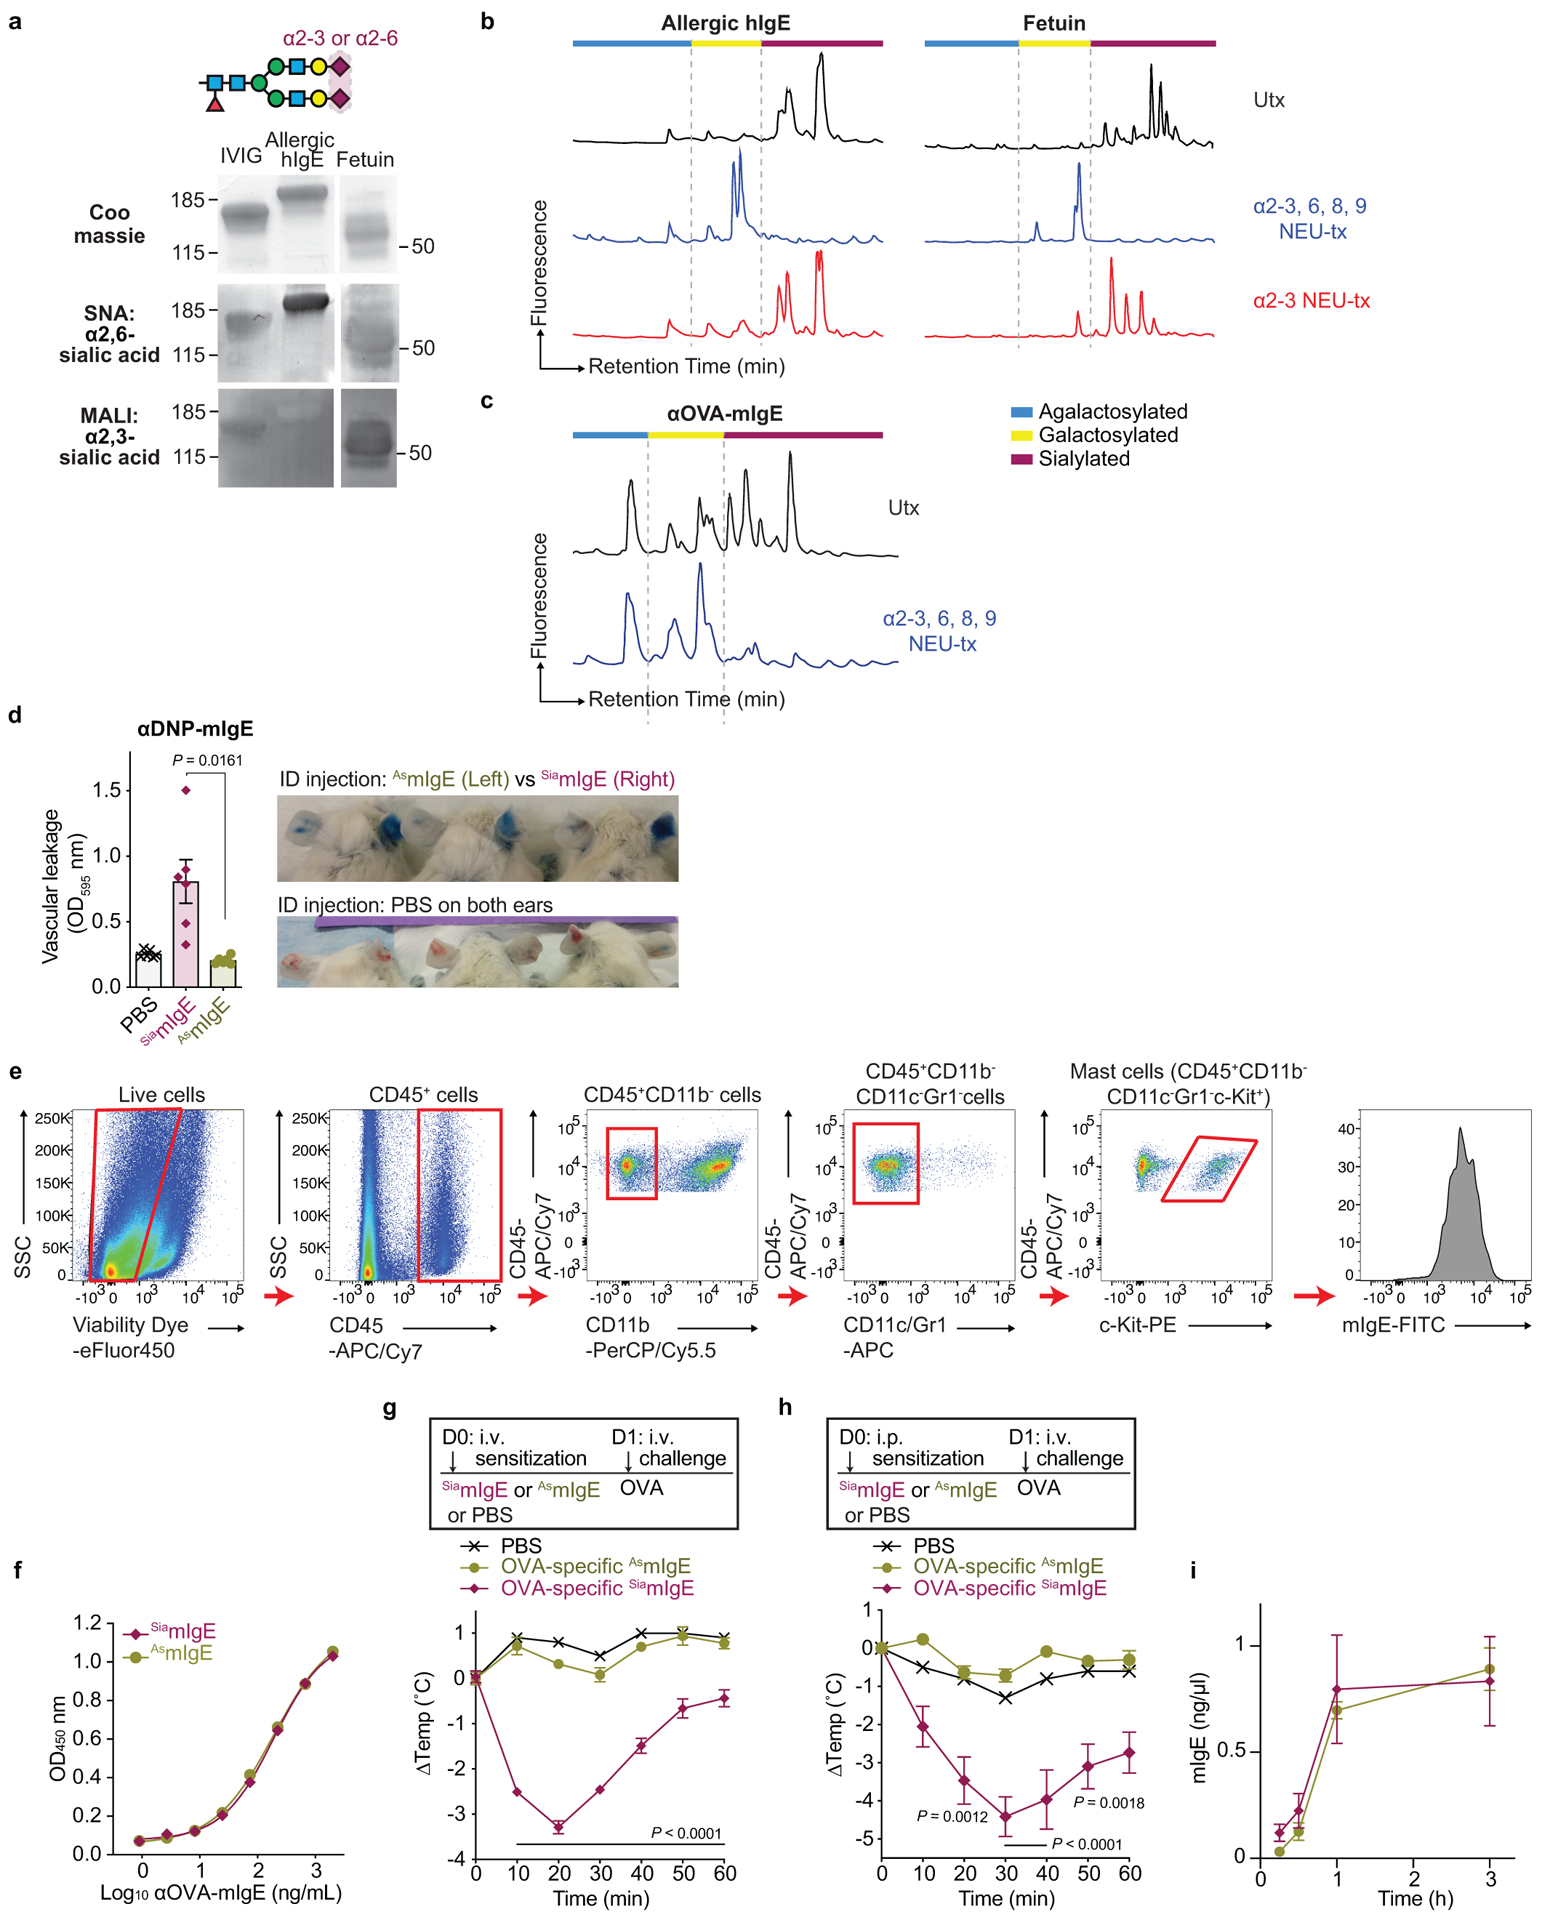
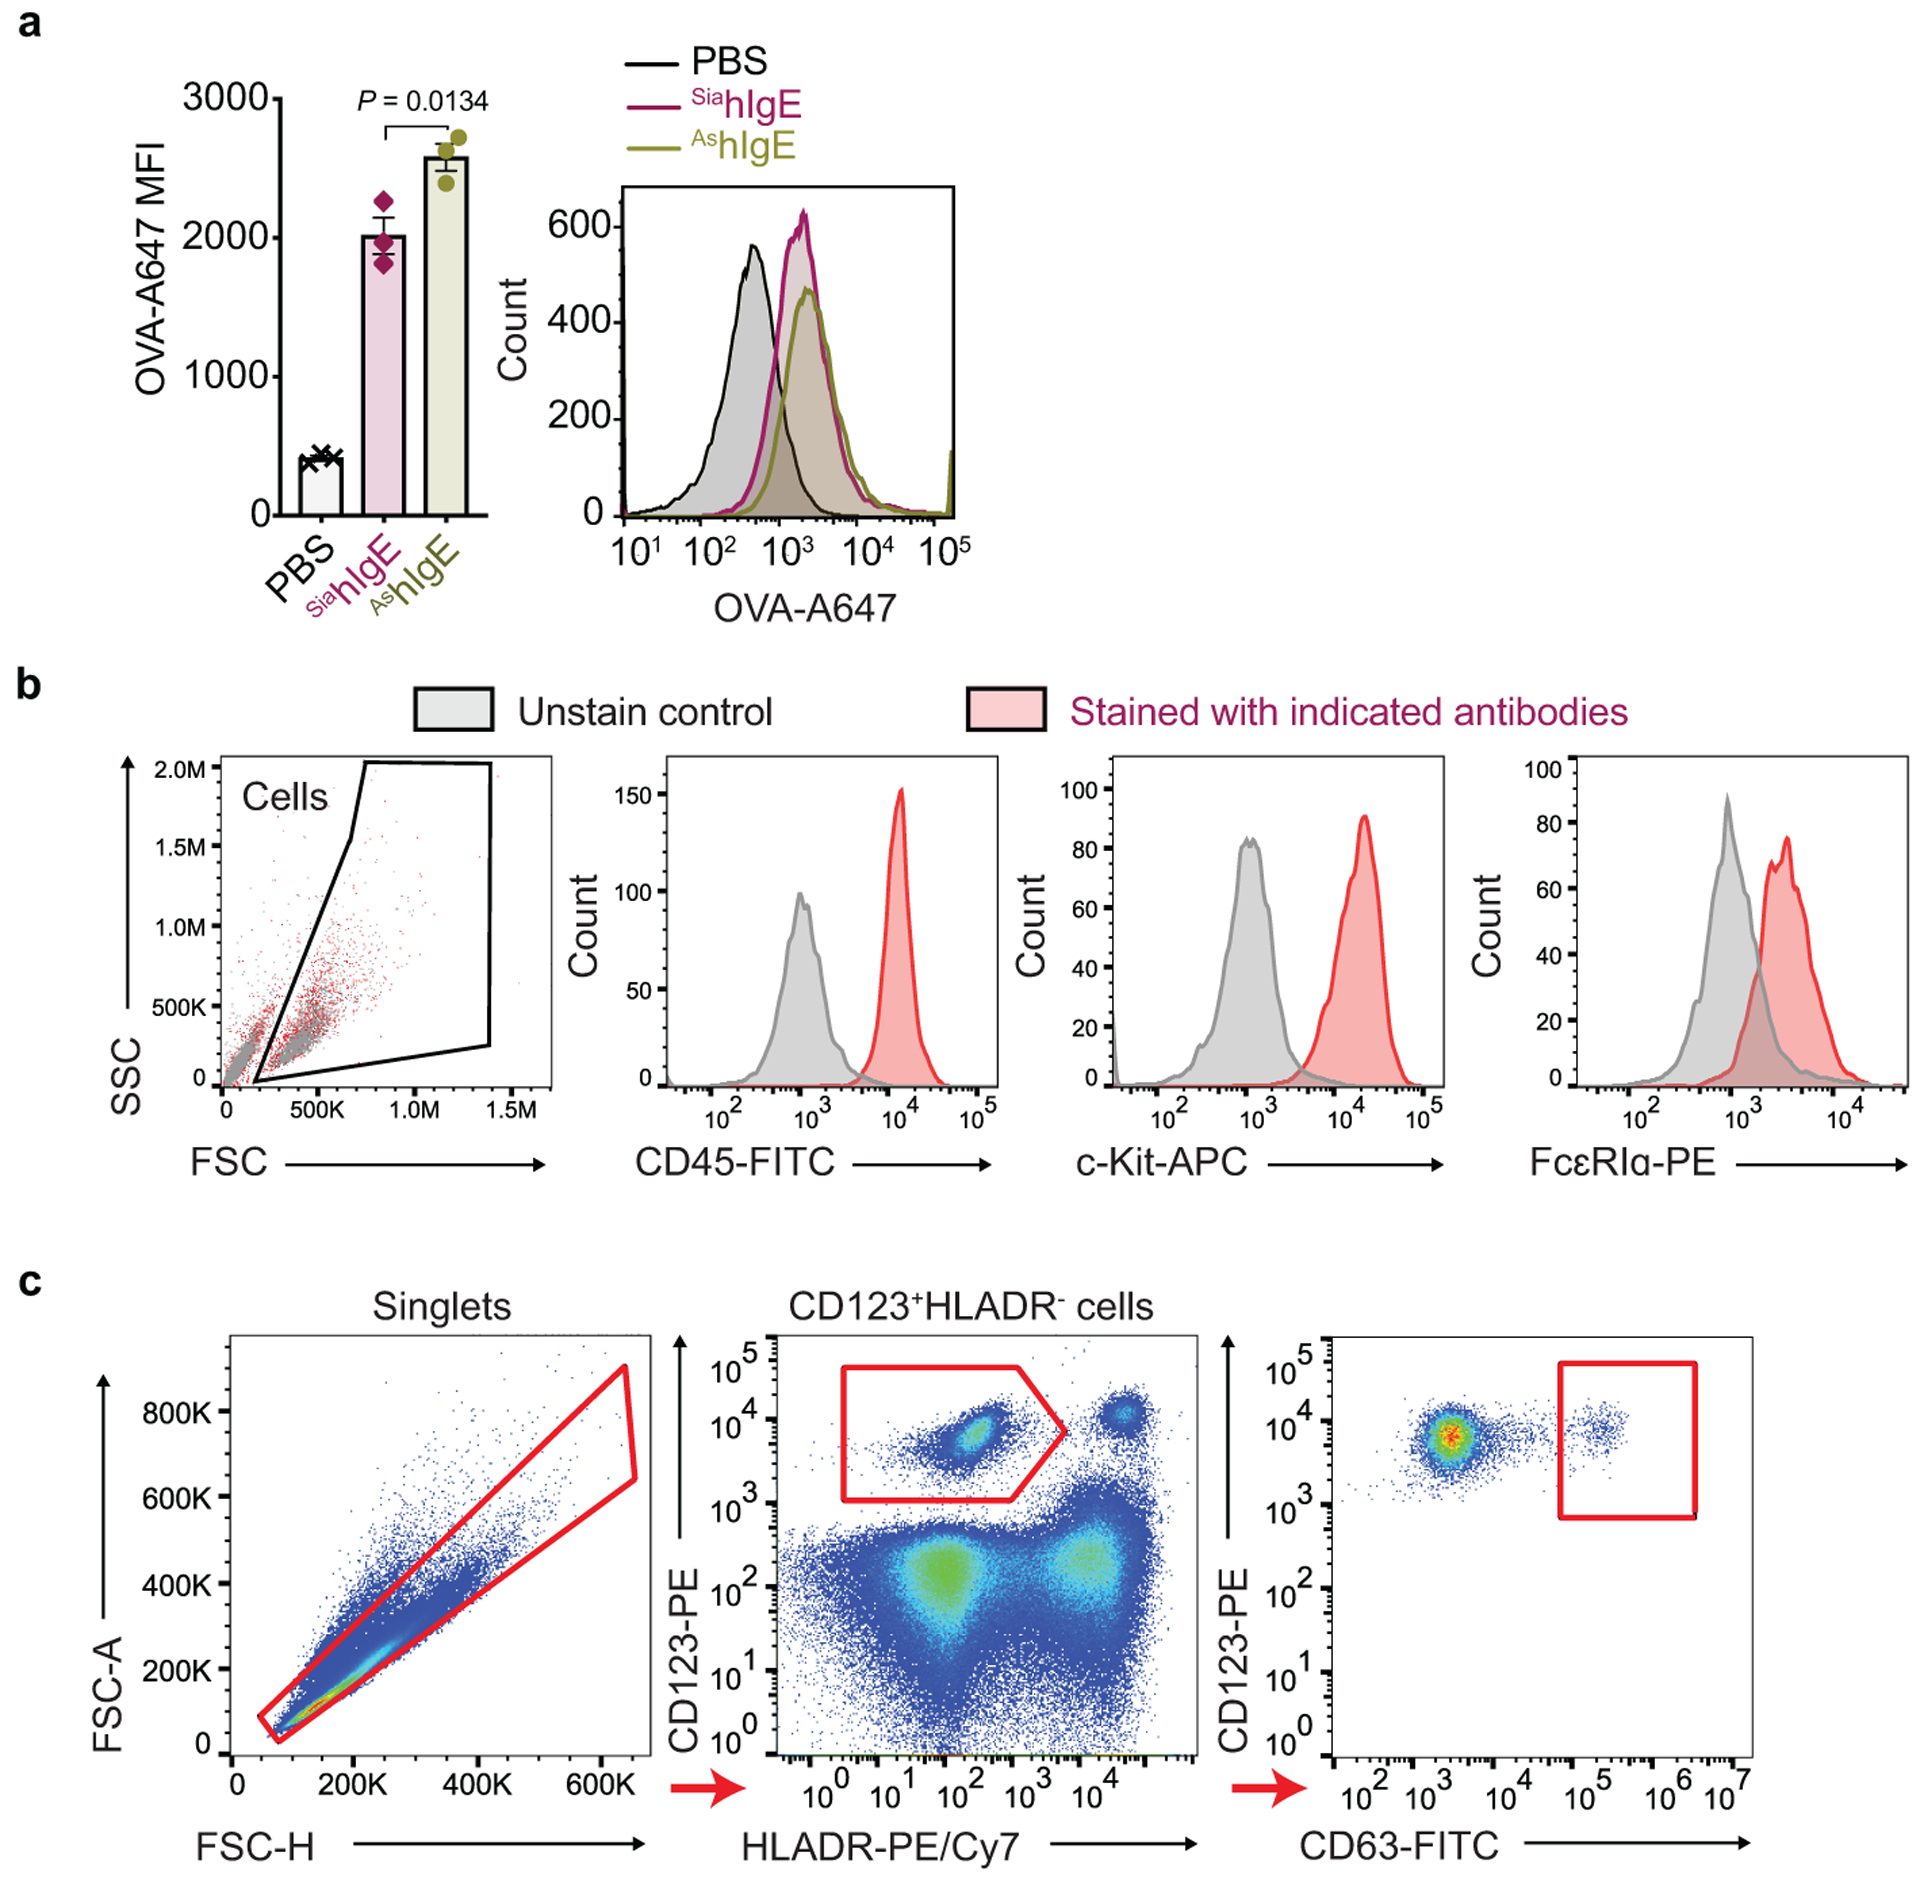
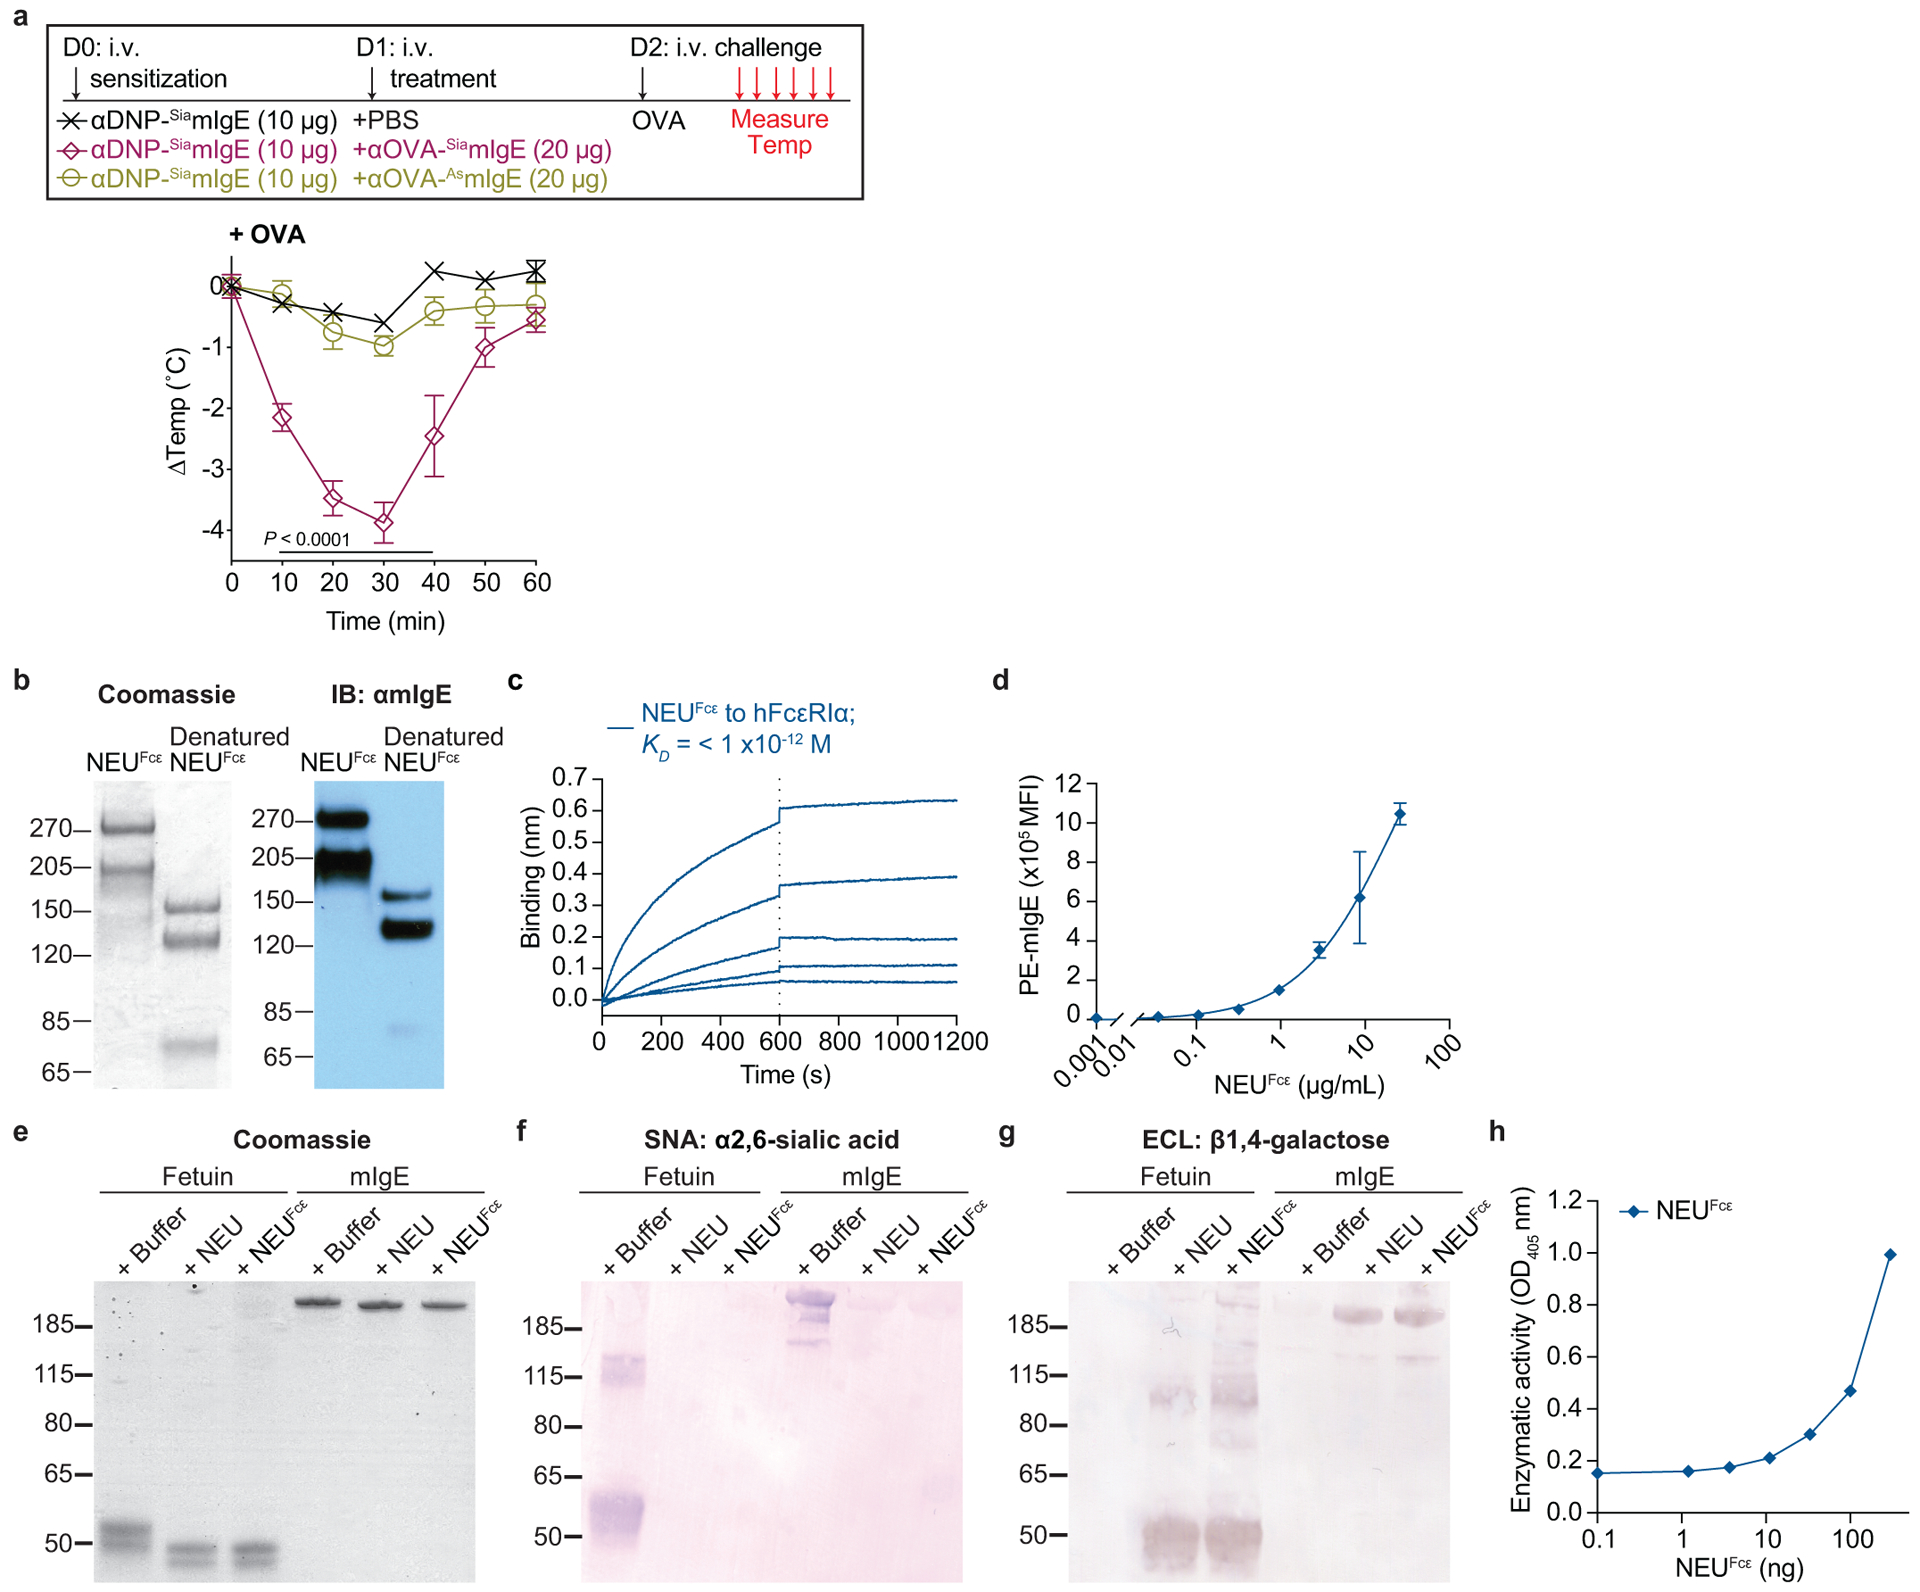
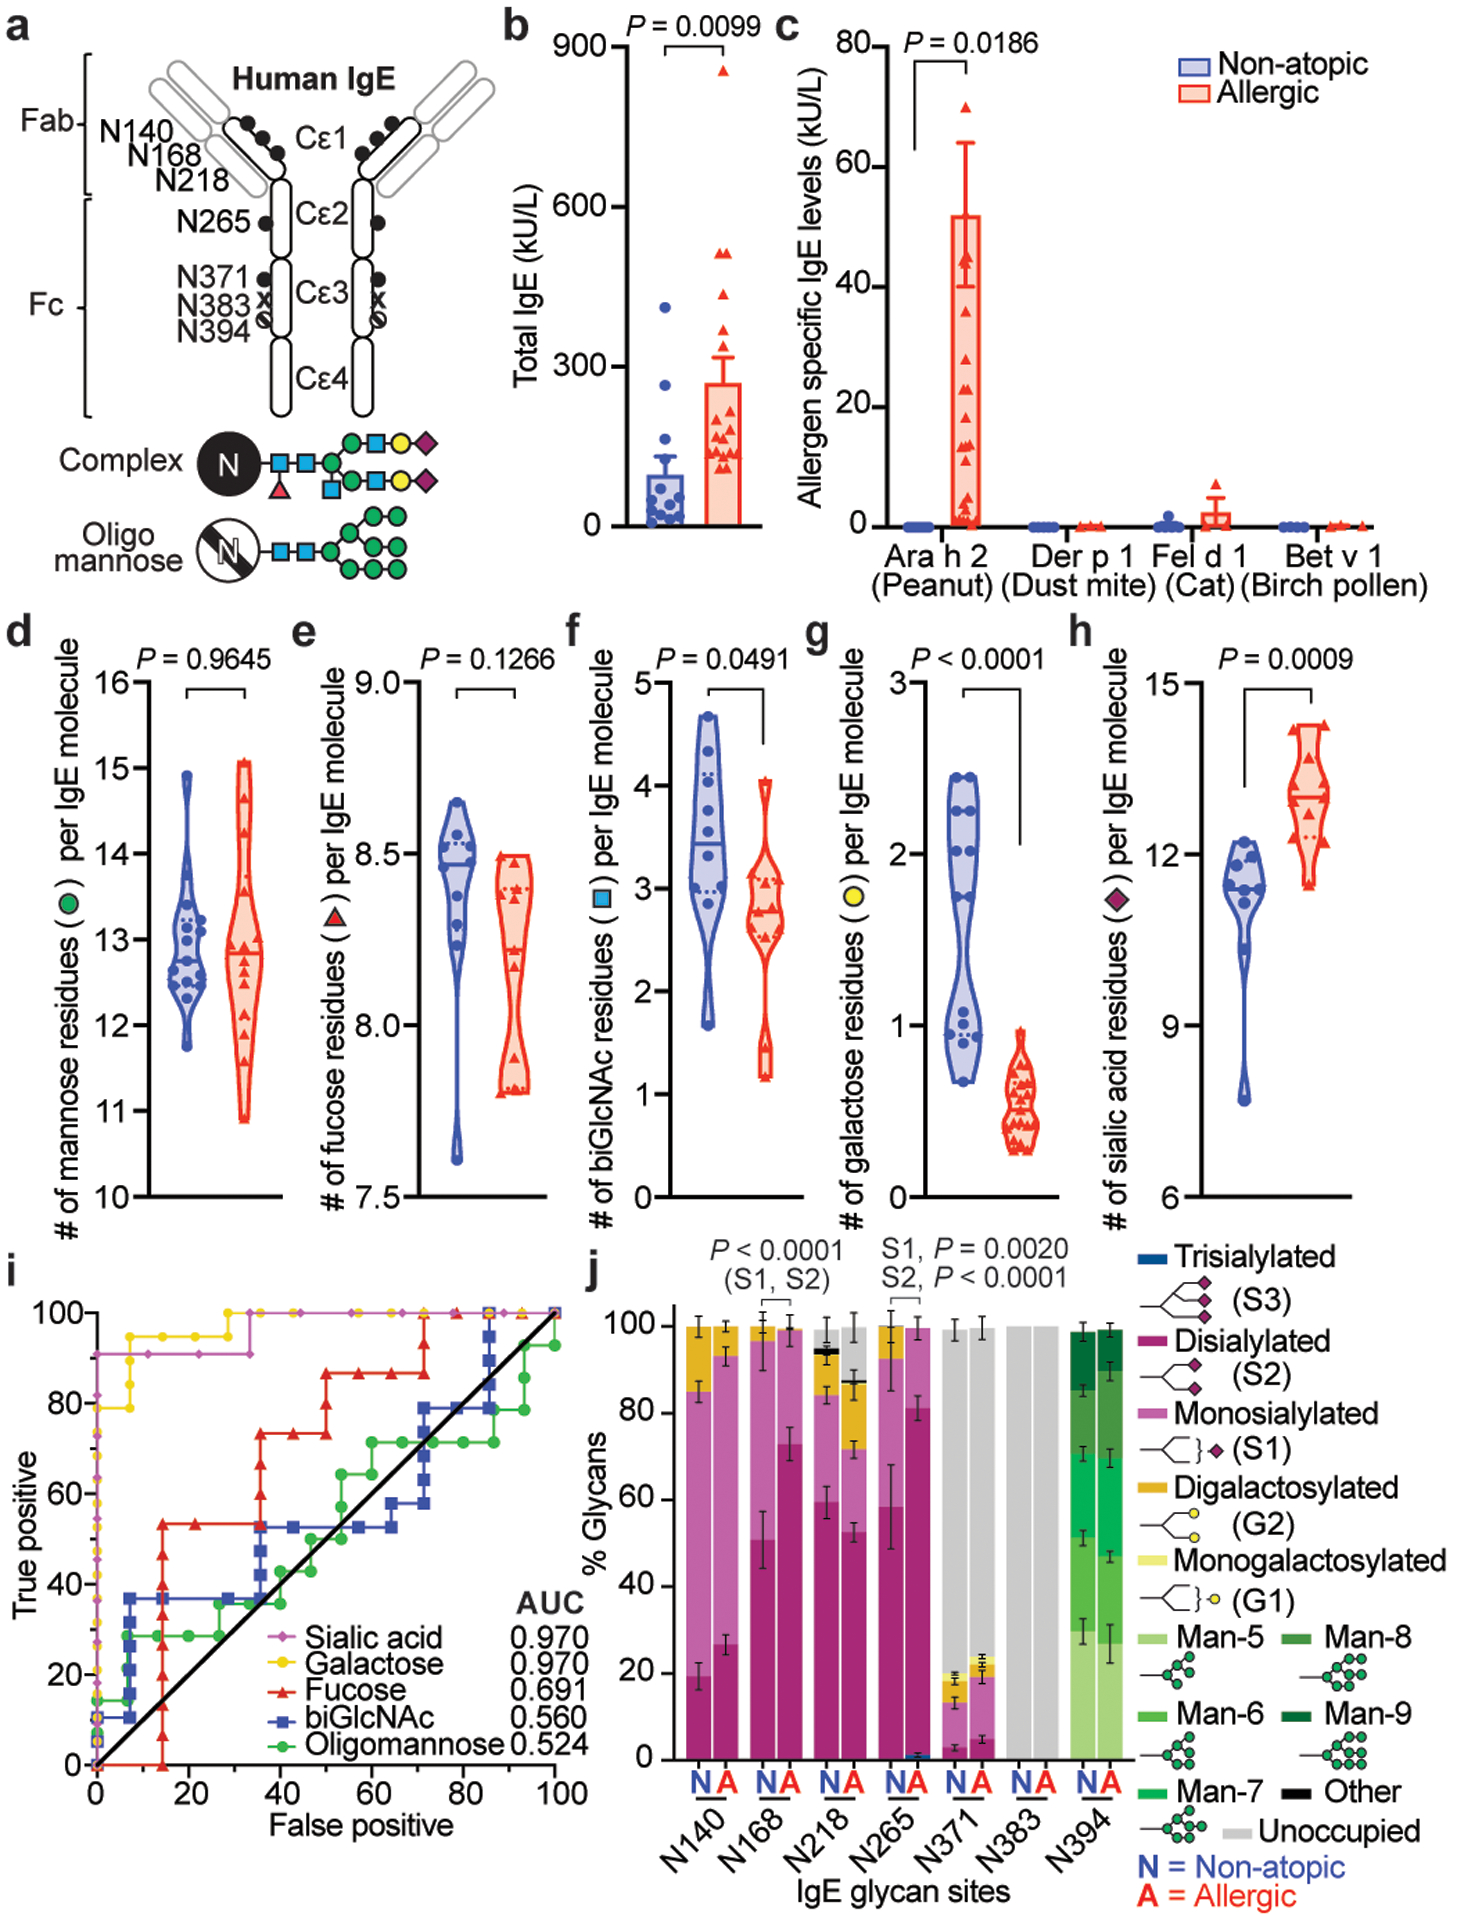
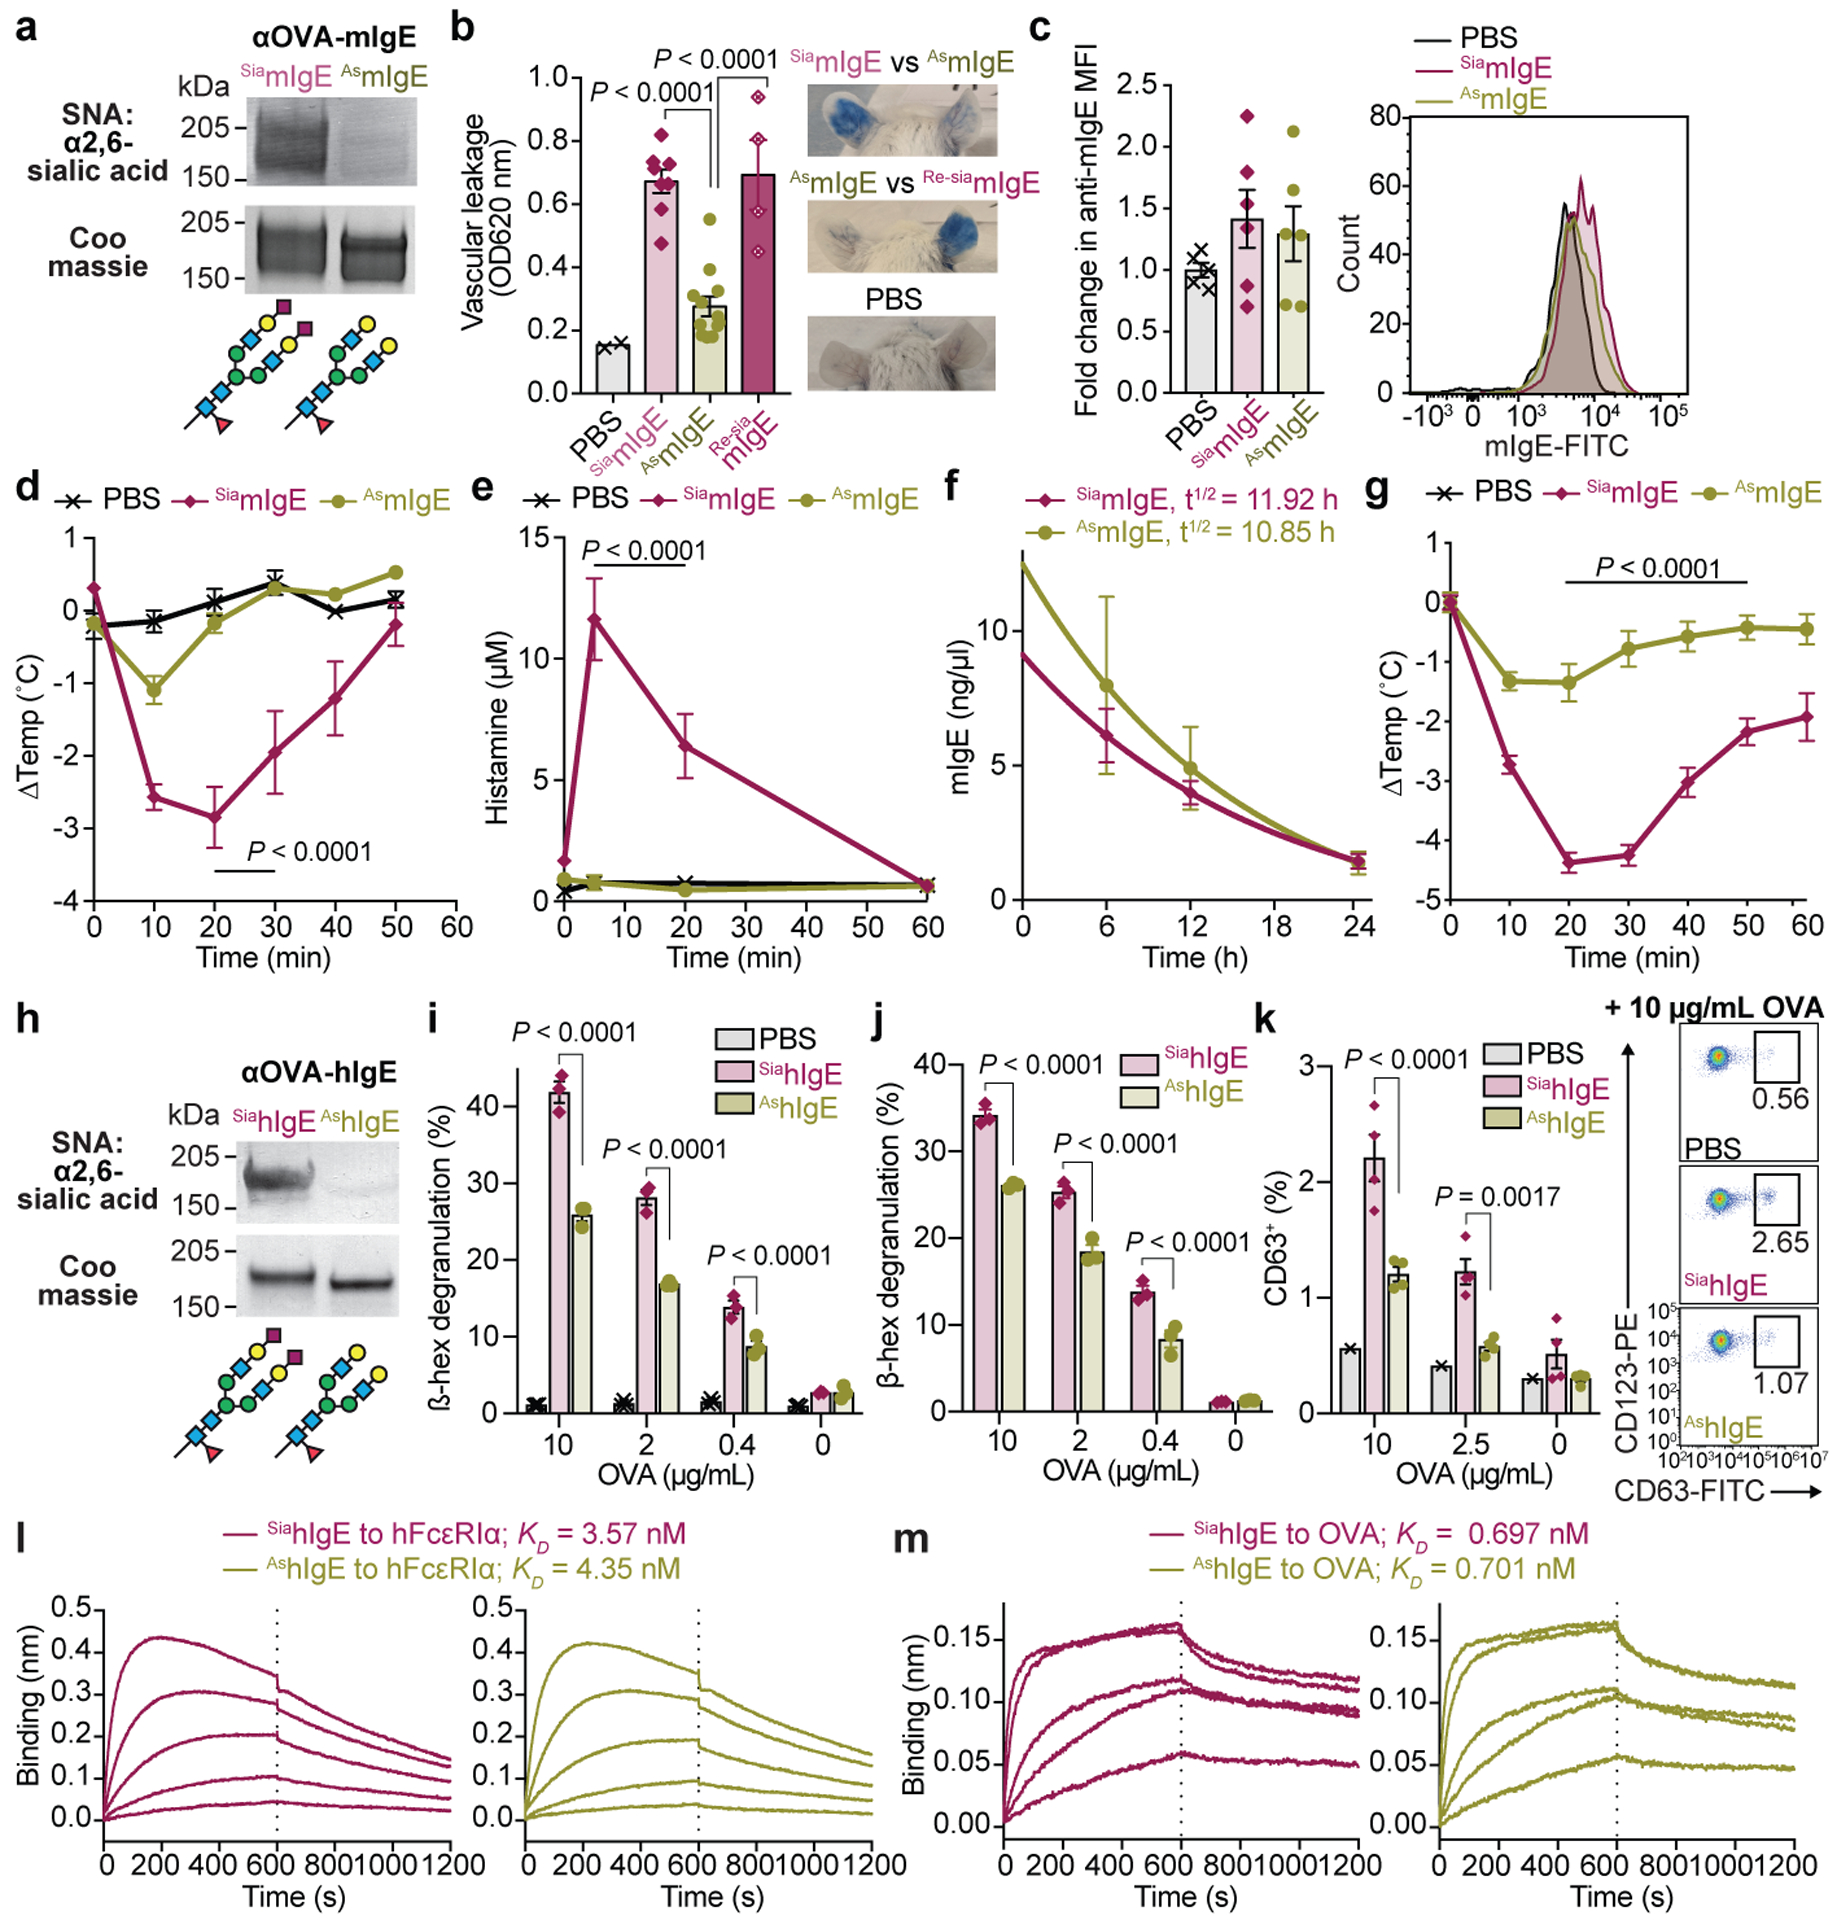
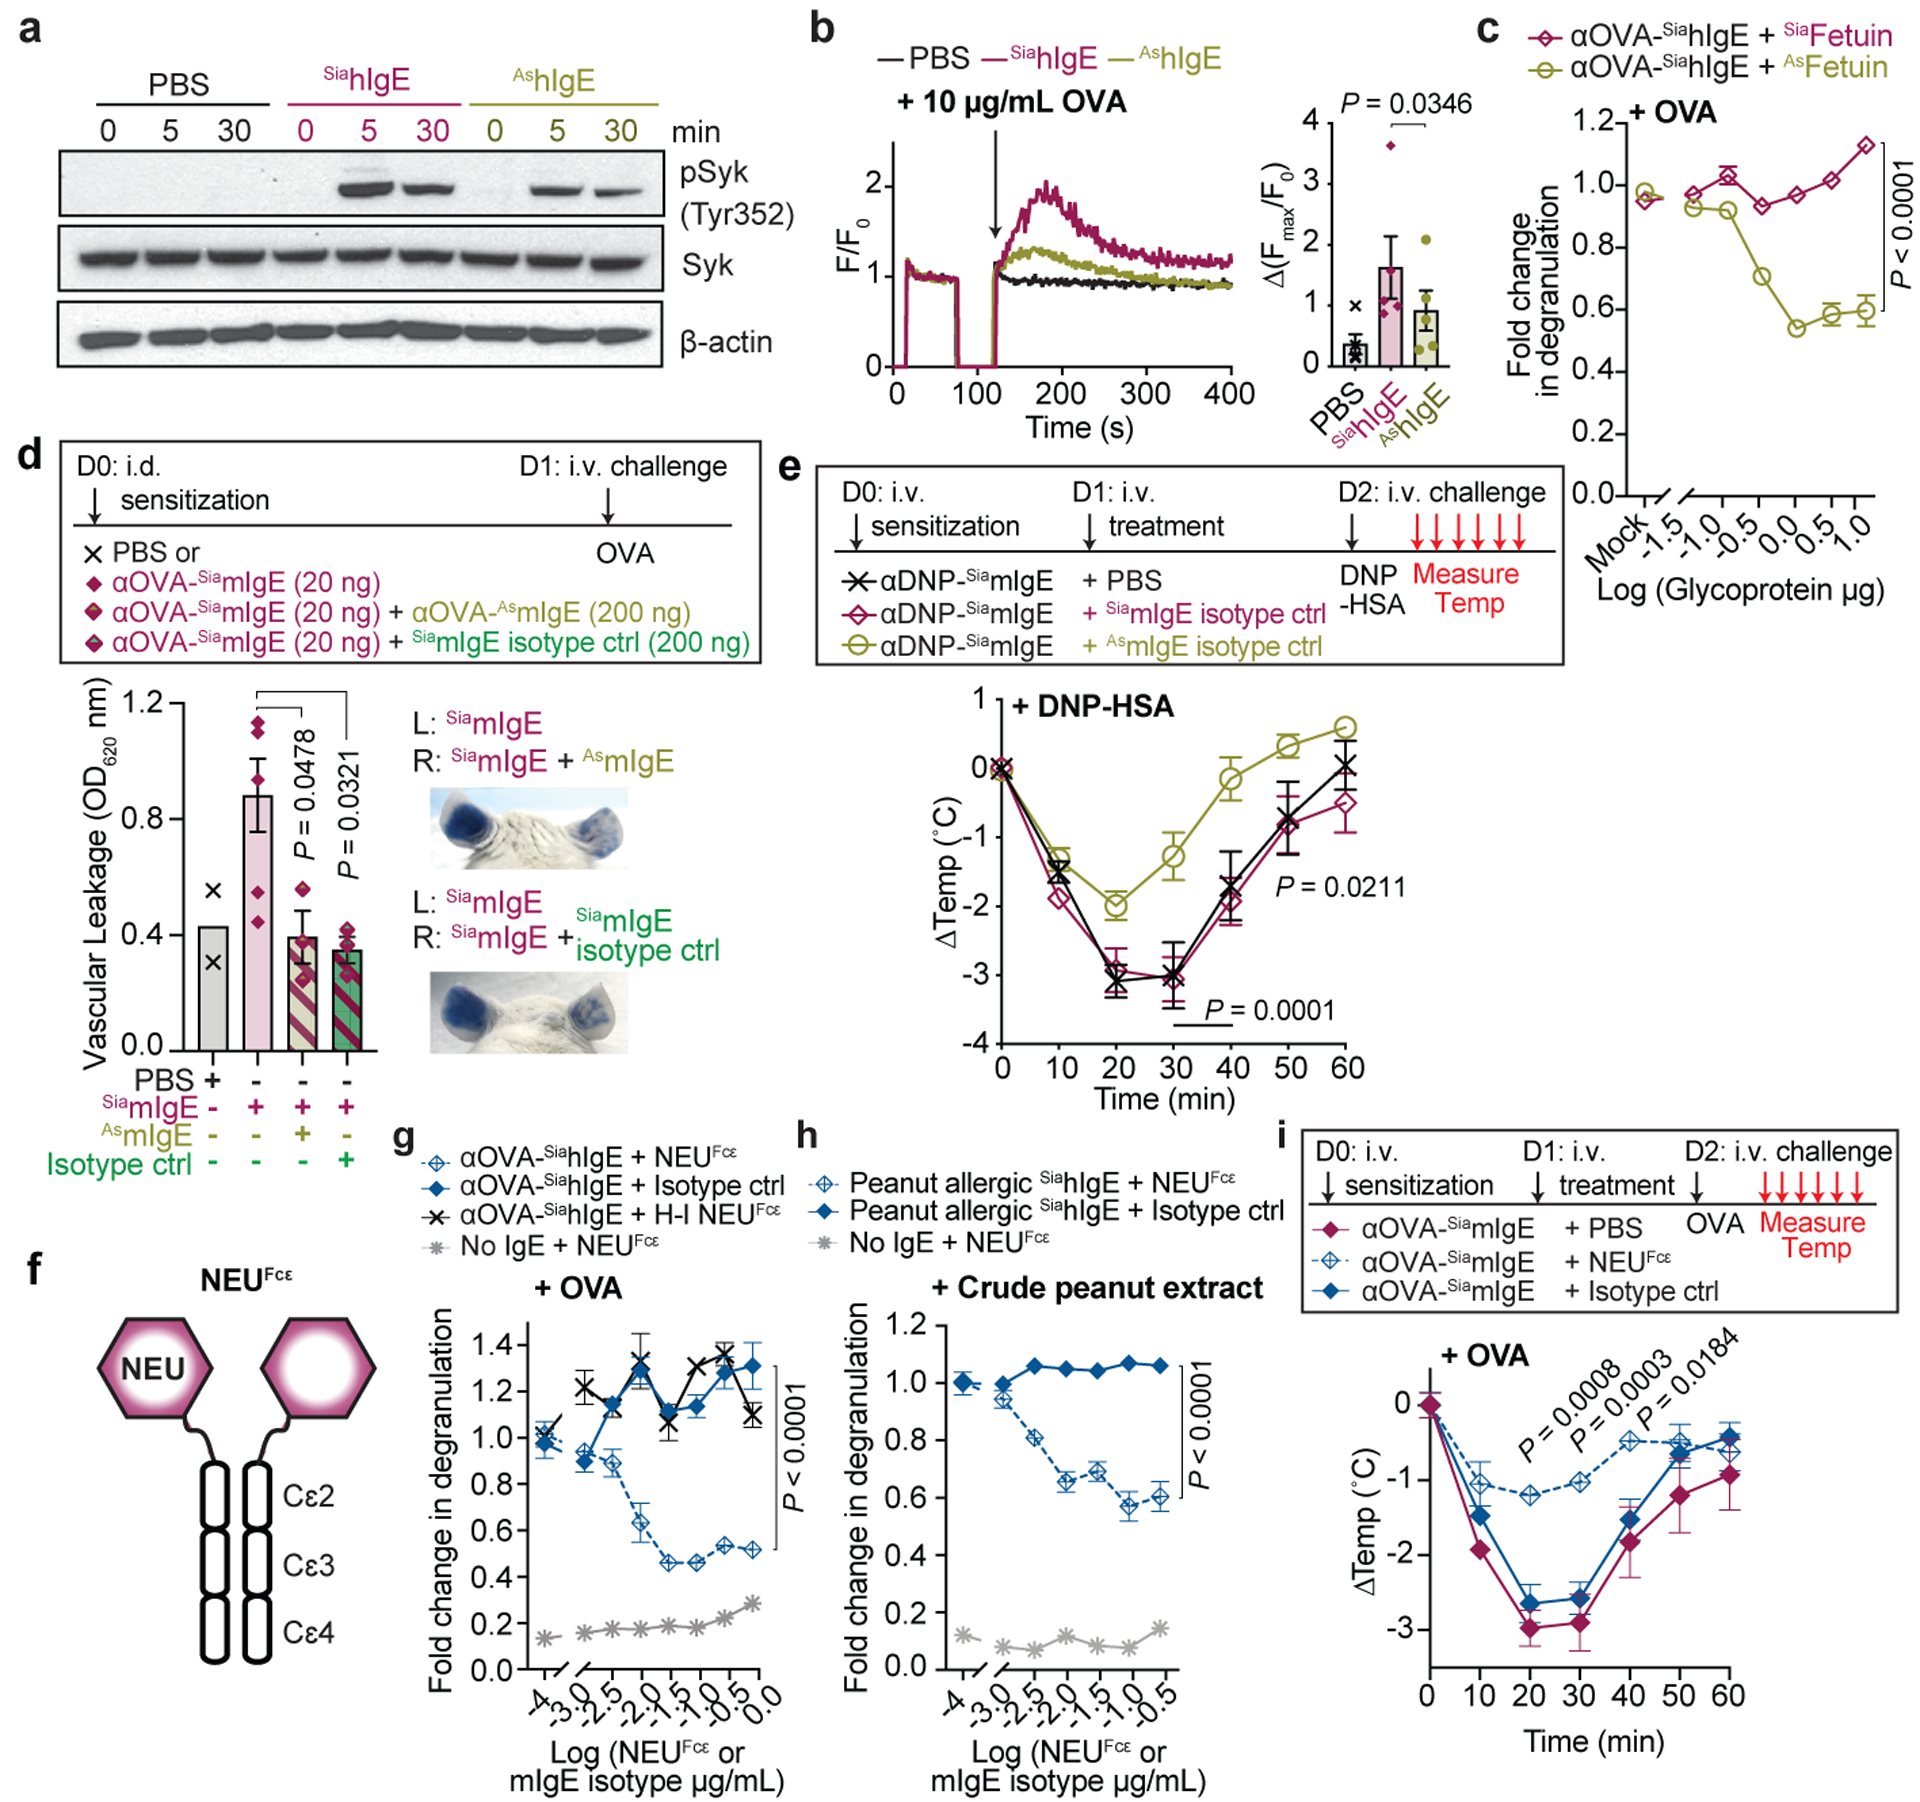
Approximately one-third of the world's population suffers from allergies1. Exposure to allergens crosslinks immunoglobulin E (IgE) antibodies that are bound to mast cells and basophils, triggering the release of inflammatory mediators, including histamine2. Although IgE is absolutely required for allergies, it is not understood why total and allergen-specific IgE concentrations do not reproducibly correlate with allergic disease3-5. It is well-established that glycosylation of IgG dictates its effector function and has disease-specific patterns. However, whether IgE glycans differ in disease states or affect biological activity is completely unknown6. Here we perform an unbiased examination of glycosylation patterns of total IgE from individuals with a peanut allergy and from non-atopic individuals without allergies. Our analysis reveals an increase in sialic acid content on total IgE from individuals with a peanut allergy compared with non-atopic individuals. Removal of sialic acid from IgE attenuates effector-cell degranulation and anaphylaxis in several functional models of allergic disease. Therapeutic interventions-including removing sialic acid from cell-bound IgE with a neuraminidase enzyme targeted towards the IgE receptor FcεRI, and administering asialylated IgE-markedly reduce anaphylaxis. Together, these results establish IgE glycosylation, and specifically sialylation, as an important regulator of allergic disease.


Conflict of interest statement

Competing interests

The authors declare no competing interests.

Figures

Extended Data Fig. 1 |
Extended Data Fig. 1 |. Characterization of non-atopic and allergic human IgE.
a, Allergen-specific IgE levels for Ara h 2 (peanut: non-atopic n = 11, allergic n = 30), Der p 1 (dust mite: n = 5, 3), Fel d 1 (cat: n = 5, 3), and Bet v 1 (birch pollen: n = 4, 3). b, Strategy for enriching IgE from human sera. c, Quantified degranulation of human LAD2 mast cells sensitized with PBS, non-atopic, or allergic IgE and stimulated by anti-human IgE (PBS n = 1, non-atopic n = 4, allergic n = 4). d, Quantified MFI (left) and representative histograms (right) of anti-hIgE FACS staining on human LAD2 mast cells sensitized with PBS, non-atopic, or allergic hIgE (PBS n = 3, non-atopic n = 4, allergic n = 3). e, Anti-hIgE from Extended Fig. 1c, d, binds similarly to SiahIgE and AshIgE as determined by hIgE ELISA assays. n = 2 technical replicates per group and are representative of three experiments. f, g, IgE glycan distribution by sex (f; n = 9 males, n = 12 females) and age (g; 0–9 (n = 2), 10–19 (n = 2), 20–29 (n = 6), 30–39 (n = 7), 40–49 (n = 1), 50–59 (n = 2), 60–69 (n = 1)). h, Representative structures of complex N-glycans in Fig. 1j. Data are mean ± s.e.m. (a, c, d, f, g). P values were determined by two-tailed unpaired t-test (d, f) or two-way ANOVA with Sidak’s multiple comparison test (a, c, g). n represents biologically independent serum samples (a, c, d, f, g).
Extended Data Fig. 2 |
Extended Data Fig. 2 |. N-linked glycans observed on native human IgE.
a, Representative MS/MS spectrum for N265 A2F glycopeptide showing B and Y ions from glycosidic bond cleavage as well as B ions from peptide bond cleavage. The Y1 ion used for quantification of glycopeptides is circled (n = 18 biologically independent samples). b, Extracted ion chromatograms for IgE N265 sialylation variants from an allergic patient and non-allergic donor. c, Extracted ion chromatograms for IgE N168 sialylation variants from an allergic patient and non-allergic donor.
Extended Data Fig. 3 |
Extended Data Fig. 3 |. N-linked glycans observed on IgE myeloma standard.
a,b, Extracted ion chromatograms for site-specific N-glycosylation from chymotryptic (a) or tryptic (b) digest of the IgE myeloma sample used as a standard.
Extended Data Fig. 4 |
Extended Data Fig. 4 |. Site-specific characterization of resolved IgE glycans from non-atopic and allergic individuals.
a, Occupancy of N-linked glycosylation sites; N140 (non-atopic n = 15, allergic n = 13), N168 (n = 16, 14), N218 (n = 15, 15), N265 (n = 12, 15), N371 (n = 15, 15), N383 (n = 16, 15), N394 (n = 13, 16). b, Percentage of oligomannose moieties at N394 (n = 23, 18). c, Number of fucose residues; N140 (n = 15, 13), N168 (n = 15, 17), N218 (n = 15, 19), N265 (n = 12, 18), N371 (n = 15, 17). d, Number of biGlcNAc residues; N140 (n = 15, 13), N168 (n = 16, 17), N218 (n = 15, 19), N265 (n = 16, 20), N371 (n = 16, 17). e, Number of galactose residues; N140 (n = 15, 14), N168 (n = 15, 17), N218 (n = 15, 19), N265 (n = 12, 19), N371 (n = 15, 17). f, Number of sialic acid residues; N140 (n = 14, 13), N168 (n = 15, 13), N218 (n = 15, 17), N265 (n = 12, 19), N371 (n = 15, 17). Data plotted are mean ± s.e.m. P values determined by two-way ANOVA with Sidak’s multiple comparison test. n represents biologically independent serum samples (a-f).
Extended Data Fig. 5 |
Extended Data Fig. 5 |. IgE sialic acid removal.
a, Protein gel stain and lectin blots of IVIG, native human IgE purified from allergic patients, and fetuin. b, HPLC glycan traces of undigested, or allergic human IgE or fetuin digested with sialidase from Arthrobacter ureafaciens for releasing α2,3-, α2,6-, α2,8- and α2,9-linked sialic acids or sialidase from Streptococcus pneumoniae for releasing α2,3-linked sialic acids. c, HPLC glycan traces of undigested or recombinant OVA-specific mIgE digested with sialidase from Arthrobacter ureafaciens. d, Quantitation of vascular leakage by Evan’s blue dye (left, n = 6 mouse ears per group) and representative ear images (right) after PCA in mice sensitized with PBS, or SiamIgE and AsmIgE specific for DNP. e, Gating strategy for IgE loading on mouse skin ear mast cells. Representative FACS plots used to identify mast cells in mouse ears and determine IgE levels on mouse ear mast cells. SSC, side scatter. f, Binding of OVA-specific SiamIgE and AsmIgE to OVA as determined by ELISA. n = 2 technical replicates per group and are representative of three biologically independent experiments. g, h, OVA-elicited systemic anaphylaxis as measured by temperature drop in mice sensitized with PBS, OVA-specific SiamIgE (n = 4 for g and 6 for h) or AsmIgE (n = 5 for g and 6 for h) by intravenous (g) or intraperitoneal (h) injection. i, Serum levels of DNP-specific SiamIgE (n = 4) and AsmIgE (n = 3) in mice at defined times after systemically administration as determined by ELISA. Data are mean ± s.e.m. and are representative of three experiments. P values determined by two-tailed paired t-test (d), or two-way ANOVA with Tukey’s multiple comparison test (g, h).
Extended Data Fig. 6 |
Extended Data Fig. 6 |. FACS analysis of human LAD2 mast cell loading of SiahIgE and AshIgE, phenotypic staining of PBMC-derived mast cells, and activation in primary basophils.
a, MFI (left) and representative histogram (right) of surface-bound hIgE on LAD2 mast cells following sensitization with PBS, OVA-specific SiahIgE or AshIgE (n = 3 technical replicates per group). Data are mean ± s.e.m. and are representative of three independent experiments. One-way ANOVA with Tukey’s multiple comparison test. b, Representative phenotypic staining by FACS of primary human mast cells from peripheral blood-derived CD34+ pluripotent hematopoietic cells (n = 2 technical replicates per group). c, Gating strategy for basophil activation assay. Representative FACS plots used to determine basophil activation from PBMC.
Extended Data Fig. 7 |
Extended Data Fig. 7 |. PSA for IgE isotype controls and characterization of NEUFcε.
a, Temperature change following OVA-induced PSA in mice receiving DNP-specific SiamIgE on day 0 and PBS, OVA-specific SiamIgE, or OVA-specific AsmIgE isotype controls from Fig. 3e on day 1. n = 4 mice for all groups. Two-way ANOVA with Tukey’s multiple comparison test. b, Protein gel stain (left) and immunoblot for mIgE (right) of native and denatured NEUFcε. c, Binding kinetics of analyte NEUFcε to ligand hFcεRIα on biosensor. Analytes kinetics were performed with 3-fold serial dilution of analyte from 26.2 to 0.32 nM. d, MFI of surface-bound NEUFcε on LAD2 mast cells following 30 min sensitization at 37°C by FACS analysis (n = 3 technical replicates per group and are representative from two independent experiments). e-h, Neuraminidase activity of NEUFcε determined by digestion of mIgE or fetuin overnight (e-g) and detection of protein loading by coomassie (e), terminal α2,6-sialic acid by SNA (f), and terminal galactose by ECL (g) or by the amount of substrate 2-O-(p-Nitrophenyl)-α-D-N-acetylneuraminic acid digested by NEUFcε in a colorimetric assay (h, n = 3 technical replicates per group and are representative from two independent experiments). Data are mean ± s.e.m.
Fig. 1 |
Fig. 1 |. Glycan composition of non-atopic and allergic IgE.
a, Human IgE N-linked glycosylation sites: complex biantennary glycans closed circles, oligomannose hatched circles, unoccupied X; blue squares, GlcNAc; green circles, mannose; red triangle, fucose; yellow circles, galactose; maroon diamonds, sialic acid. b, c, Total IgE titers (b) and allergen-specific IgE levels (c) in non-atopic (blue, n = 17) and allergic (red, n = 13) subjects. d-h, gMS quantified glycan moieties per IgE molecule in non-atopic (blue) and peanut allergic (red) individuals; mannose (d, non-atopic n = 15, allergic n = 14), fucose (e, non-atopic n = 10, allergic n = 11), biGlcNAc (f, non-atopic n = 10, allergic n = 11), galactose (g, non-atopic n = 14, allergic n = 19), and sialic acid (h, non-atopic n = 9, allergic n = 11). i, ROC for total IgE glycan moieties isolated from allergic versus non-atopic subjects. Sialic acid (non-atopic n = 9, allergic n = 11); galactose (non-atopic n = 14, allergic n = 19); fucose (non-atopic n = 14, allergic n = 15); biGlcNAc (non-atopic n = 14, allergic n = 19); oligomannose (non-atopic n = 15, allergic n = 14). j, gMS analysis of site-specific N-glycan structures on total IgE from non-atopic (N; N140 n = 11, N168 n = 13, N218 n = 11, N265, N371, N394 n = 12) and allergic (A; N140 n = 11, N168 n = 15, N218 n = 17, N265 n = 18, N371 n = 14, N394 n = 12) individuals. Representative glycan structures per group are detailed in Extended Data Fig. 1h. Data are mean ± s.e.m. (b, c, j), median (solid line) and interquartile range (dotted line) (d-h); two-tailed unpaired t-test (b, d-h), two-way ANOVA with Sidak’s (c) or Tukey’s multiple comparison test (j).
Fig. 2 |
Fig. 2 |. Sialic acid removal attenuates IgE.
a, SNA lectin blot and Coomassie-stained gel of OVA-specific SiamIgE and AsmIgE. b, Left, quantification of ear blue coloration and right, representative ear images following OVA-induced PCA by PBS, OVA-specific SiamIgE, AsmIgE, or Re-SiamIgE (n = 2, 8, 12, 4 mouse ears respectively). c, Left, mean fluorescence intensity (MFI) and right, representative histograms of anti-mIgE determined by FACS on dermal mouse ears mast cells following sensitization by PBS, OVA-specific SiamIgE, or AsmIgE (n = 5, 6, 6 mouse ears, respectively from two independent experiments). d, e, Temperature change (d) and serum histamine (e) following DNP-induced PSA in mice sensitized with PBS, DNP-specific SiamIgE, or AsmIgE (n = 3, 5, 5 mice respectively). f, Serum levels of DNP-specific SiamIgE (n = 4 mice) or AsmIgE (n = 5 mice) after intraperitoneal administration. g, Temperature change following PFA elicited by oral TNP-OVA administration in mice sensitized with PBS, TNP-specific SiamIgE, or AsmIgE (n = 2, 4, 4 respectively). h, SNA lectin blot and Coomassie-stained gel of OVA-specific SiahIgE and AshIgE. i-k, OVA-induced degranulation in LAD2 mast cells (i), peripheral blood mononuclear cell-derived human mast cells (j), or basophils (k) sensitized with PBS (for i (n = 3), k (n = 1)), OVA-specific SiahIgE or AshIgE (for i, n = 3; j, n = 3; k, n = 4). n = technical replicates and are representative of three biologically independent experiments. l, m, Binding kinetics of OVA-specific SiahIgE or AshIgE to hFcεRIα (l) or OVA (m). Data are mean ± s.e.m. (b-g, i-k) and are representative of two (f) or three independent experiments (a, b, d, e, g-m). One-way ANOVA with Tukey’s (b), or two-way ANOVA with Tukey’s (d, e, i, k) or Sidak’s (g, j) multiple comparison test. For gel source data, see Supplementary Figure 1.
Fig. 3 |
Fig. 3 |. Modulating IgE sialylation and anaphylaxis.
a, Immunoblots of pSyk, total Syk, and β-actin in LAD2 mast cells sensitized with PBS, OVA-specific SiahIgE or AshIgE after OVA stimulation. b, OVA-induced Ca2+ flux traces (left) and maximum values (right) in LAD2 cells sensitized with PBS (black), OVA-specific SiahIgE (maroon) or AshIgE (gold). n = 5 biologically independent samples from three independent experiments. c, OVA-elicited degranulation in LAD2 cells sensitized with OVA-specific SiahIgE and treated with SiaFetuin (maroon) or AsFetuin (gold). n = 3 technical replicates. d, Quantification of ear blue coloration (left) and representative images (right) following OVA-induced PCA in mice sensitized with PBS, OVA-specific SiamIgE, both OVA-specific SiamIgE + AsmIgE, or both OVA-specific SiamIgE + mIgE isotype control (n = 2, 6, 3, 3 mice ears, respectively). e, Temperature change following DNP-induced PSA in mice receiving DNP-specific SiamIgE on day 0 and PBS, OVA-specific SiamIgE or AsmIgE on day 1 (n = 6, 7, 7, respectively from two independent experiments). f, Schematic of NEUFcε. g, OVA-induced degranulation in LAD2 cells sensitized with OVA-specific SiahIgE and treated with PBS, NEUFcε, heat-inactivated NEUFcε (H-I NEUFcε) or IgE isotype control. h, Peanut-induced degranulation in LAD2 cells sensitized with peanut-allergic SiahIgE treated with PBS, NEUFcε, or IgE isotype control. g, h, n = 3 technical replicates. i, Temperature changes following OVA-induced PSA in mice receiving OVA-specific SiamIgE on day 0 and PBS, NEUFcε, or IgE isotype control on day 1. n = 4 mice per group. Data are mean ± s.e.m. (b-e, g-i) and are representative of two (a, d) and three (c, g-i) independent experiments. Two-tailed paired t-test (b), one-way ANOVA with Tukey’s (d), or two-way ANOVA with Sidak’s (c) or Tukey’s multiple comparison test (e, g-i). For gel source data, see Supplementary Figure 1.

Comment in

References

    1. Gupta RS et al. Prevalence and Severity of Food Allergies Among US Adults. JAMA Netw Open 2, e185630, doi:10.1001/jamanetworkopen.2018.5630 (2019). - DOI - PMC - PubMed
    1. Gould HJ & Sutton BJ IgE in allergy and asthma today. Nature Reviews Immunology 8, 205–217, doi:10.1038/nri2273 (2008). - DOI - PubMed
    1. Bird JA, Crain M & Varshney P Food allergen panel testing often results in misdiagnosis of food allergy. J Pediatr 166, 97–100, doi:10.1016/j.jpeds.2014.07.062 (2015). - DOI - PubMed
    1. Du Toit G et al. Randomized trial of peanut consumption in infants at risk for peanut allergy. The New England Journal of Medicine 372, 803–813, doi:10.1056/NEJMoa1414850 (2015). - DOI - PMC - PubMed
    1. Peters RL, Gurrin LC & Allen KJ The predictive value of skin prick testing for challenge-proven food allergy: a systematic review. Pediatr Allergy Immunol 23, 347–352, doi:10.1111/j.1399-3038.2011.01237.x (2012). - DOI - PubMed

Publication types

MeSH terms