. 2020 May 15:11:888.
doi: 10.3389/fmicb.2020.00888. eCollection 2020.

Integrity of the Escherichia coli O157:H7 Cell Wall and Membranes After Chlorine Dioxide Treatment

Affiliations

Integrity of the Escherichia coli O157:H7 Cell Wall and Membranes After Chlorine Dioxide Treatment

David F Bridges et al. Front Microbiol. .

Abstract

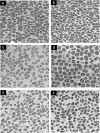
Treatments of wastewater and fresh produce commonly employ chlorine as an antimicrobial. However, there are increasing levels of concerns regarding the safety and antimicrobial efficacy of chlorine treatments. Numerous studies have reported the antimicrobial properties of chlorine dioxide (ClO2) treatment in a variety of applications but information regarding how ClO2 affects bacteria is limited. In the present study, a mixed-method approach utilizing both quantitative and qualitative methodologies was used to observe Escherichia coli O157:H7 membrane damage after exposure to ClO2 (2.5, 5, or 10 mg/L) for 5, 10, or 15 min. For comparison, controls of 0.1% peptone, 70% isopropanol, and 10 mg/L NaOCl were applied for 15 min. After treatment, cells were enumerated on selective media overlaid with non-selective media and simultaneously analyzed for damage using the following fluorescent probes (1) Bis-(1,3-Dibutylbarbituric Acid) trimethine oxonol (DiBAC4(3)) for membrane polarization, (2) SYTO 9/propidium iodide (LIVE/DEAD) for membrane permeability, (3) 2-(N-(7-Nitrobenz-2-oxa-1,3-diazol-4-yl)Amino)-2-Deoxyglucose (2-NBDG) for active glucose uptake, and (4) lipid peroxidation through accumulation of malondialdehyde (MDA). Bacterial log reductions after ClO2 treatment ranged from 0.2 to 5.5 and changes in relative fluorescence units after membrane permeability and glucose uptake assays were not consistent with viability, indicating membrane permeability and metabolism were not substantially altered. Depolarization was observed after NaOCl treatment, however, the polarity of cells treated with ClO2 were like those treated with water (P < 0.05). Accumulation of MDA was detected only after 10 mg/L ClO2 treatments, indicating that membrane peroxidation occurred at higher concentrations. Transmission electron microscopy imaging revealed that separation of the cell wall from the cytosol occurred after the 10 mg/L ClO2 treatment, but the cell wall itself appeared to be unbroken. These data suggest that ClO2 damage to E. coli O157:H7 is not primarily located at the cell wall and harms cells significantly different than NaOCl at comparable concentrations.

Keywords: Escherichia coli O157:H7; antimicrobial treatments; bacterial membranes; chlorine dioxide; oxidizers.


Figures

FIGURE 1
FIGURE 1
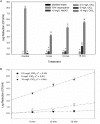
Log reduction of E. coli O157 after 2.5, 5, or 10 mg/L ClO2 treatment for 5, 10, or 15 min compared to control treatments (A) and linear regressions of bacterial reduction over time after ClO2 treatment (B). Data are presented as means ± standard deviations (n = 3) and significant differences (P ≤ 0.05) in bacteria reductions observed after each treatment are represented by different letters (e.g., A–F).
FIGURE 2
FIGURE 2
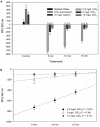
2-NBDG signal after 2.5, 5, or 10 mg/L ClO2 treatment for 5, 10, or 15 min compared to control treatments (A) and linear regressions of 2-NBDG signal over time after ClO2 treatment (B). Data are presented as means ± standard deviations and significant differences (P ≤ 0.05) in bacteria reductions observed after each treatment are represented by different letters (e.g., A–G).
FIGURE 3
FIGURE 3
SYTO 9: PI ratio after 2.5, 5, or 10 mg/L ClO2 treatment for 5, 10, or 15 min compared to control or ClO2 treatment. Data are presented as means ± standard deviations (n = 3) and significant differences (P ≤ 0.05) in bacteria reductions observed after each treatment are represented by different letters (e.g., A–F).
FIGURE 4
FIGURE 4
DiBAC4(3) uptake after 2.5, 5, or 10 mg/L ClO2 treatment for 5, 10, or 15 min compared to control or ClO2 treatment. Data are presented as means ± standard deviations (n = 3) and significant differences (P ≤ 0.05) in bacteria reductions observed after each treatment are represented by different letters (e.g., A–E).
FIGURE 5
FIGURE 5
Transmission electron micrographs of E. coli O157 after treatment with distilled water (A), 70% isopropanol (B), 10 mg/L NaOCl (C), 2.5 mg/L ClO2 (D), 5 mg/L ClO2 (E), or 10 mg/L ClO2 (F) for 15 min.
FIGURE 6
FIGURE 6
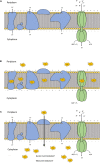
Polarization and integrity schematic of the E. coli cytoplasmic membrane during normal conditions (A) and after ClO2 treatment if damage is localized at membrane proteins and lipids (B) or if ClO2 damage is localized intracellularly (C).

Similar articles

Cited by

References

    1. Bakhmutova-Albert E. V., Margerum D. W., Auer J. G., Applegate B. M. (2008). Chlorine dioxide oxidation of dihydronicotinamide adenine dinucleotide (NADH). Inorg. Chem. 47 2205–2211. 10.1021/ic7019022 - DOI - PubMed
    1. Berg J. D., Roberts P. V., Matin A. (1986). Effect of chlorine dioxide on selected membrane functions of Escherichia coli. J. Appl. Bacteriol. 60 213–220. 10.1111/j.1365-2672.1986.tb01075.x - DOI - PubMed
    1. Bozzola J. J. (2014). “Conventional specimen preperation techniques for transmission electron microscopy of culture cells,” in Electron Microscopy: Methods in Molecular Biology (Methods and Protocols), Vol. 1117 ed. Kuo J. (Totowa, NJ: Humana Press; ). 10.1007/978-1-62703-776-1_1 - DOI - PubMed
    1. Bridges D. F., Tadepalli S., Anderson R., Zhang R., Wu V. C. H. (2019). Reduction of Listeria monocytogenes and Salmonella Typhimurium on Blueberries through brief exposure to antimicrobial solutions coupled with freezing. J. Food Prot. 82 926–930. 10.4315/0362-028X.JFP-18-433 - DOI - PubMed
    1. Bridges D. F., Wu V. C. H. (2018). “Gaseous chlorine dioxide for postharvest treatment of produce,” in Postharvest Disinfection of Fruits and Vegetables. Available online at: 10.1016/b978-0-12-812698-1.00013-3 (accessed August 17, 2018). 10.1080/10408398.2016.1169157 - DOI - DOI - PubMed