. 2020 May 15:11:586.
doi: 10.3389/fpls.2020.00586. eCollection 2020.

Differential Regulation of Kernel Set and Potential Kernel Weight by Nitrogen Supply and Carbohydrate Availability in Maize Genotypes Contrasting in Nitrogen Use Efficiency

Affiliations

Differential Regulation of Kernel Set and Potential Kernel Weight by Nitrogen Supply and Carbohydrate Availability in Maize Genotypes Contrasting in Nitrogen Use Efficiency

Ivan A Paponov et al. Front Plant Sci. .

Abstract

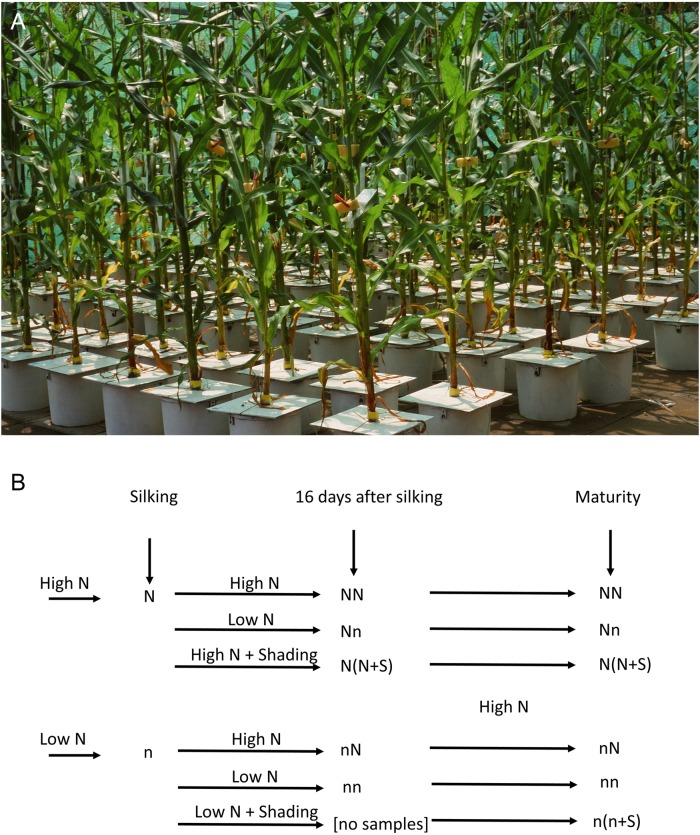
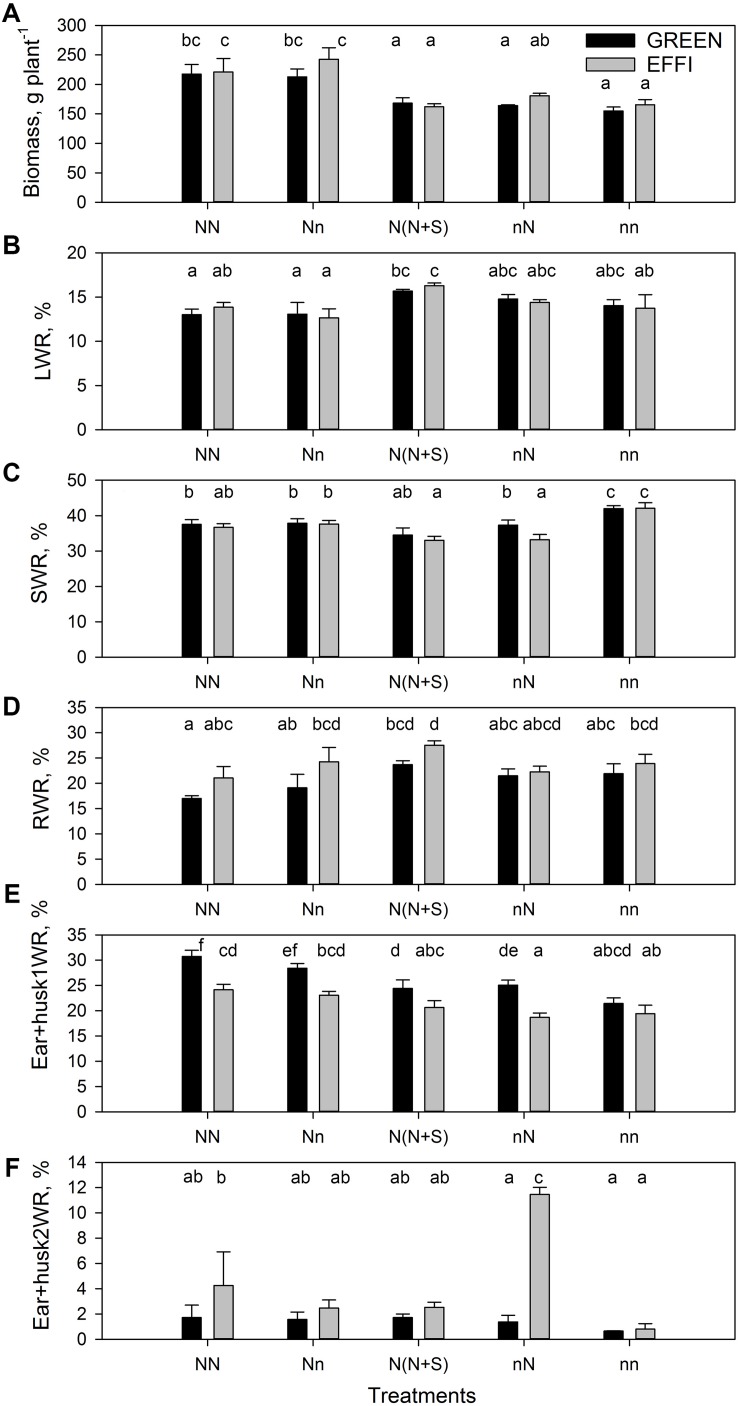
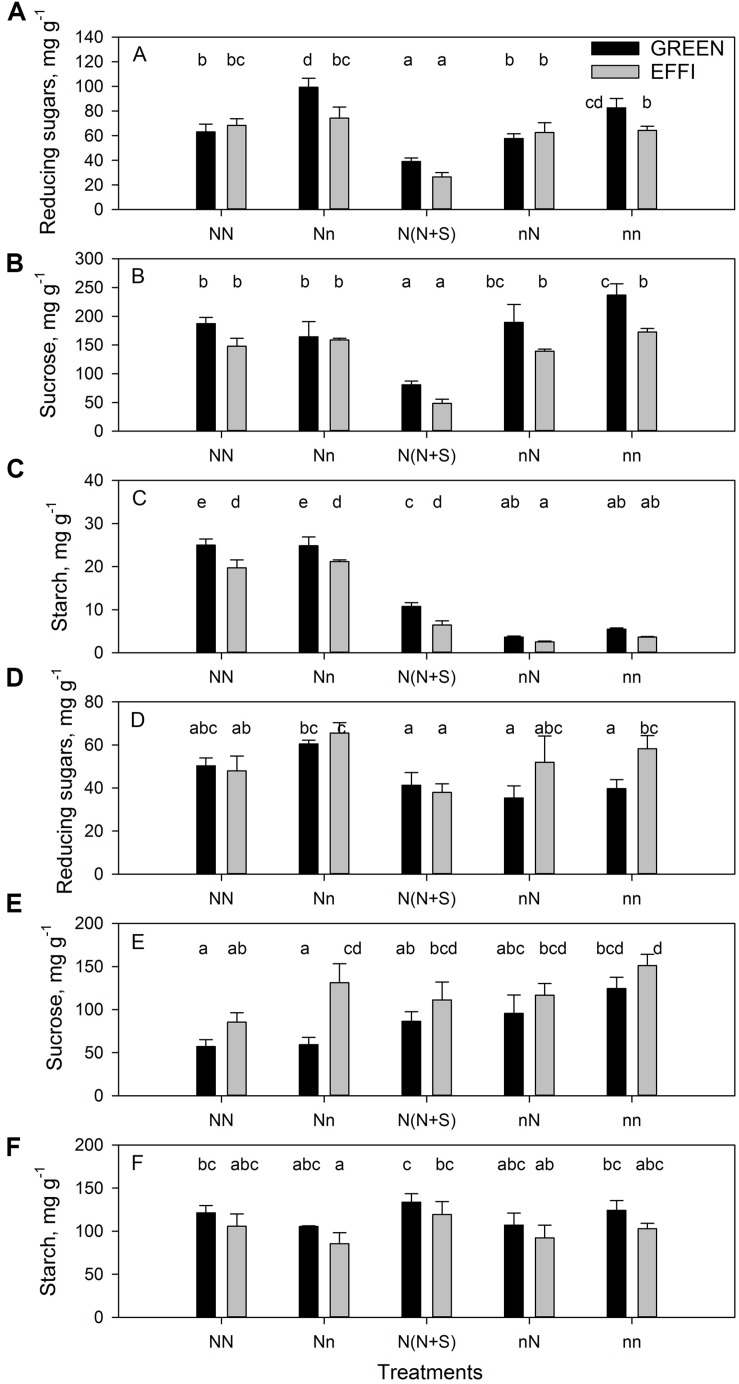
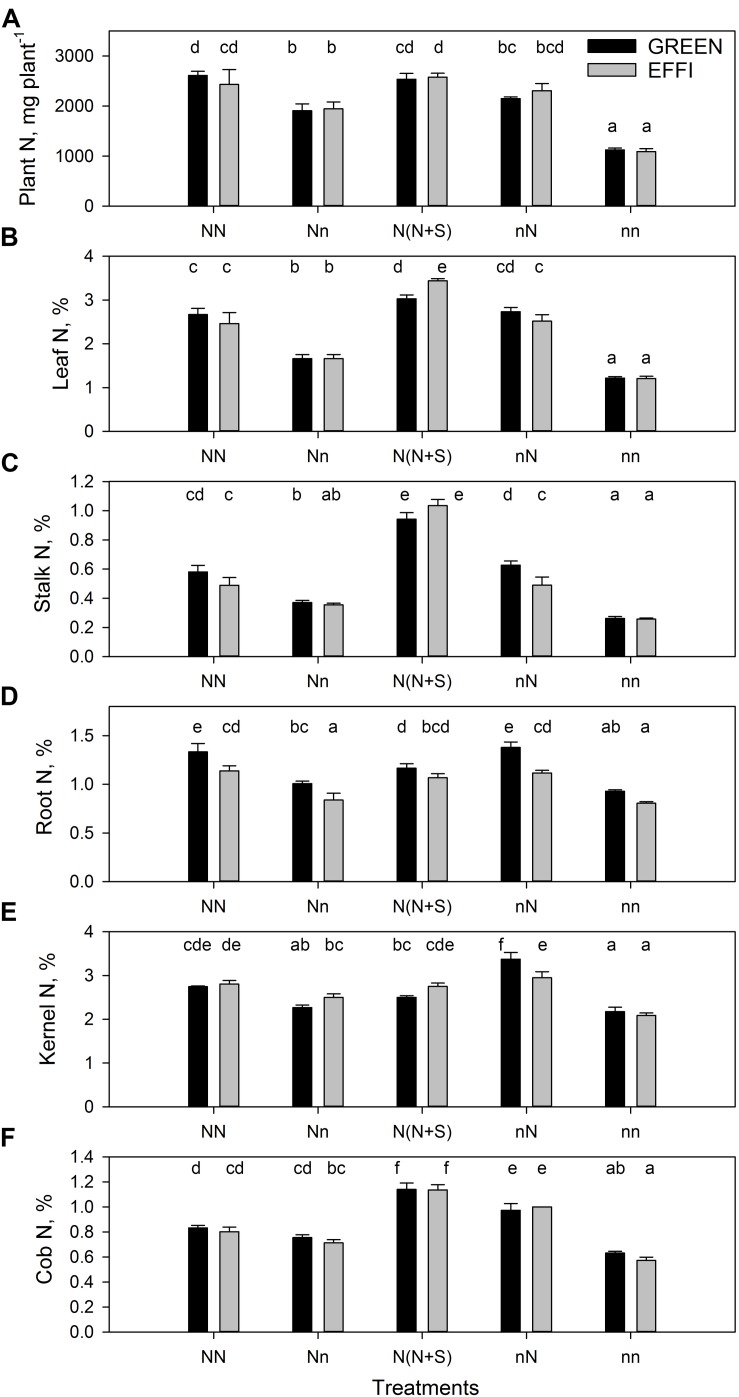
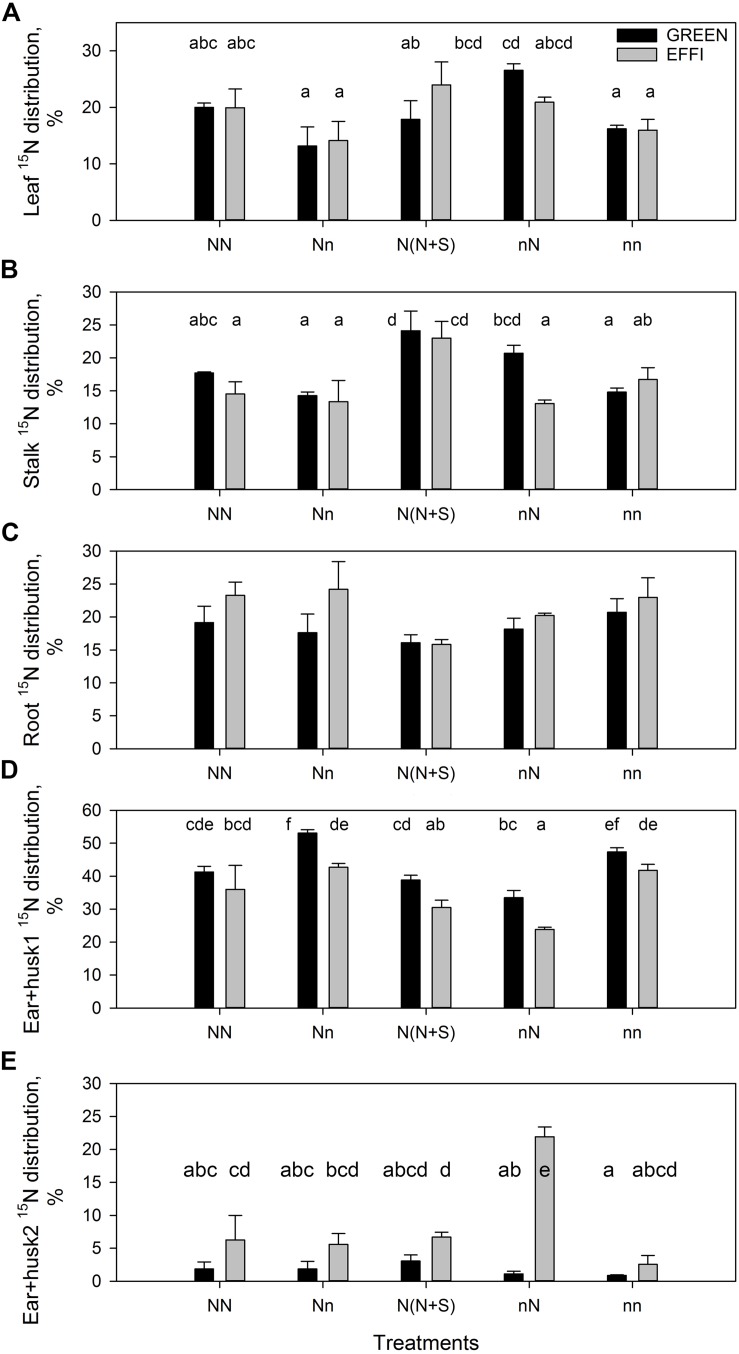
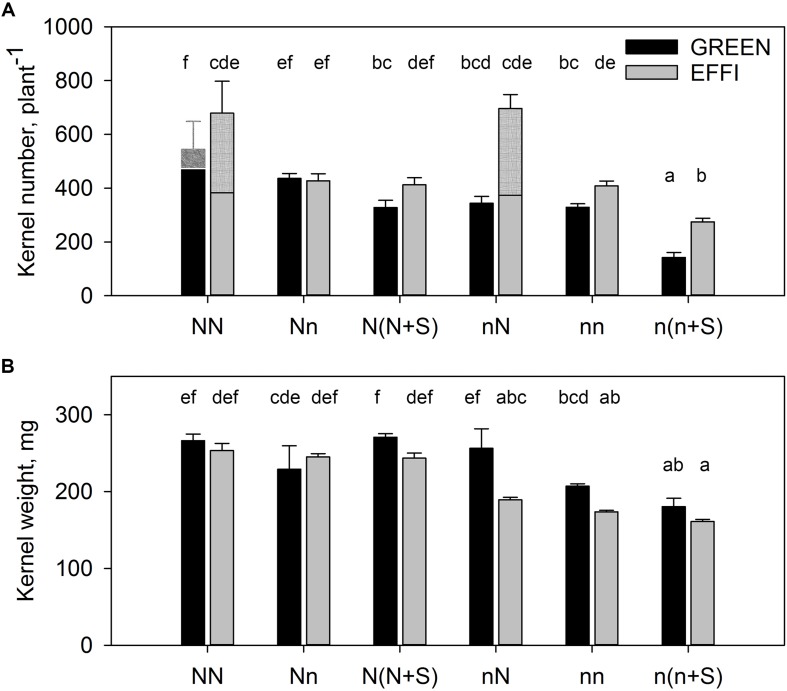
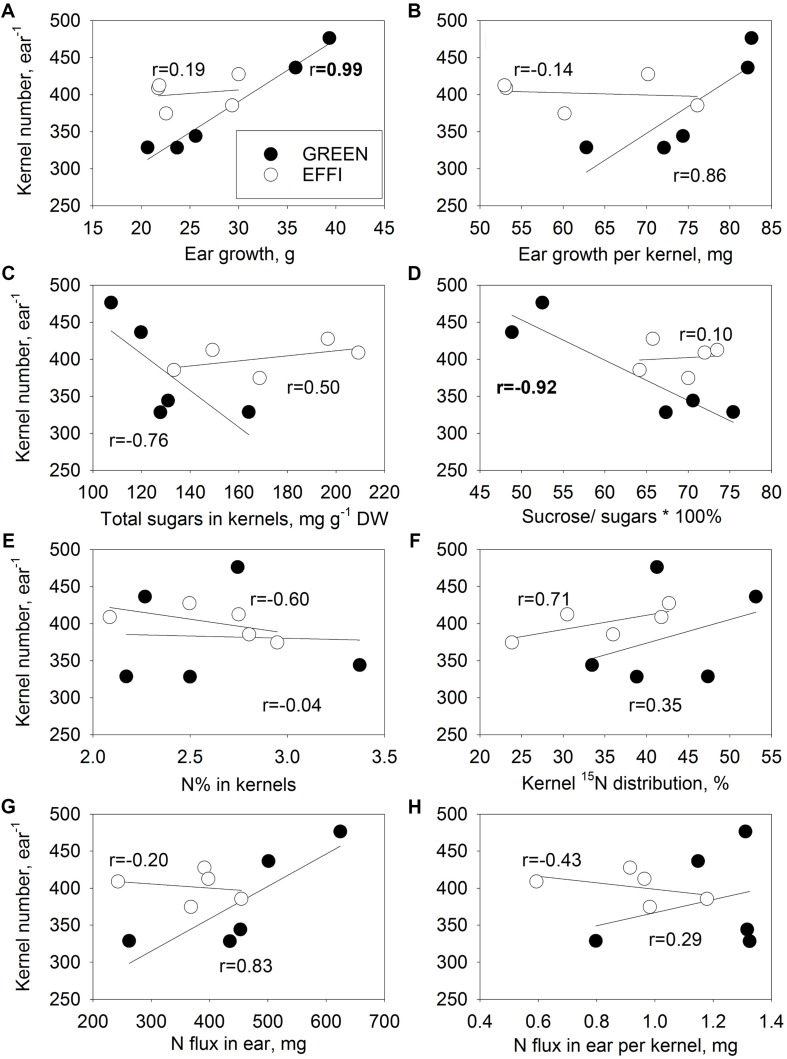
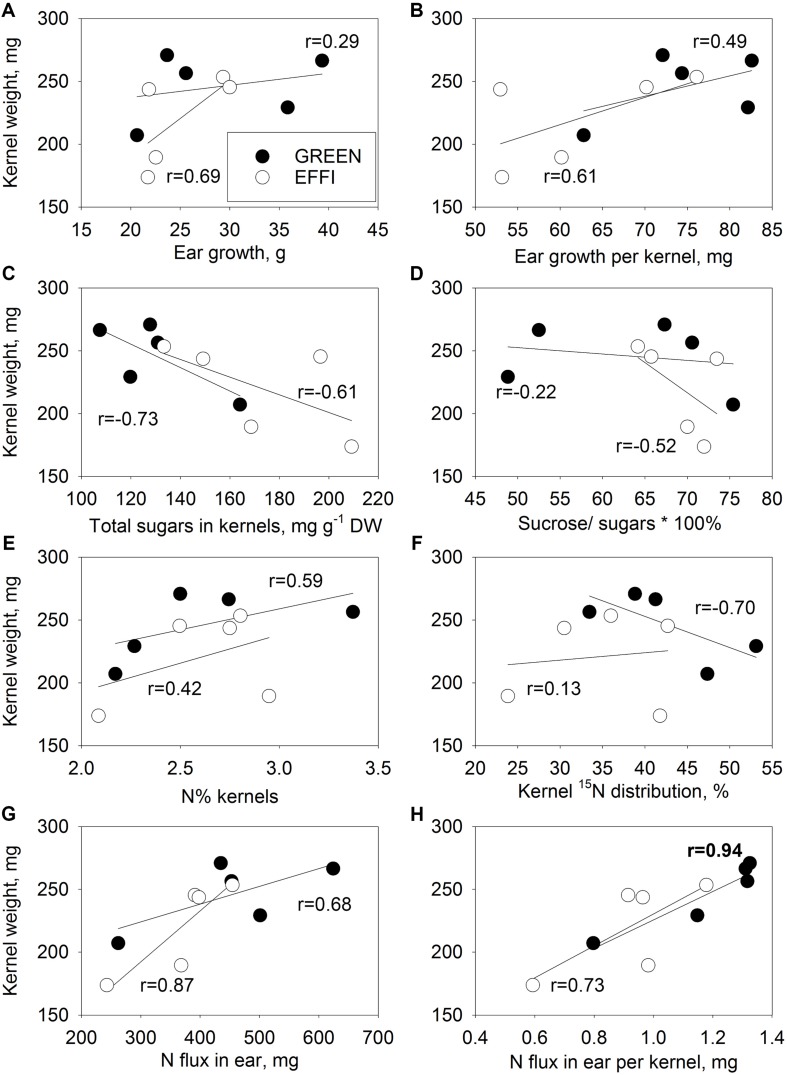
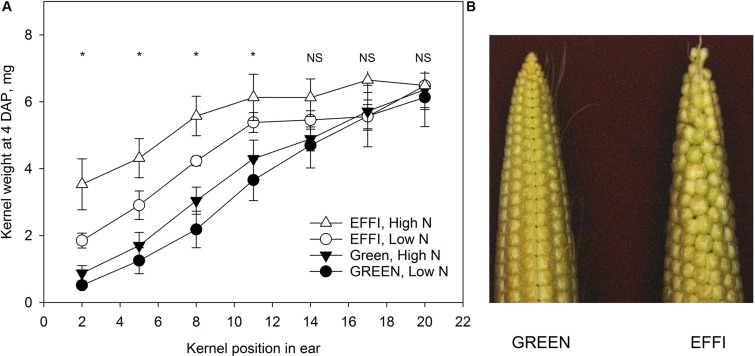
Sub-optimal nitrogen (N) conditions reduce maize yield due to a decrease in two sink components: kernel set and potential kernel weight. Both components are established during the lag phase, suggesting that they could compete for resources during this critical period. However, whether this competition occurs or whether different genotypic strategies exist to optimize photoassimilate use during the lag phase is not clear and requires further investigation. We have addressed this knowledge gap by conducting a nutrient solution culture experiment that allows abrupt changes in N level and light intensity during the lag phase. We investigated plant growth, dry matter partitioning, non-structural carbohydrate concentration, N concentration, and 15N distribution (applied 4 days before silking) in plant organs at the beginning and the end of the lag phase in two maize hybrids that differ in grain yield under N-limited conditions: one is a nitrogen-use-efficient (EFFI) genotype and the other is a control (GREEN) genotype that does not display high N use efficiency. We found that the two genotypes used different mechanisms to regulate kernel set. The GREEN genotype showed a reduction in kernel set associated with reduced dry matter allocation to the ear during the lag phase, indicating that the reduced kernel set under N-limited conditions was related to sink restrictions. This idea was supported by a negative correlation between kernel set and sucrose/total sugar ratios in the kernels, indicating that the capacity for sucrose cleavage might be a key factor defining kernel set in the GREEN genotype. By contrast, the kernel set of the EFFI genotype was not correlated with dry matter allocation to the ear or to a higher capacity for sucrose cleavage; rather, it showed a relationship with the different EFFI ear morphology with bigger kernels at the apex of the ear than in the GREEN genotype. The potential kernel weight was independent of carbohydrate availability but was related to the N flux per kernel in both genotypes. In conclusion, kernel set and potential kernel weight are regulated independently, suggesting the possibility of simultaneously increasing both sink components in maize.

Keywords: kernel set; maize; nitrogen; nitrogen use efficiency; non-structural carbohydrate; potential kernel weight; sink strength.


Figures

FIGURE 1
FIGURE 1
Design of the hydroponics experiment. (A) Maize cultivation in 20 L pots in hydroponics with continuous aeration. (B) The scheme of the experimental design: high and low N supply before silking, high and low N for 16 days after silking, and shading of the plants under constant N supply; all plants were given excess N and full light during the grain filling stage. Plants were harvested at the beginning of silking, at the end of the lag phase (i.e., 16 days after silking), and at maturity.
FIGURE 2
FIGURE 2
Plant biomass and dry matter distribution in two genotypes with different N-use efficiency at the end of the lag phase. (A) Plant biomass, (B) leaf weight ratio (LWR), (C) stalk weight ratio (SWR), (D) root weight ratio (RWR), (E) ear 1 and husk weight ratio (Ear + husk1WR), (F) ear 2 and husk weight ratio (Ear + husk2WR). Treatments: High N before silking and during the lag phase (NN), high N before silking and low N during the lag phase (Nn), high N before silking and during the lag phase and shading during the lag phase [N(N + S)], low N before silking and high N during the lag phase (nN), low N before silking and during the lag phase (nn). Means ± SE are presented. Different lower case letters indicate significant differences (p ≤ 0.05, Fisher’s protected LSD). The data was analyzed by 2-factor-ANOVA. The first factor was treatments (T) [NN, Nn, N(N + S), nN, nn] and the second factor was genotype (G). Excluding shading from the analysis, the experiment was also analyzed by 3-factor ANOVA, using factors Nv, Nf, and G. The results of ANOVAs are presented in Supplementary Table S1.
FIGURE 3
FIGURE 3
The concentration of carbohydrates in stalk and kernels of two genotypes with different N-use efficiency at the end of the lag phase. Reducing sugars, sucrose, and starch in the stalk (A–C) and kernels (D–F). Treatments: High N before silking and during the lag phase (NN), high N before silking and low N during the lag phase (Nn), high N before silking and during the lag phase and shading during the lag phase [N(N + S)], low N before silking and high N during the lag phase (nN), low N before silking and during the lag phase (nn). Means ± SE are presented. Different lower case letters indicate significant differences (p ≤ 0.05, Fisher’s protected LSD). The experiment was analyzed by 2-factor-ANOVA. The first factor was treatments (T) [NN, Nn, N(N + S), nN, nn] and the second factor was genotype (G). Excluding shading from the analysis, the experiment was also analyzed by 3-factor ANOVA, using factors Nv, Nf, and G. The results of ANOVAs are presented in Supplementary Table S2.
FIGURE 4
FIGURE 4
Plant N uptake and N concentration in two genotypes with different N-use efficiency at the end of the lag phase. (A) Plant N uptake, N concentration in (B) leaves, (C) stalk, (D) roots, (E) kernels, and (F) cob. Treatments: High N before silking and during the lag phase (NN), high N before silking and low N during the lag phase (Nn), high N before silking and during the lag phase and shading during the lag phase [N(N + S)], low N before silking and high N during the lag phase (nN), low N before silking and during the lag phase (nn). Means ± SE are presented. Different lower case letters indicate significant differences (p ≤ 0.05, Fisher’s protected LSD). The experiment was analyzed by 2-factor-ANOVA. The first factor was treatments (T) [NN, Nn, N(N + S), nN, nn] and the second factor was genotype (G). Excluding shading from the analysis, the experiment was also analyzed by 3-factor ANOVA, using factors Nv, Nf, and G. The results of ANOVAs are presented in Supplementary Table S3.
FIGURE 5
FIGURE 5
Percentage of 15N distribution at the end of the lag phase in two genotypes with different N-use efficiency at the end of the lag phase. 15N distribution to (A) leaves, (B) stalk, (C) roots, (D) first ear and husks, (E) second ear and husks. Treatments: High N before silking and during the lag phase (NN), high N before silking and low N during the lag phase (Nn), high N before silking and during the lag phase and shading during the lag phase [N(N + S)], low N before silking and high N during the lag phase (nN), low N before silking and during the lag phase (nn). Means ± SE are presented. Different lower case letters indicate significant differences (p ≤ 0.05, Fisher’s protected LSD). The experiment was analyzed by 2-factor-ANOVA. The first factor was treatments (T) [NN, Nn, N(N + S), nN, nn] and the second factor was genotype (G). Excluding shading from the analysis, the experiment was also analyzed by 3-factor ANOVA, using factors Nv, Nf, and G. The results of ANOVAs are presented in Supplementary Table S4.
FIGURE 6
FIGURE 6
Kernel number (A) and kernel weight (B) for two genotypes with different N-use efficiency grown under high or low N supply during vegetative growth or during the lag phase and under full light or shading during the lag phase. Treatments: High N before silking and during the lag phase (NN), high N before silking and low N during the lag phase (Nn), high N before silking and during the lag phase and shading during the lag phase [N(N + S)], low N before silking and high N during the lag phase (nN), low N before silking and during the lag phase (nn), and low N before silking and during the lag phase and shading [n(n + S)]. All plants were grown under luxury conditions during the effective grain filling stage to ensure that the final kernel weight corresponded to the potential kernel weight established at the end of the lag phase. Means ± SE are presented. Different lower case letters indicate significant differences (p ≤ 0.05, Fisher’s protected LSD). The treatments NN for both genotypes and nN for the EFFI genotype induced formation of a second ear. The kernel number of the second ear is shown in the hatched part of the columns (A), so that the contribution of every ear is presented. The statistical analysis is presented for the first ear. Two separate 3-factor-ANOVAs were carried out. In the first analysis, the factors N level during vegetative stage up to silking (Nv), N level after flowering from silking to 16 days after silking (Nf), and genotype (G) were tested (NN, Nn, nN, nn). In the second analysis, the factors N level (both during vegetative and the lag phase), shading (S), and genotype (G) were tested [NN, N(N + S), nn, n(n + S)]. The results of ANOVAs are presented in Supplementary Table S5.
FIGURE 7
FIGURE 7
Relationships between kernel number (KN) of the first ear and parameters describing the supply of the first ear with N and carbohydrates during the lag phase for two genotypes with different N-use efficiency. Relationships between KN and ear growth (A), ear growth per kernel (B), total soluble sugar concentrations in kernels (C), ratio of sucrose to total soluble sugar concentrations in kernels (D), kernel N concentrations (E), 15N distribution to kernels (F), N flux into ear (G), and N flux into ear per kernel (H). The correlation coefficients (r) in bold are statistically significant at p < 0.05.
FIGURE 8
FIGURE 8
Relationships between kernel weight (KW) of the first ear and parameters describing the supply of the first ear with N and carbohydrate during the lag phase for two genotypes with different N-use efficiency. Relationships between KW and ear growth (A), ear growth per kernel (B), total soluble sugars in kernel (C), ratio of sucrose to total soluble sugars (D), N% kernel (E), 15N distribution to kernel (F), N flux into ear (G), and N flux into ear per kernel (H). The correlation coefficients (r) in bold are statistically significant at p < 0.05.
FIGURE 9
FIGURE 9
The kernel size four days after pollination for two genotypes with different N-use efficiency grown at high and low level of N supply in a field experiment. (A) Kernel dry weight at specific position along the rachis of the ear. Asterisks indicate statistical significant differences among treatments at p < 0.05. (B) Typical phenotypes of ears of two genotypes at 4 days after pollination.

Similar articles

Cited by

References

    1. Andrade F. H., Echarte L., Rizzalli R., Della Maggiora A., Casanovas M. (2002). Kernel number prediction in maize under nitrogen or water stress. Crop Sci. 42 1173–1179. 10.2135/cropsci2002.1173 - DOI
    1. Bihmidine S., Hunter C. T., Johns C. E., Koch K. E., Braun D. M. (2013). Regulation of assimilate import into sink organs: update on molecular drivers of sink strength. Front. Plant Sci. 4:177. 10.3389/fpls.2013.00177 - DOI - PMC - PubMed
    1. Blakeney A. B., Mutton L. L. (1980). A simple colorimetric method for the determination of sugars in fruit and vegetables. J. Sci. Food Agr. 31 889–897. 10.1002/jsfa.2740310905 - DOI
    1. Borras L., Gambin B. L. (2010). Trait dissection of maize kernel weight: Towards integrating hierarchical scales using a plant growth approach. Field Crop. Res. 118 1–12. 10.1016/j.fcr.2010.04.010 - DOI
    1. Borras L., Vitantonio-Mazzini L. N. (2018). Maize reproductive development and kernel set under limited plant growth environments. J. Exp. Bot. 69 3235–3243. 10.1093/jxb/erx452 - DOI - PubMed