. 2020 May 15:11:595.
doi: 10.3389/fpls.2020.00595. eCollection 2020.

Image-Based Assessment of Drought Response in Grapevines

Affiliations

Image-Based Assessment of Drought Response in Grapevines

Nunzio Briglia et al. Front Plant Sci. .

Abstract

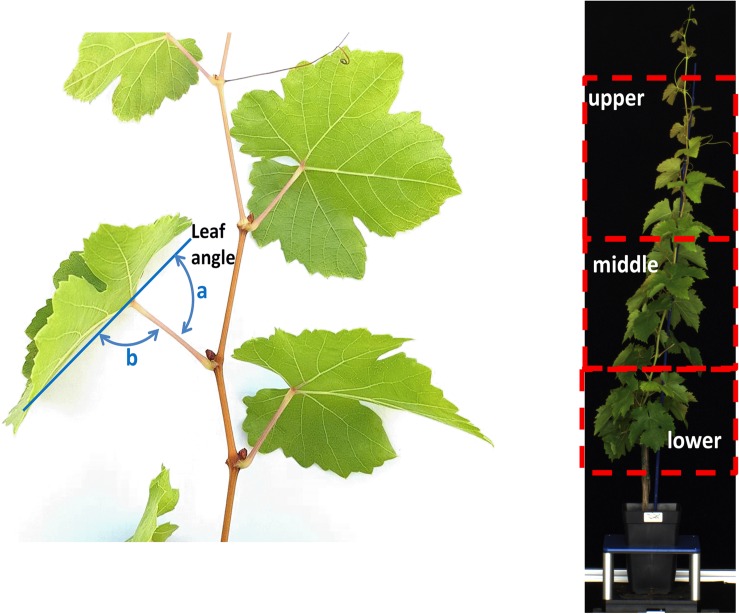
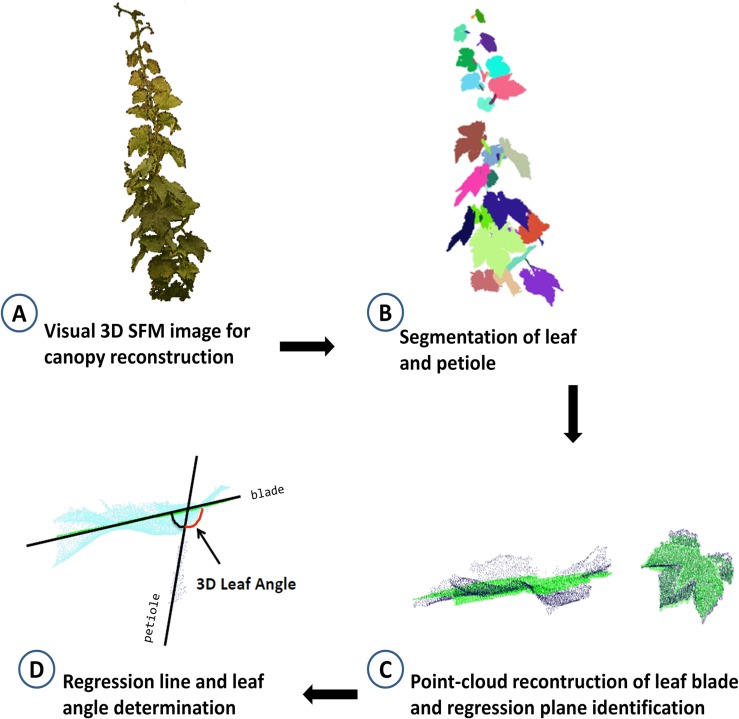
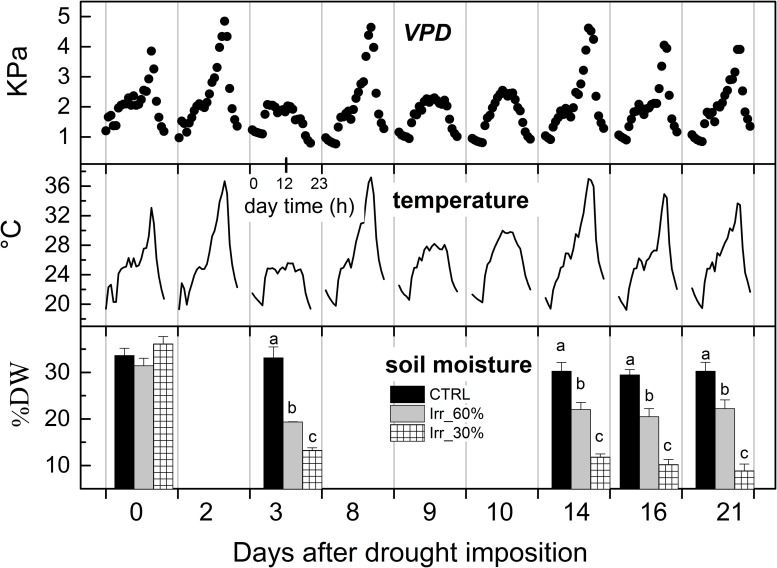
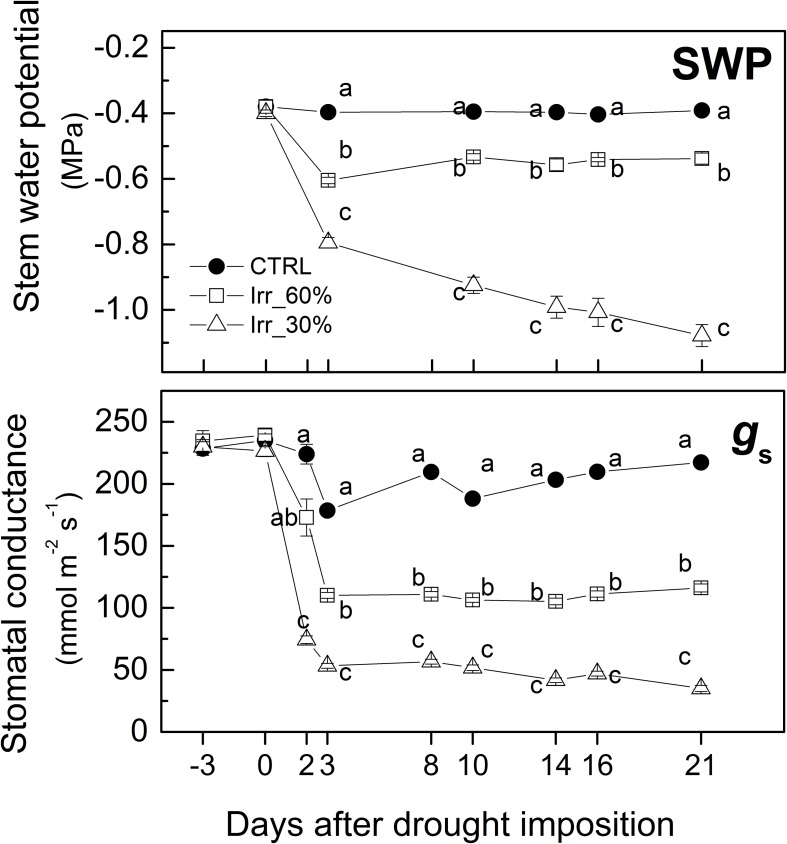
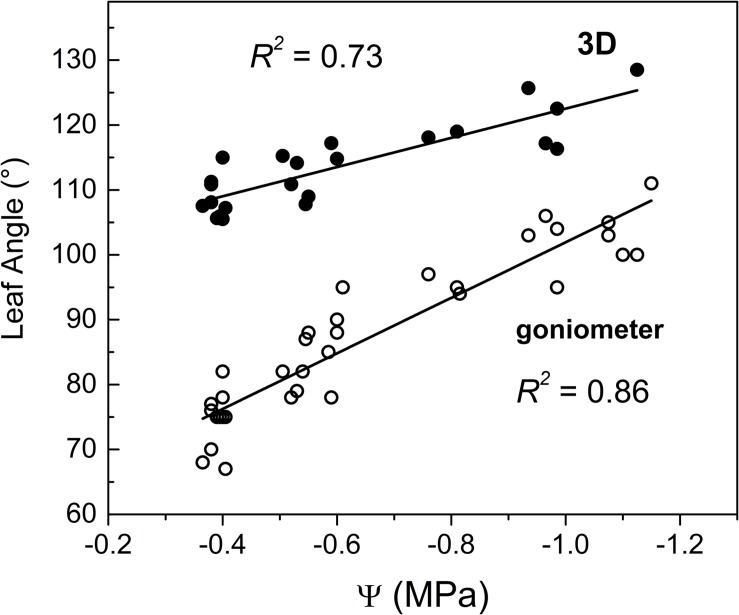
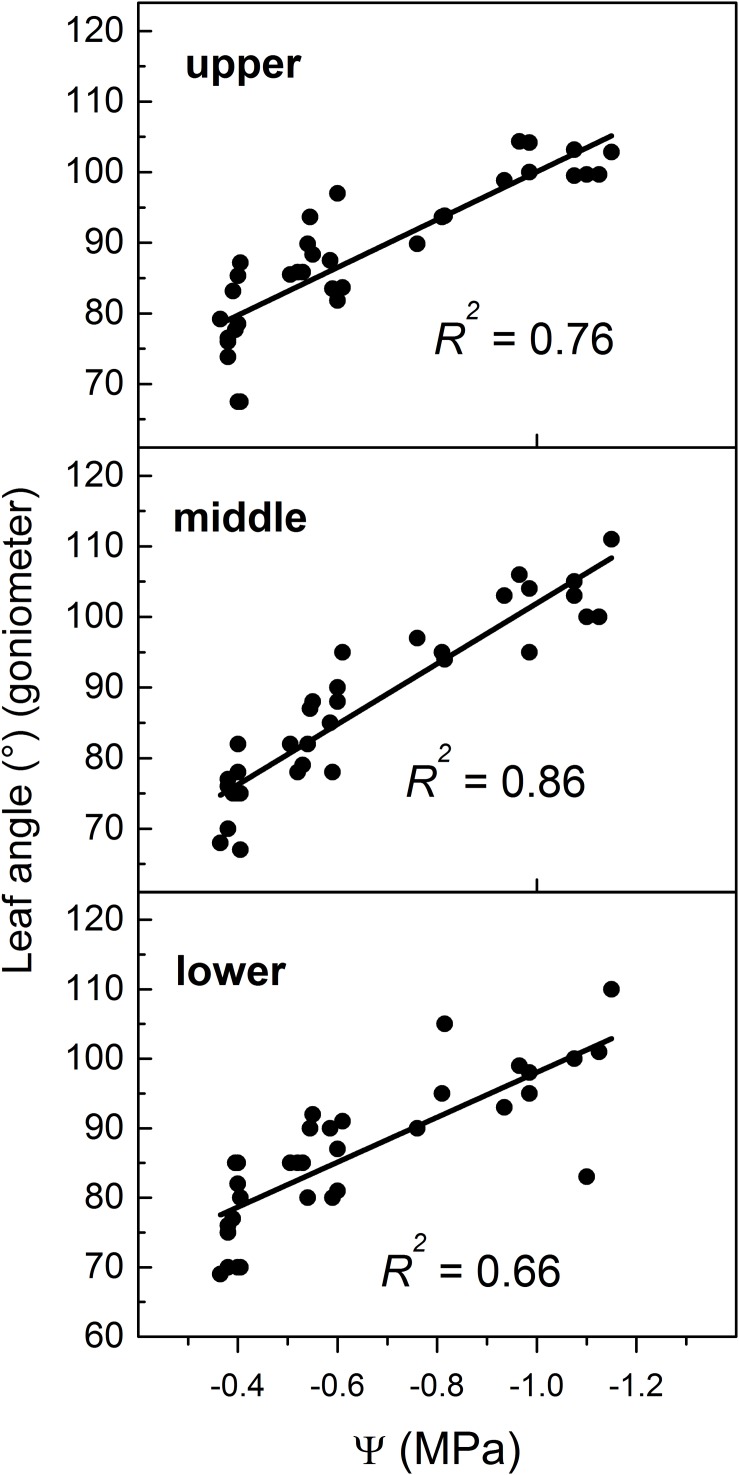
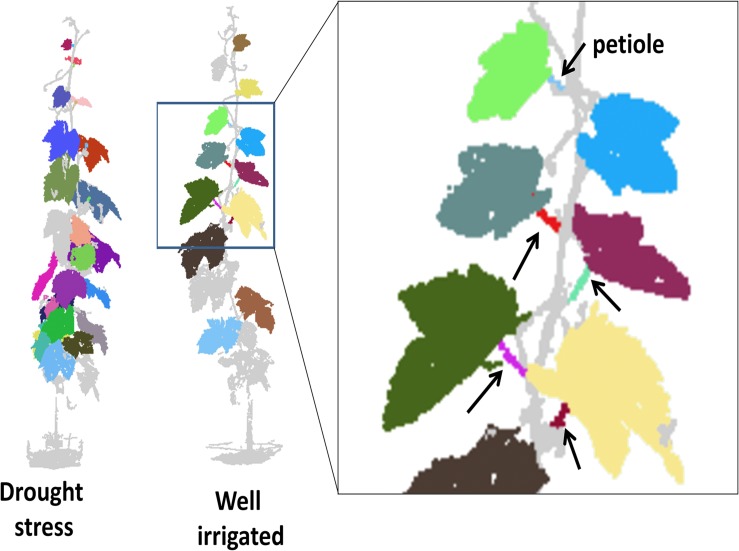
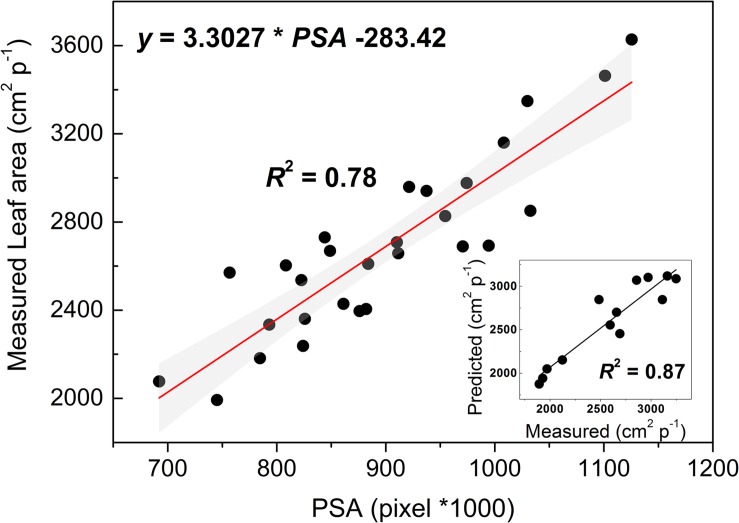
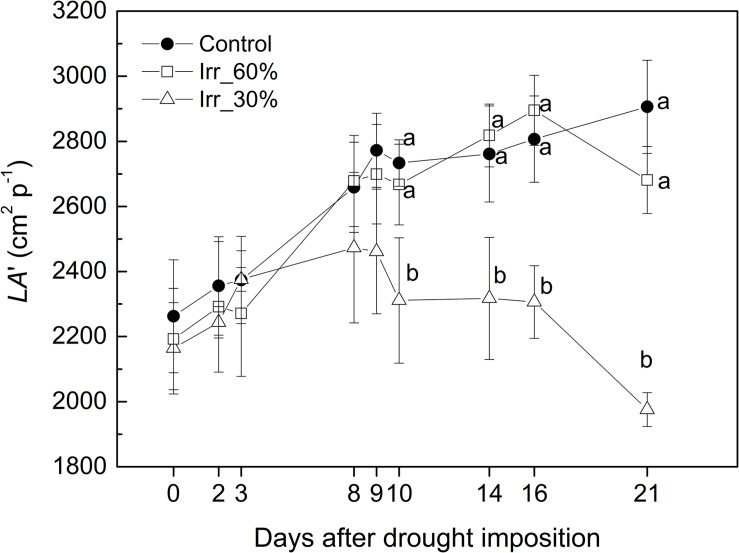
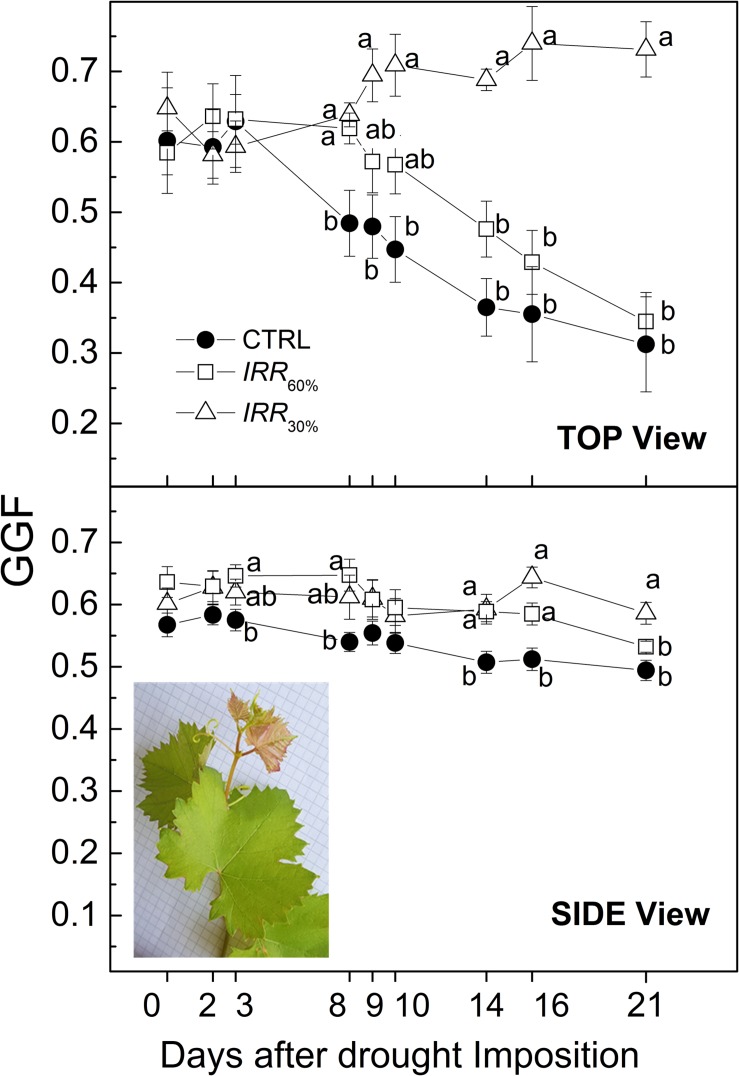
Many plants can modify their leaf profile rapidly in response to environmental stress. Image-based data are increasingly used to retrieve reliable information on plant water status in a non-contact manner that has the potential to be scaled to high-throughput and repeated through time. This paper examined the variation of leaf angle as measured by both 3D images and goniometer in progressively drought stressed grapevine. Grapevines, grown in pots, were subjected to a 21-day period of drought stress receiving 100% (CTRL), 60% (IRR 60%) and 30% (IRR 30%) of maximum soil available water capacity. Leaf angle was (i) measured manually (goniometer) and (ii) computed by a 3D reconstruction method (multi-view stereo and structure from motion). Stomatal conductance, leaf water potential, fluorescence (F v /F m ), leaf area and 2D RGB data were simultaneously collected during drought imposition. Throughout the experiment, values of leaf water potential ranged from -0.4 (CTRL) to -1.1 MPa (IRR 30%) and it linearly influenced the leaf angle when measured manually (R 2 = 0.86) and with 3D image (R 2 = 0.73). Drought was negatively related to stomatal conductance and leaf area growth particularly in IRR 30% while photosynthetic parameters (i.e., F v /F m ) were not impaired by water restriction. A model for leaf area estimation based on the number of pixels of 2D RGB images developed at a different phenotyping robotized platform in a closely related experiment was successfully employed (R 2 = 0.78). At the end of the experiment, top view 2D RGB images showed a ∼50% reduction of greener fraction (GGF) in CTRL and IRR 60% vines compared to initial values, while GGF in IRR 30% increased by approximately 20%.

Keywords: 3D imaging; Multi-view stereo; Vitis vinifera; greener fraction; leaf angle; plant phenotyping; water stress.


Figures

FIGURE 1
FIGURE 1
Left: schematic diagram of the protocol used to determine (a) leaf angle as supplementary of (b) angle of midrib from petiole; right: representation of the lower (nodes 1–5 from ground), middle (nodes 6–11) and upper (nodes >11) region of a plant canopy.
FIGURE 2
FIGURE 2
Schematic work-flow of the procedure for 3D identification of leaf angle showing (A) a digital plant canopy obtained using 60 side-view images and structure from motion reconstruction (SFM) algorithm to obtain 3D cloud points; (B) leaf and petiole segmentation after removing noise points, region growing, filling small holes, the leaf and petiole were segmented semi-automatically; (C) determination of leaf blade regression plane and petiole regression line; (D) calculation of the leaf angle.
FIGURE 3
FIGURE 3
Diurnal variations of vapor pressure deficit (VPD) and air temperature recorded inside the glasshouse during the experiment and average values (± SE) of soil moisture (% dry weight) measured across the experiment in vines receiving 60% (IRR60%) and 30% (IRR30%) of the available water capacity and under well irrigation (CTRL). For soil moisture, comparing treatments at the same time different letter indicates statistically significant differences (Tukey’s HSD, p < 0.05), letters were not reported when differences were not significant.
FIGURE 4
FIGURE 4
Pattern of mean values (±SE) of stem water potential (SWP) and stomatal conductance (gs) measured midday in leaves of grapevines under drought stress receiving 60% (□, IRR60%) and 30% (Δ, IRR30%) of the available water capacity and well watered (•, CTRL). Comparing treatments at the same time different letter indicates statistically significant differences according to Tukey’s HSD test, p < 0.05. Note that letters were not reported when differences were not statistically significant.
FIGURE 5
FIGURE 5
Correlation between stem water potential measured midday (Ψ) at the middle region of canopy and leaf angle measured through (□) goniometer and (•) 3D-image method. Note that goniometer measurements refer to the middle canopy zone while 3D leaf angles are the average of 3–15 measurements collected in various plant canopy zones.
FIGURE 6
FIGURE 6
Relationship between leaf angle manually measured at three regions (upper, middle, and lower) of the canopy and midday leaf water potential (Ψ). Note that in all panels values of Ψ refer to the Ψ measured in the middle region. For location of regions please refer to Figure 1.
FIGURE 7
FIGURE 7
Schematic output of the 3D point cloud reconstruction and organ segmentation for a drought stressed (Ψ value approximately –1.0 MPa) and well irrigated (approximately –0.4 MPa) vines imaged at 14 DADI. On the right, the partial enlargement of the well irrigated canopy shows the identified petioles (arrows). Note that different colors indicate different items identified; colors apply only for electronic version of the article.
FIGURE 8
FIGURE 8
Linear fitting model of leaf area (y-axis) and the projected shoot area (PSA) resulting from a 10-fold cross-validation analysis. The gray filled area indicate the upper and lower 95% CI about the model. In the inset, a regression analysis testing the model on a different set of vines.
FIGURE 9
FIGURE 9
Evolution of the estimated leaf area (LA’) in grapevines under drought stress receiving 60% (□, IRR60%) and 30% (Δ, IRR30%) of the available water capacity and well watered (•, CTRL).
FIGURE 10
FIGURE 10
Evolution of Greener Fraction (GGF) recorded from top and side views throughout the experiment in vines well irrigated (CTRL) and under drought stress receiving 60% (IRR60%) and 30% (Δ, IRR30%) of maximum soil available water capacity. Comparing treatments at the same time different letters indicate statistically significant differences according to Tukey’s HSD test, p < 0.05. Note that letters were not reported when differences were not statistically significant. In the inset of the Side view panel a 1-year growing shoot of the Aleatico cv. (Vitis vinifera) showing typical copper-reddish young leaves pictured on a background with 0.5 cm mesh. Note that colors apply only for electronic version of the article.

References

    1. Bailey B. N., Mahaffee W. F. (2017). Rapid measurement of the three-dimensional distribution of leaf orientation and the leaf angle probability density function using terrestrial LiDAR scanning. Remote Sens. Environ. 194 63–76. 10.1016/j.rse.2017.03.011 - DOI
    1. Berger B., Parent B., Tester M. (2010). High-throughput shoot imaging to study drought responses. J. Exp. Bot. 61 3519–3528. 10.1093/jxb/erq201 - DOI - PubMed
    1. Biskup B., Scharr H., Schurr U., Rascher U. W. E. (2007). A stereo imaging system for measuring structural parameters of plant canopies. Plant Cell Environ. 30 1299–1308. - PubMed
    1. Black C. A. (1965). Methods of Soil Analysis: Part I Physical and Mineralogical Properties. Madison, WA: American Society of Agronomy.
    1. Boso S., Alonso-Villaverde V., Santiago J. L., Gago P., Dürrenberger M., Düggelin M., et al. (2010). Macro-and microscopic leaf characteristics of six grapevine genotypes (Vitis spp.) with different susceptibilities to grapevine downy mildew. Vitis 49 43–50.

LinkOut - more resources