

The contribution of tissue-grouped BMI-associated gene sets to cardiometabolic-disease risk: a Mendelian randomization study
- PMID: 32500151
- PMCID: PMC7660142
- DOI: 10.1093/ije/dyaa070
The contribution of tissue-grouped BMI-associated gene sets to cardiometabolic-disease risk: a Mendelian randomization study
Abstract
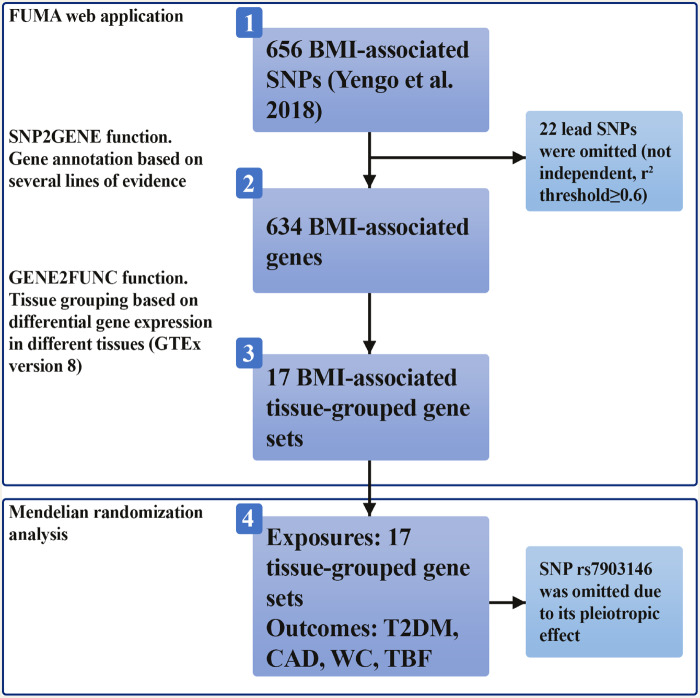
Background: Body mass index (BMI)-associated loci are used to explore the effects of obesity using Mendelian randomization (MR), but the contribution of individual tissues to risks remains unknown. We aimed to identify tissue-grouped pathways of BMI-associated loci and relate these to cardiometabolic disease using MR analyses.
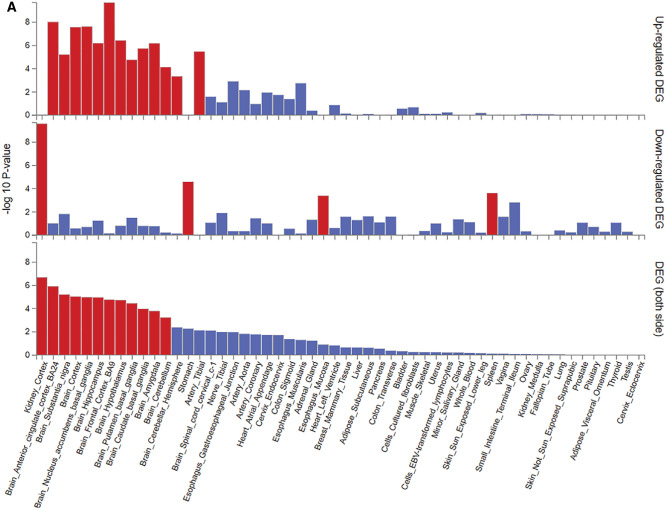
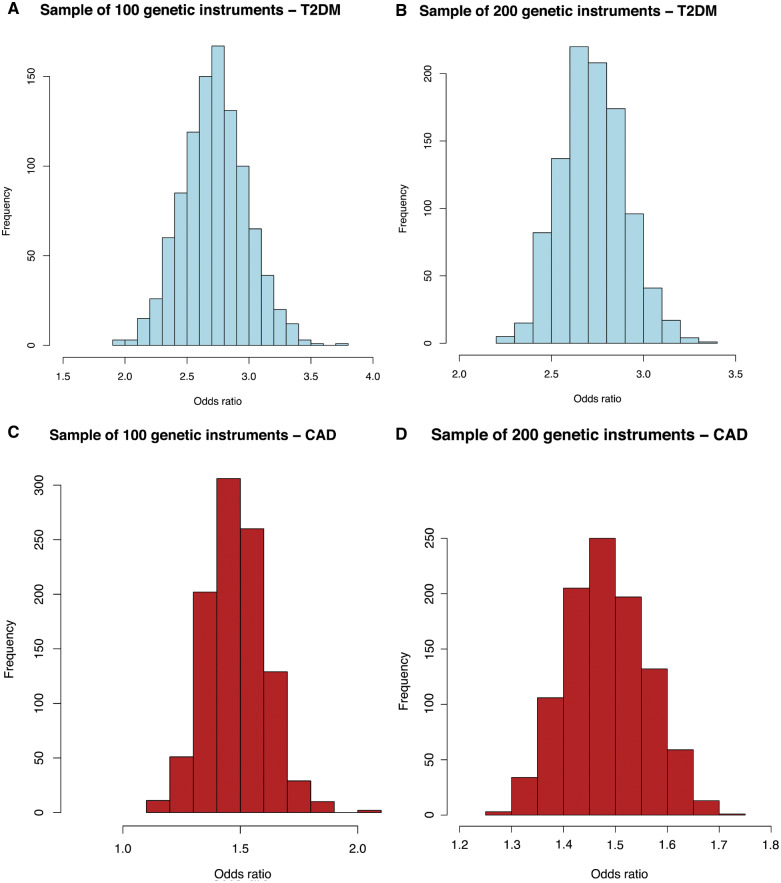
Methods: Using Genotype-Tissue Expression (GTEx) data, we performed overrepresentation tests to identify tissue-grouped gene sets based on mRNA-expression profiles from 634 previously published BMI-associated loci. We conducted two-sample MR with inverse-variance-weighted methods, to examine associations between tissue-grouped BMI-associated genetic instruments and type 2 diabetes mellitus (T2DM) and coronary artery disease (CAD), with use of summary-level data from published genome-wide association studies (T2DM: 74 124 cases, 824 006 controls; CAD: 60 801 cases, 123 504 controls). Additionally, we performed MR analyses on T2DM and CAD using randomly sampled sets of 100 or 200 BMI-associated genetic variants.
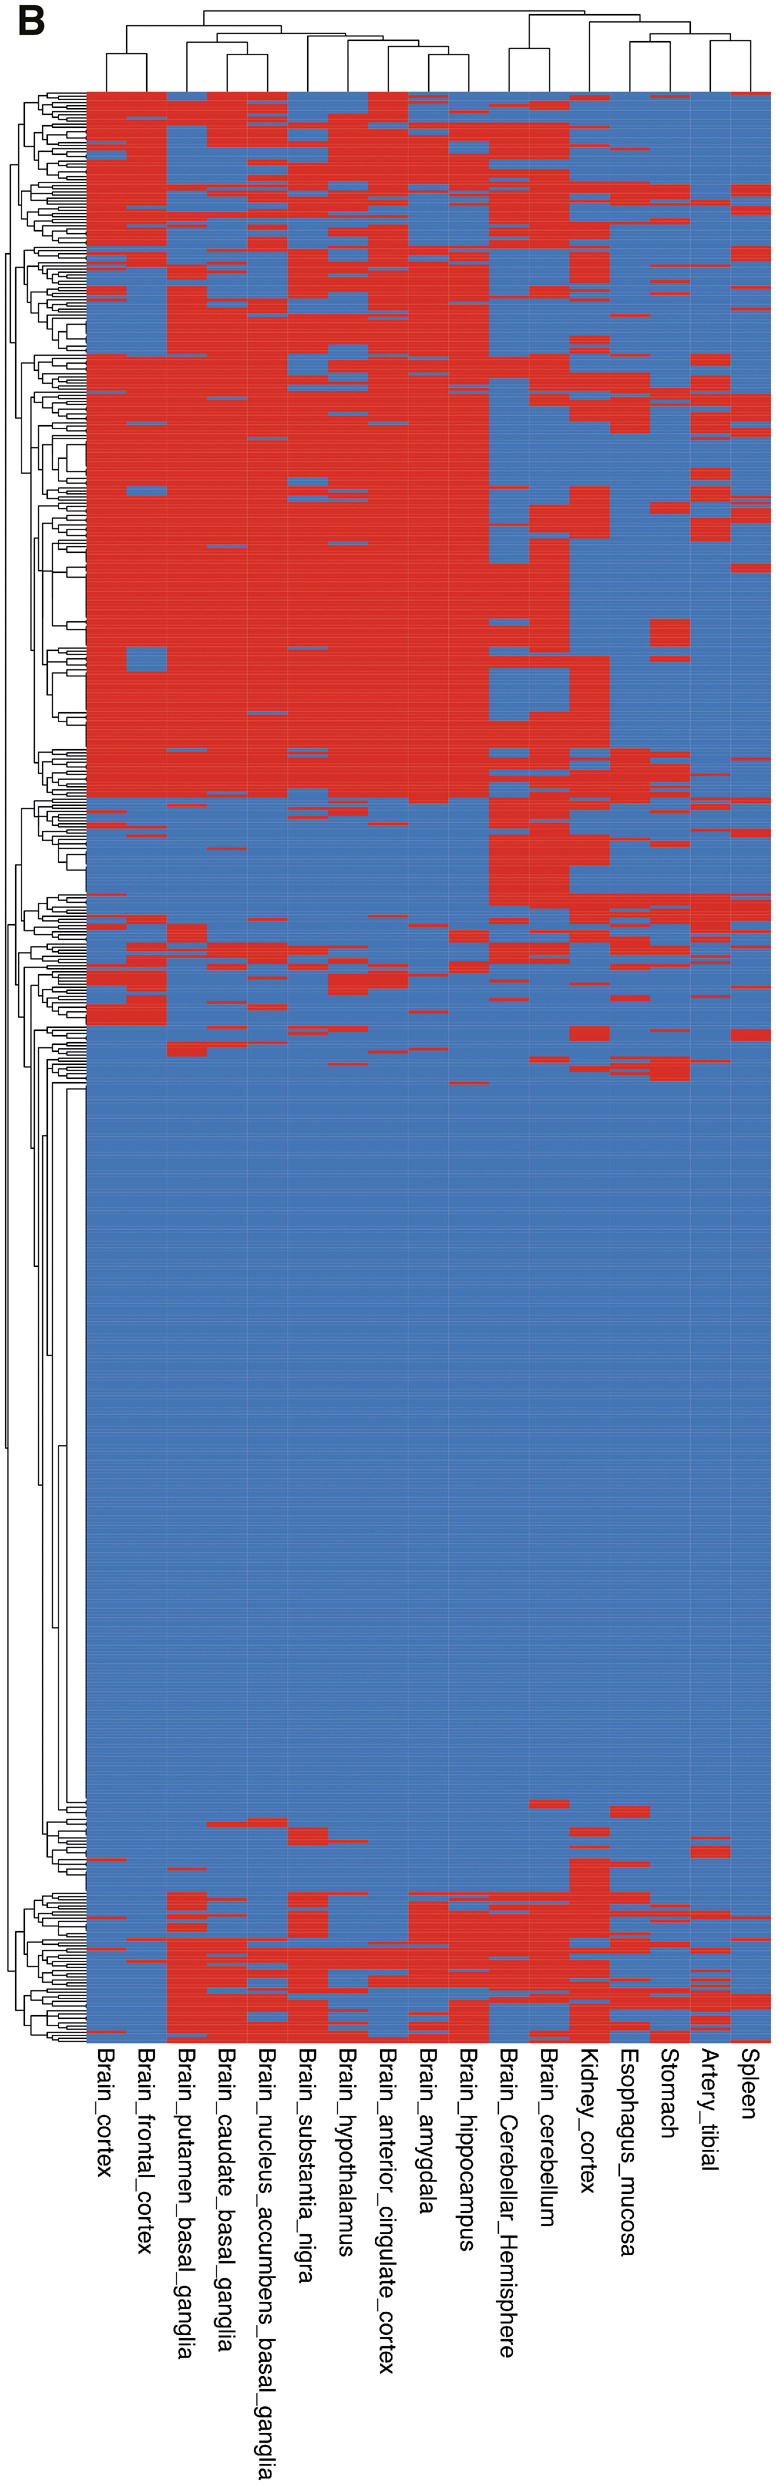
Results: We identified 17 partly overlapping tissue-grouped gene sets, of which 12 were brain areas, where BMI-associated genes were differentially expressed. In tissue-grouped MR analyses, all gene sets were similarly associated with increased risks of T2DM and CAD. MR analyses with randomly sampled genetic variants on T2DM and CAD resulted in a distribution of effect estimates similar to tissue-grouped gene sets.
Conclusions: Overrepresentation tests revealed differential expression of BMI-associated genes in 17 different tissues. However, with our biology-based approach using tissue-grouped MR analyses, we did not identify different risks of T2DM or CAD for the BMI-associated gene sets, which was reflected by similar effect estimates obtained by randomly sampled gene sets.
Keywords: Mendelian randomization analysis; anthropometry; body mass index; coronary artery disease; type 2 diabetes mellitus; waist circumference.
© The Author(s) 2020. Published by Oxford University Press on behalf of the International Epidemiological Association.
Figures
Comment in
-
Commentary on: "The contribution of tissue-specific BMI-associated gene sets to cardiometabolic disease risk: a Mendelian randomization study".Int J Epidemiol. 2020 Aug 1;49(4):1257-1258. doi: 10.1093/ije/dyaa062. Int J Epidemiol. 2020. PMID: 32386404 No abstract available.
References
-
- World Health Organization (WHO). Obesity and overweight. Fact sheet No 311. 2020. https://www.who.int/en/news-room/fact-sheets/detail/obesity-and-overweight (27 March 2020, date last accessed).
Publication types
MeSH terms
LinkOut - more resources
Full Text Sources
Medical
Miscellaneous
