. 2020 Aug;33(8):e4323.
doi: 10.1002/nbm.4323. Epub 2020 Jun 5.

Cardiac cine magnetic resonance fingerprinting for combined ejection fraction, T1 and T2 quantification

Affiliations

Cardiac cine magnetic resonance fingerprinting for combined ejection fraction, T1 and T2 quantification

Jesse I Hamilton et al. NMR Biomed. 2020 Aug.

Abstract

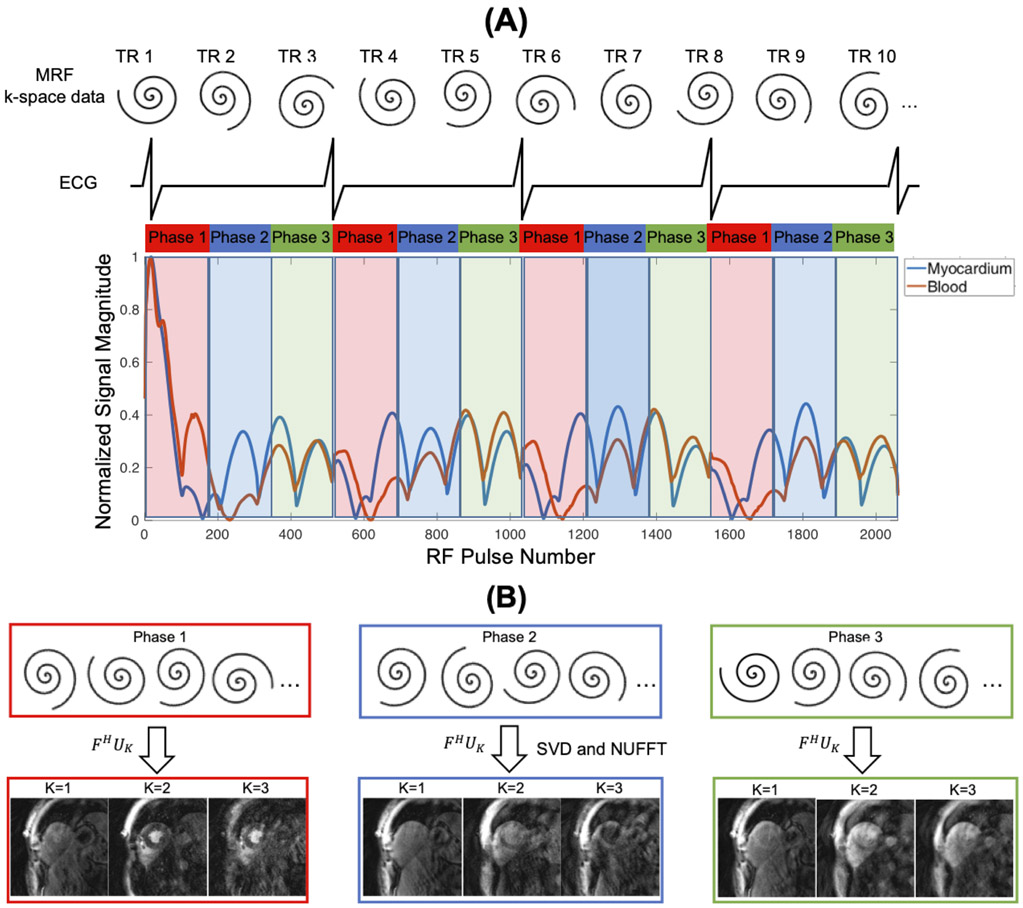
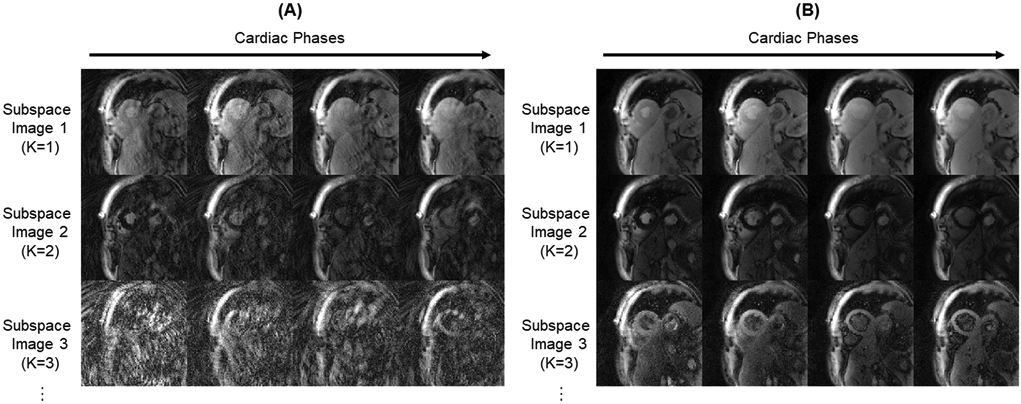
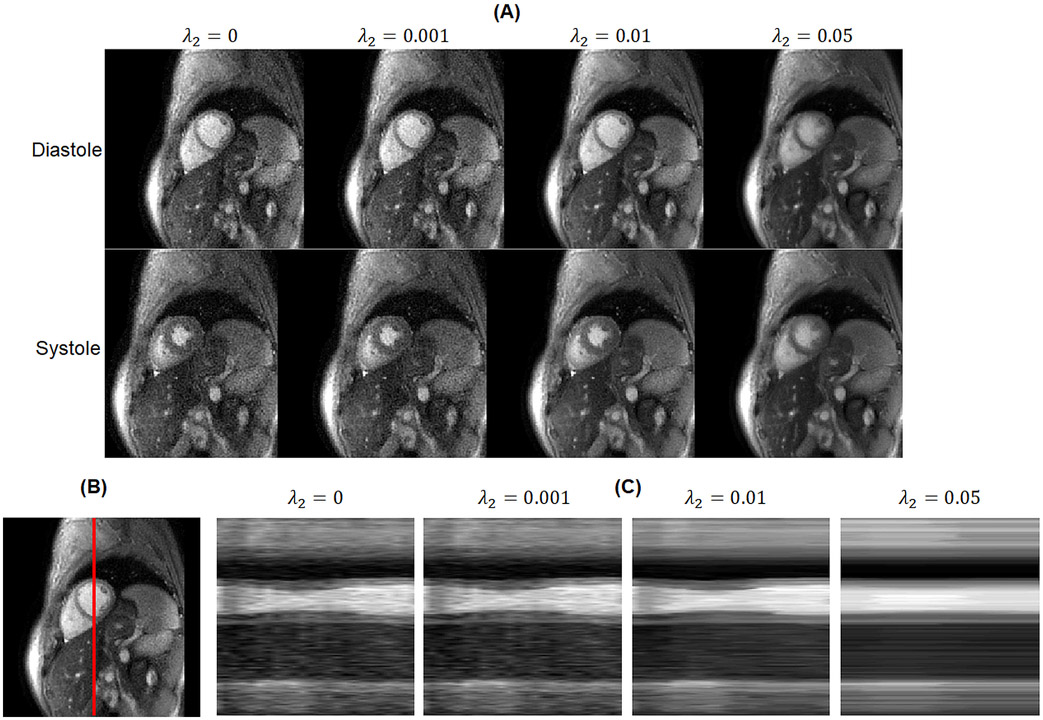
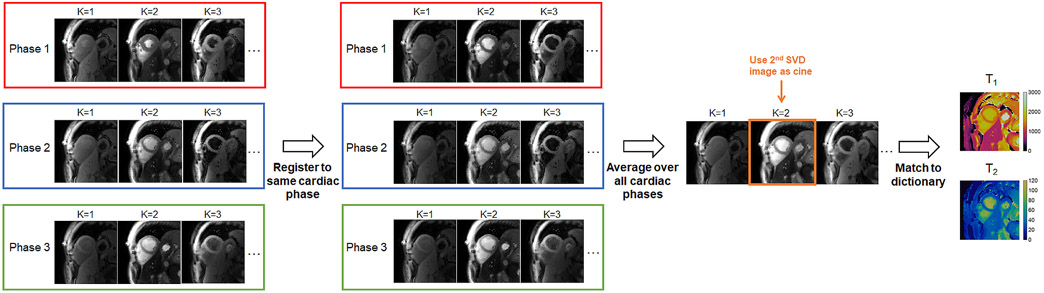
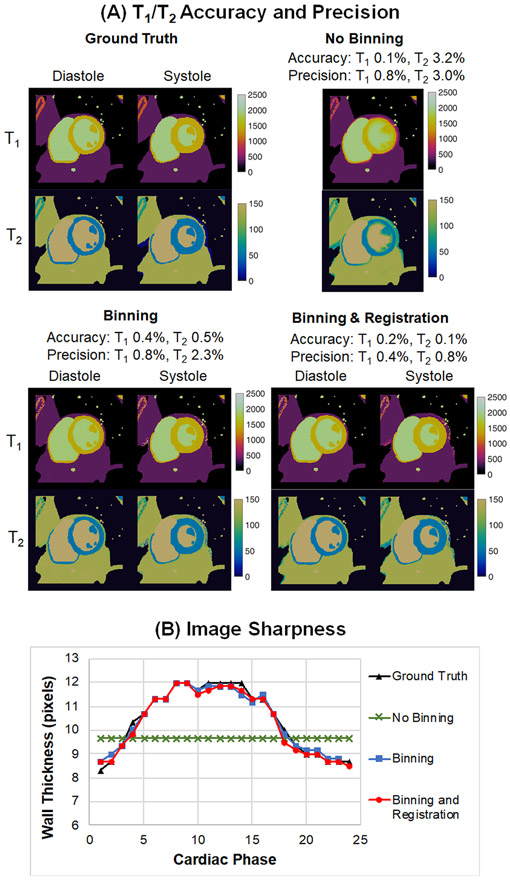
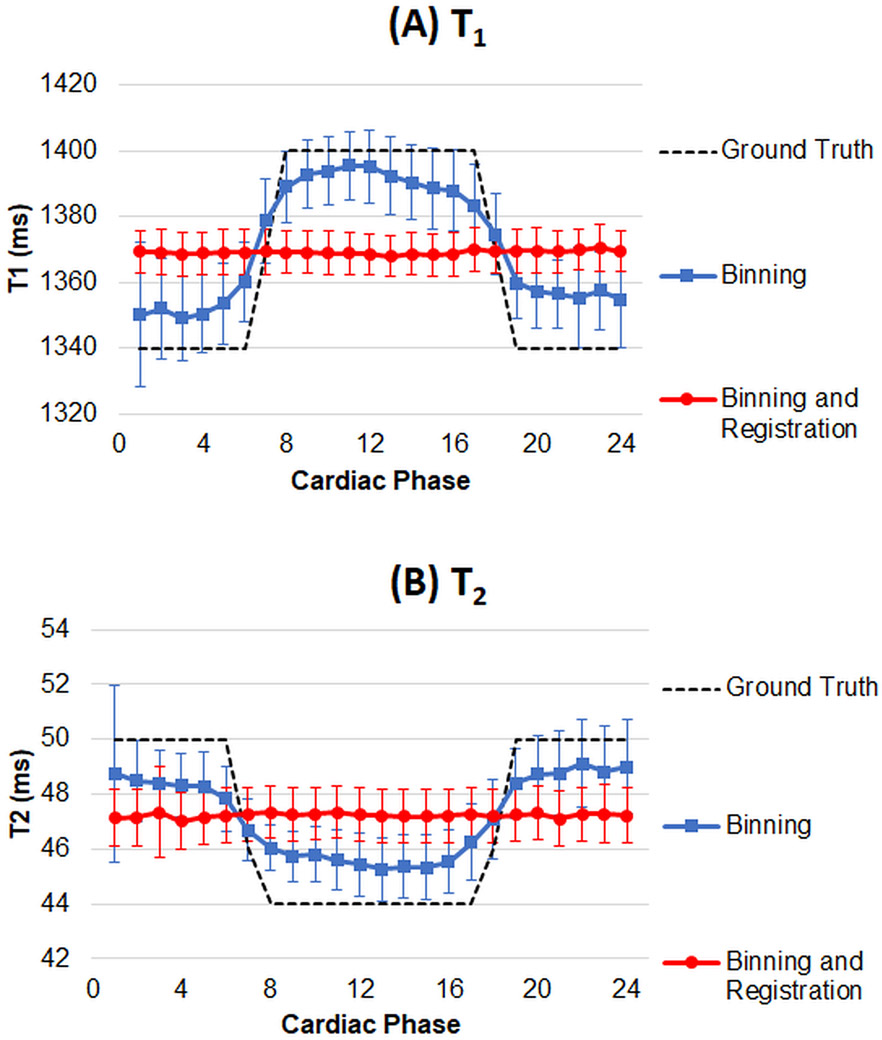
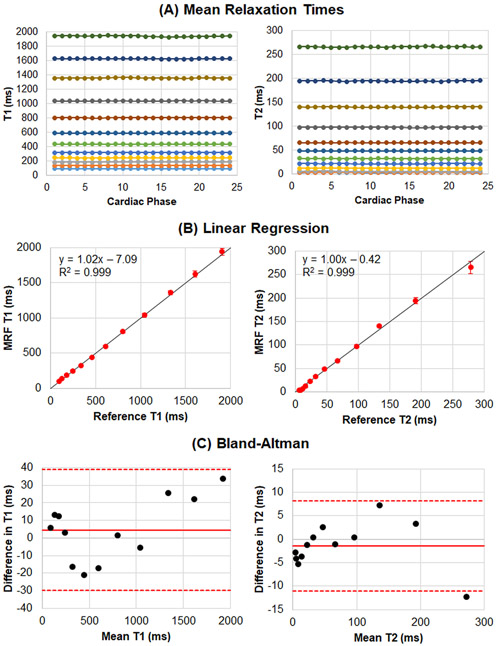
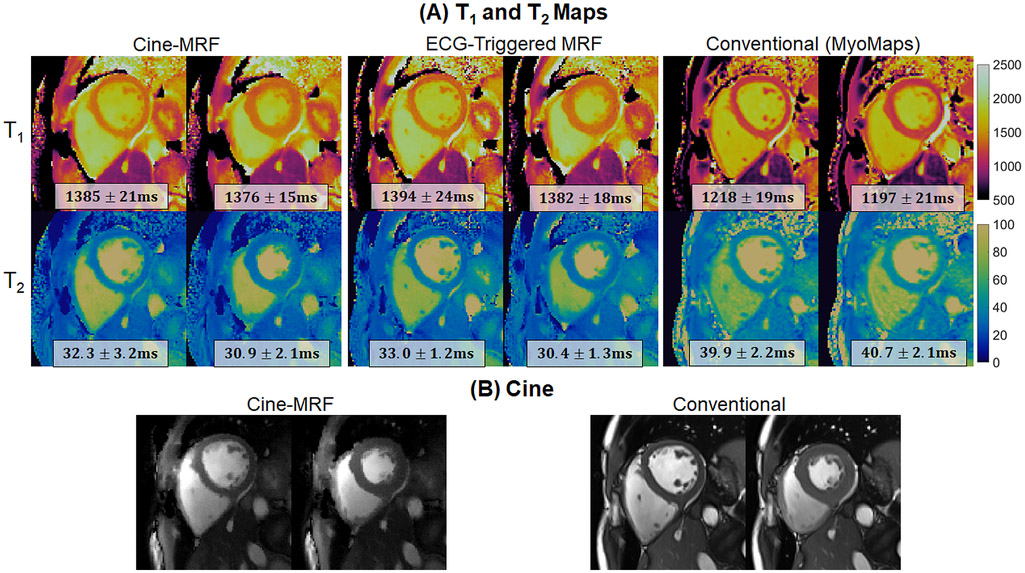
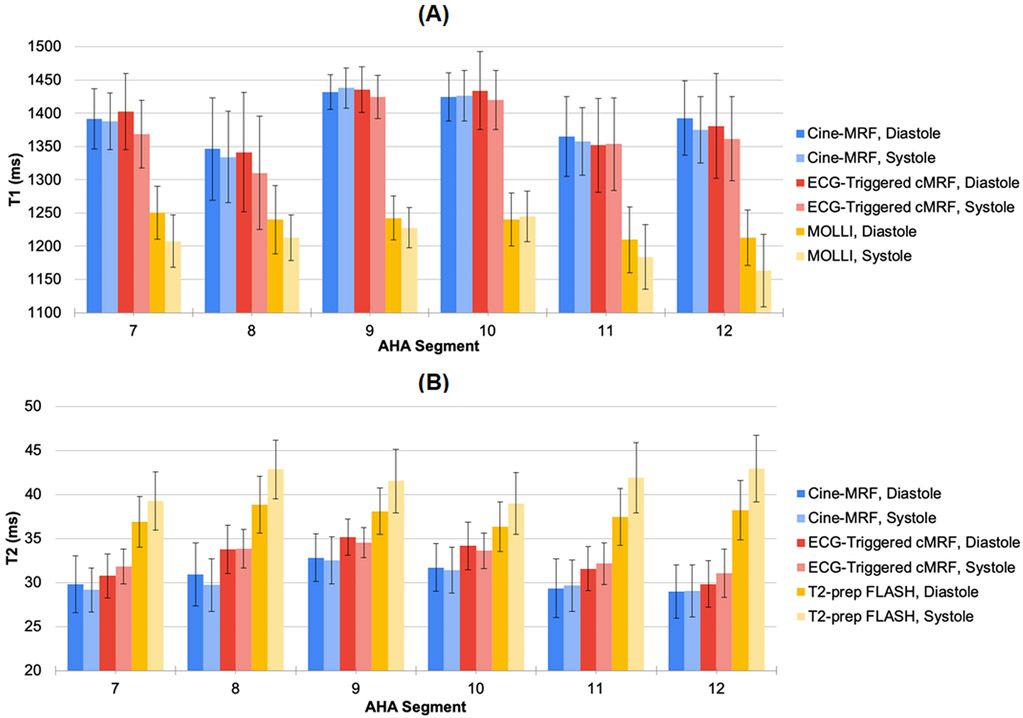
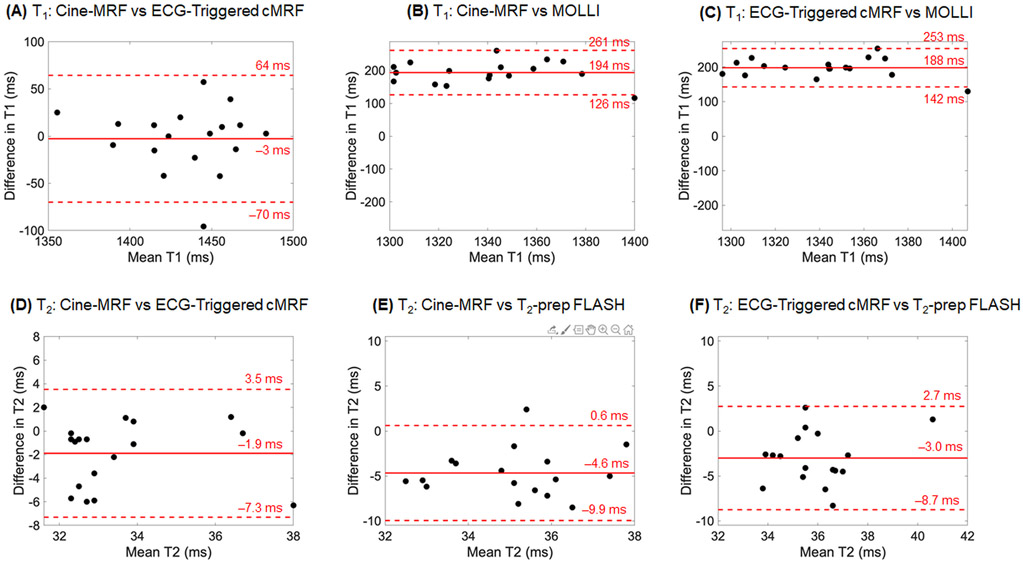
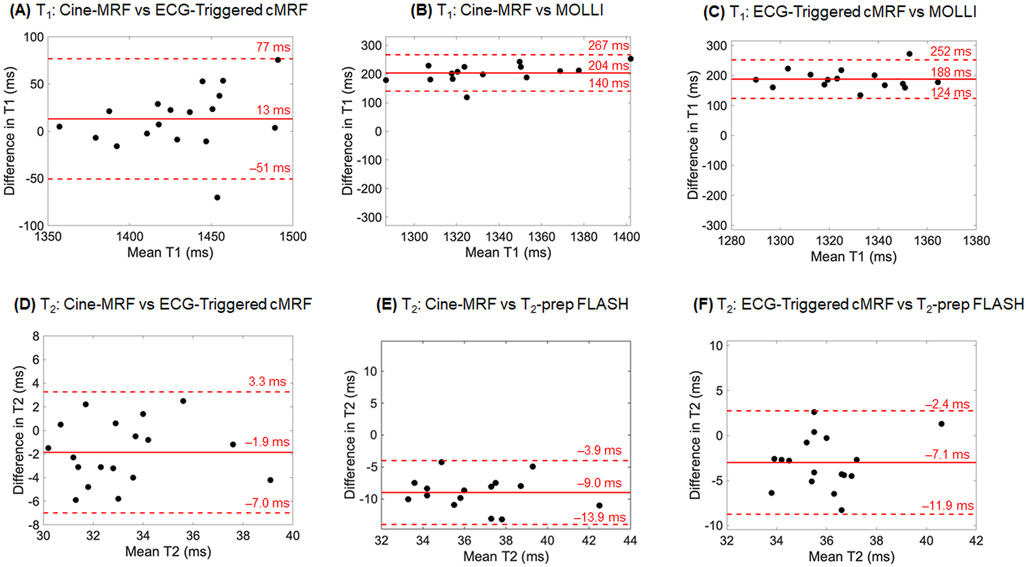
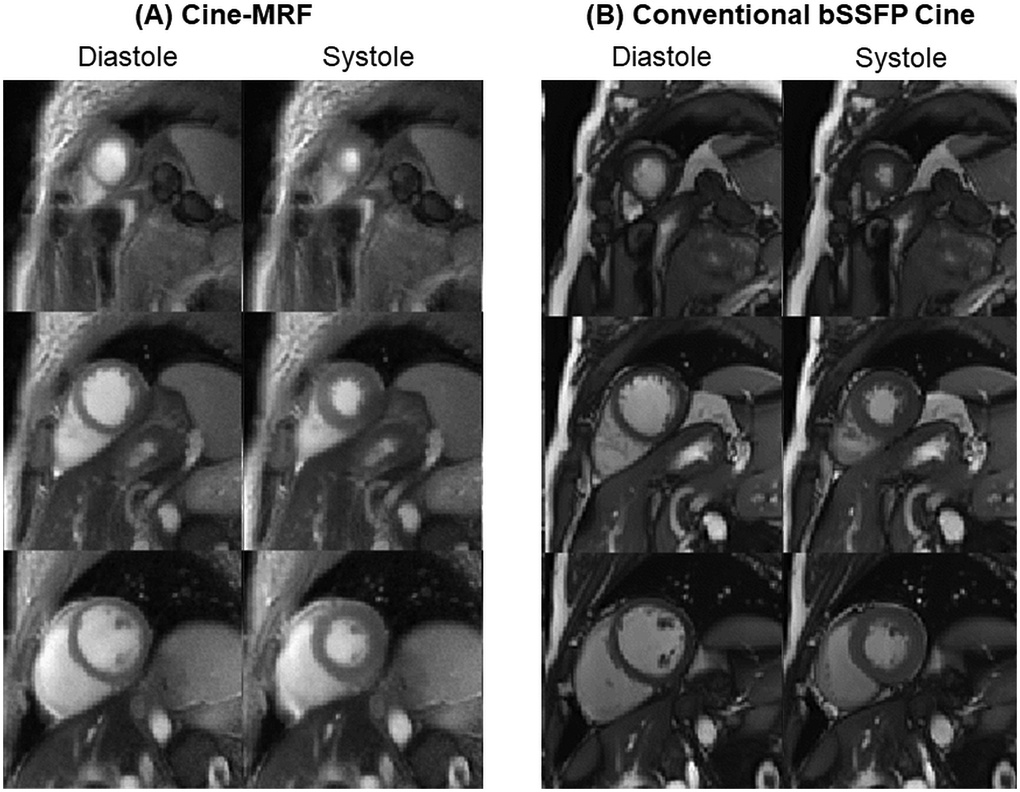
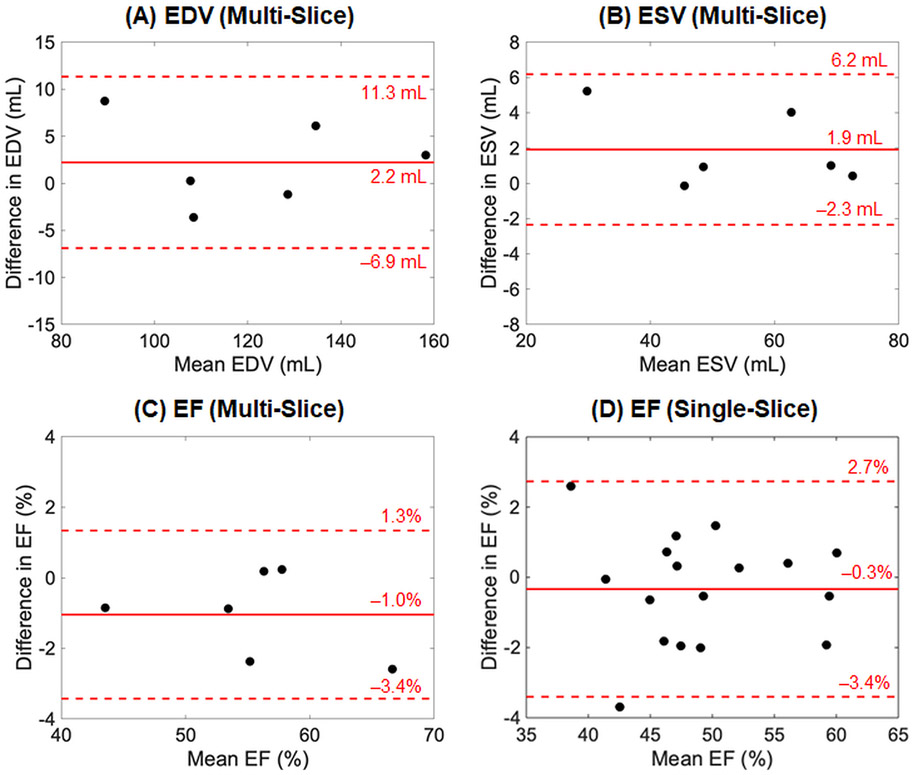
This study introduces a technique called cine magnetic resonance fingerprinting (cine-MRF) for simultaneous T1 , T2 and ejection fraction (EF) quantification. Data acquired with a free-running MRF sequence are retrospectively sorted into different cardiac phases using an external electrocardiogram (ECG) signal. A low-rank reconstruction with a finite difference sparsity constraint along the cardiac motion dimension yields images resolved by cardiac phase. To improve SNR and precision in the parameter maps, these images are nonrigidly registered to the same phase and matched to a dictionary to generate T1 and T2 maps. Cine images for computing left ventricular volumes and EF are also derived from the same data. Cine-MRF was tested in simulations using a numerical relaxation phantom. Phantom and in vivo scans of 19 subjects were performed at 3 T during a 10.9 seconds breath-hold with an in-plane resolution of 1.6 x 1.6 mm2 and 24 cardiac phases. Left ventricular EF values obtained with cine-MRF agreed with the conventional cine images (mean bias -1.0%). Average myocardial T1 times in diastole/systole were 1398/1391 ms with cine-MRF, 1394/1378 ms with ECG-triggered cardiac MRF (cMRF) and 1234/1212 ms with MOLLI; and T2 values were 30.7/30.3 ms with cine-MRF, 32.6/32.9 ms with ECG-triggered cMRF and 37.6/41.0 ms with T2 -prepared FLASH. Cine-MRF and ECG-triggered cMRF relaxation times were in good agreement. Cine-MRF T1 values were significantly longer than MOLLI, and cine-MRF T2 values were significantly shorter than T2 -prepared FLASH. In summary, cine-MRF can potentially streamline cardiac MRI exams by combining left ventricle functional assessment and T1 -T2 mapping into one time-efficient acquisition.

Keywords: cine, ejection fraction, low rank, magnetic resonance fingerprinting, myocardial tissue characterization, T1 mapping, T2 mapping.


Figures

Figure 1.
Figure 1.. Cardiac phase binning.
(A) The MRF spiral k-space readouts are retrospectively binned into different cardiac phases using an external ECG signal. Each RR interval is divided into 24 equally spaced bins, although only 3 are shown for clarity. Cine-MRF signal evolutions representative of myocardium (T1=1400ms/T2=50ms) and blood (T1=2000ms/T2=300ms) are also plotted. (B) A low-dimensional subspace is computed from the SVD of the MRF dictionary. The binned k-space data are projected onto this subspace and gridded to the image domain using the NUFFT. This work compresses the dictionary to rank 5, although only the first three (K=1 through K=3) subspace images are shown for clarity.
Figure 2.
Figure 2.. Low-rank reconstruction.
Subspace images are shown for several different cardiac phases (A) before and (B) after performing the low-rank reconstruction. For clarity, only three subspace images for four cardiac phases are shown. The low-rank reconstruction reduces the appearance of spiral undersampling artifacts.
Figure 3.
Figure 3.. Choice of temporal finite difference penalty in the low-rank reconstruction.
(A) Reconstructed subspace images are shown corresponding to the second singular value (K=2) in diastole and systole. The temporal finite difference penalty (λ2) is varied from 0 to 0.05, scaled relative to the maximum image intensity, and the spatial Wavelet penalty is fixed at λ1=0.001. When the temporal regularization penalty is too low (λ2=0 and λ2=0.001), the images are corrupted by residual artifacts and noise enhancement. However, when the regularization penalty is too large (λ2=0.05), there is temporal blurring along the cardiac motion dimension. A value of λ2=0.01 is used for all datasets in this work and provides a tradeoff between artifact reduction and temporal fidelity. (B) A line profile was drawn through the heart. (C) Plots of the line profile over all cardiac phases are shown. For small values of λ2, the profiles appear noisy but have good temporal fidelity. Temporal blurring is observed when λ2 is too large (λ2=0.05). A value of λ2=0.01 reduces noise and artifacts while preserving the temporal dynamics.
Figure 4.
Figure 4.. Image registration and pattern matching.
The leftmost panel shows reconstructed subspace images corresponding to the first three singular values (K=1 through K=3) for three cardiac phases. Phase 1 is in systole, while phases 2 and 3 are in diastole. Next, non-rigid deformation fields are used to register the images to the same phase. In this example, phase 3 is selected as the target phase. The registered images are then averaged over the cardiac phase dimension and matched to the dictionary to generate T1 and T2 maps. Additionally, the image corresponding to the second singular value (highlighted in orange) is used as a cine frame. Image registration and pattern matching are repeated, each time registering the reconstructed subspace images to a different cardiac phase to generate maps and cine images throughout the cardiac cycle.
Figure 5.
Figure 5.. Simulation results under conditions of constant ground truth T1 and T2.
(A) T1 and T2 maps are shown for representative diastolic and systolic frames. Results are shown for (top left) the ground truth, (top right) low-rank reconstruction with no motion binning, (bottom left) low-rank reconstruction using 24 cardiac phases, and (bottom right) low-rank reconstruction with 24 cardiac phases followed by non-rigid registration. Measures of accuracy (relative percent error in myocardial T1 and T2) and precision (coefficient of variation) are reported. (B) Image sharpness (i.e. apparent myocardial wall thickness) is plotted for each technique.
Figure 6.
Figure 6.. Simulation results under conditions with variable ground truth T1 and T2 throughout the cardiac cycle.
(A) The ground truth T1 increased from 1340ms in diastole to 1400ms in systole, (B) while the ground truth T2 decreased from 50ms in diastole to 44ms in systole. The ground truth values are plotted in black, the low-rank reconstruction with 24 cardiac phases is plotted in blue, and the low-rank reconstruction with 24 phases and non-rigid registration is plotted in red.
Figure 7.
Figure 7.. Cine-MRF results using the ISMRM/NIST MRI system phantom at 3T.
(A) Phantom T1 and T2 times are compared across cardiac phases. (B) Linear regression comparing reference values with relaxation times measured using cine-MRF averaged over all phases. The identity line is plotted in black, and the best-fit line and Pearson’s correlation are reported. (C) Bland-Altman plots comparing reference values with relaxation times measured using cine-MRF averaged over all phases. For T1, the bias is 4.6ms and 95% limits of agreement are (−29.8, 39.0)ms. For T2, the bias is −1.5ms and 95% limits of agreement are (−11.1, 8.2)ms.
Figure 8.
Figure 8.. Comparison of cine-MRF, ECG-triggered cardiac MRF, and conventional scans in a subject at 3T.
(A) Examples of cine-MRF T1 and T2 maps in diastole and systole are shown. For comparison, maps were also collected with ECG-triggered cMRF, MOLLI, and T2-prepared FLASH. The ECG-triggered scans were repeated twice with the scan window placed once in diastole and once in systole. (B) Examples of cine images derived from the cine-MRF scan (left) compared to a conventional cine (right). Although cine-MRF uses a FISP-based readout with variable sequence parameters and the conventional cine uses a bSSFP readout, the image contrast in both datasets is quite similar with blood appearing bright and myocardium appearing dark.
Figure 9.
Figure 9.. Relaxation times measured in each medial myocardial segment in healthy subjects at 3T.
The mean (A) T1 and (B) T2 values measured in different myocardial segments at a medial slice are presented for cine-MRF, ECG-triggered cMRF, and MyoMaps (MOLLI for T1 mapping and T2-prepared FLASH for T2 mapping). Results are shown for diastolic and systolic phases. The error bars indicate the standard deviation across subjects.
Figure 10.
Figure 10.. Bland-Altman plots comparing diastolic myocardial T1/T2 values.
These plots compare the mean T1 and T2 values measured in diastole with cine-MRF, ECG-triggered cMRF, and conventional mapping sequences (MOLLI for T1 mapping and T2-prepared FLASH for T2 mapping). The solid red lines depict the mean bias between any two methods. The dotted red lines show the 95% limits of agreement.
Figure 11.
Figure 11.. Bland-Altman plots comparing systolic myocardial T1/T2 values.
These plots compare the mean T1 and T2 values measured in systole with cine-MRF, ECG-triggered cMRF, and conventional mapping sequences (MOLLI for T1 mapping and T2-prepared FLASH for T2 mapping). The solid red lines depict the mean bias between any two methods. The dotted red lines show the 95% limits of agreement.
Figure 12.
Figure 12.. Intrasubject and intersubject variation for the in vivo study.
(A) Intrasubject variation, as quantified by the coefficient of variation (CV), are shown for each method in diastole and systole. (B) Intersubject variation for each method in diastole and systole are shown, as measured by the CV.
Figure 13.
Figure 13.. Cine images using cine-MRF and a standard balanced SSFP acquisition.
Cine frames during diastole and systole are shown for apical, medial, and basal slice positions acquired with (A) cine-MRF and (B) a standard bSSFP cine scan. The measured LV ejection fraction was 55.5% for cine-MRF and 54.0% for the standard cine.
Figure 14.
Figure 14.. Bland-Altman plots comparing measures of LV function between cine-MRF and a standard bSSFP cine scan.
Results are shown for (A) end-diastolic volume, (B) end-systolic volume, and (C) ejection fraction over the entire left ventricle for data collected from six healthy subjects. (D) Additionally, results are shown for single-slice ejection fraction measured at a medial slice position for data collected in 17 healthy subjects. The solid red lines indicate the mean bias, and the dotted red lines indicate the 95% limits of agreement.

Similar articles

Cited by

References

    1. Bogaert J, Dymarkowski S, Taylor AM, Muthurangu V. Clinical Cardiac MRI. 2nd ed. Springer-Verlag; Berlin Heidelberg; 2012.
    1. Hinojar R, Nagel E, Puntmann VO. T1 mapping in myocarditis - headway to a new era for cardiovascular magnetic resonance. Expert Rev Cardiovasc Ther. 2015;13(8):871–874. - PubMed
    1. Bull S, White SK, Piechnik SK, et al. Human non-contrast T1 values and correlation with histology in diffuse fibrosis. Heart. 2013;99(13):932–937. - PMC - PubMed
    1. Goldfarb JW, Arnold S, Han J. Recent myocardial infarction: assessment with unenhanced T1-weighted MR imaging. Radiology. 2007;245(1):245–250. - PubMed
    1. Okur A, Kantarcı M, Kızrak Y, et al. Quantitative evaluation of ischemic myocardial scar tissue by unenhanced T1 mapping using 3.0 Tesla MR scanner. Diagn Interv Radiol. 20(5):407–413. - PMC - PubMed

Publication types

LinkOut - more resources