

High-throughput, microscope-based sorting to dissect cellular heterogeneity
- PMID: 32500953
- PMCID: PMC7273721
- DOI: 10.15252/msb.20209442
High-throughput, microscope-based sorting to dissect cellular heterogeneity
Abstract
Microscopy is a powerful tool for characterizing complex cellular phenotypes, but linking these phenotypes to genotype or RNA expression at scale remains challenging. Here, we present Visual Cell Sorting, a method that physically separates hundreds of thousands of live cells based on their visual phenotype. Automated imaging and phenotypic analysis directs selective illumination of Dendra2, a photoconvertible fluorescent protein expressed in live cells; these photoactivated cells are then isolated using fluorescence-activated cell sorting. First, we use Visual Cell Sorting to assess hundreds of nuclear localization sequence variants in a pooled format, identifying variants that improve nuclear localization and enabling annotation of nuclear localization sequences in thousands of human proteins. Second, we recover cells that retain normal nuclear morphologies after paclitaxel treatment, and then derive their single-cell transcriptomes to identify pathways associated with paclitaxel resistance in cancers. Unlike alternative methods, Visual Cell Sorting depends on inexpensive reagents and commercially available hardware. As such, it can be readily deployed to uncover the relationships between visual cellular phenotypes and internal states, including genotypes and gene expression programs.
Keywords: genetic screening; microscopy; pharmacology; subcellular localization; transcriptomics.
© 2020 The Authors. Published under the terms of the CC BY 4.0 license.
Conflict of interest statement
The authors declare that they have no conflict of interest.
Figures
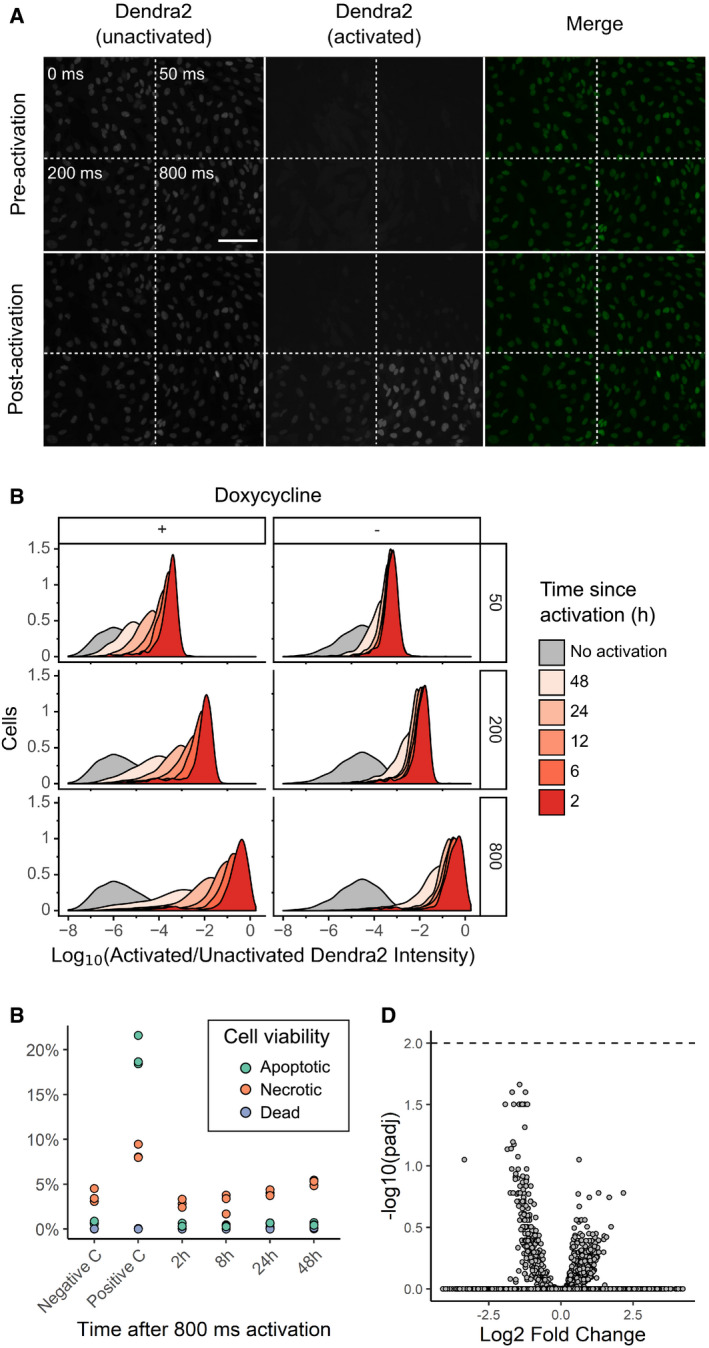
RPE‐I cells expressing NLS‐Dendra2 × 3 were imaged in the unactivated and activated Dendra2 channels; then left unactivated or activated for 50, 200, or 800 ms; and re‐imaged. Scale bar = 100 μm
U‐2 OS cells expressing H3‐Dendra2 under the control of a doxycycline‐inducible promoter were activated with 405 nm light for 50, 200, or 800 ms; incubated for various lengths of time; and then subject to flow cytometry to determine the degree of activated Dendra2 (left panel). To examine whether shutting off Dendra2 expression before the experiment increases photoactivation ratio stability, the experiment was repeated, but doxycycline was removed from the media before cells were placed under the microscope (right panel)
To examine the effect of Dendra2 photoactivation on cell viability, cells were activated for 800 ms, and then, apoptosis, necrosis, and death were assessed by flow cytometry using DAPI and Annexin V (n = 10,000 cells). Negative C, no photoactivation. Positive C, incubation of cells at 50 C for 10 min. The results of three independent replicates are shown.
To test whether Dendra2 photoactivation affects gene expression, cells were activated for 800 ms, incubated for 0.5, 1.5, 2.5, 3.5, 4.5, or 6 h, and subsequently subject to bulk RNA seq. Samples were compared to two separate replicates of unactivated cells. Volcano plot of differentially expressed genes shown. Dotted line, adjusted P‐value of 0.01.
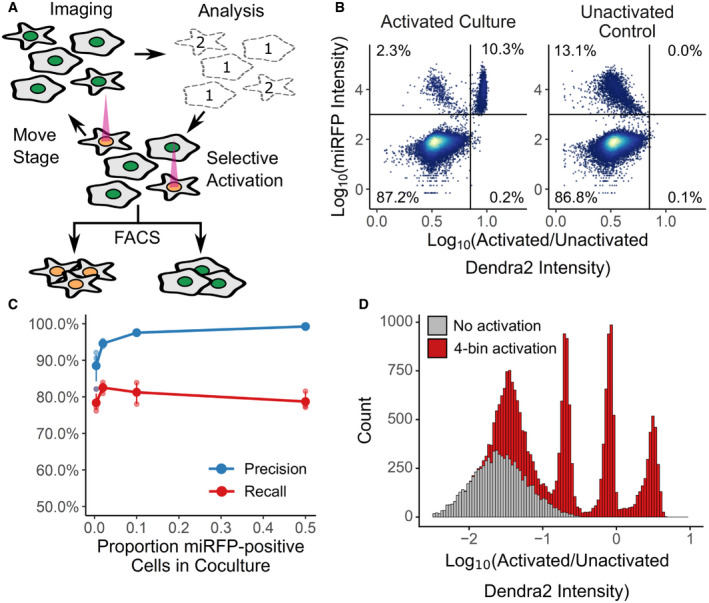
In an automated fashion, cells in a field of view are imaged and their phenotype classified. Cells of interest are illuminated with 405 nm light, which irreversibly photoactivates Dendra2 from its green to its red fluorescent state. The microscope then moves to a new field of view. These steps are repeated across an entire culture well. Then, fluorescence‐activated cell sorting based on Dendra2 photoactivation is used to physically recover cells of interest.
To assess the photoactivation accuracy, U‐2 OS cells expressing nuclear Dendra2 and miRFP, or nuclear Dendra2 alone, were co‐cultured. The microscope was programmed to activate Dendra2 in cells expressing miRFP. Following photoactivation, miRFP expression and the ratio of activated to unactivated Dendra2 (left panel, n = 18,766 cells) were assessed with flow cytometry. In a second co‐culture, Dendra2 was unactivated (right panel, n = 18,395 cells). Lines indicate gates for miRFP‐positive cells and activated Dendra2 cells, with the percentage of cells appearing in each quadrant indicated.
Same experiment as (B), except cells were mixed such that 0.5%, 4%, 12%, or 50% were miRFP positive. Precision and recall were computed; large solid points, mean (n = 3 replicates); small points, individual replicate values; error bars, standard error from the mean.
U‐2 OS cells in one well were illuminated with 405 nm light for 0, 50, 200, or 800 ms (red; n = 16,397). Cells in a second well were left unactivated (gray; n = 8,497). The ratio of activated to unactivated Dendra2 was determined by flow cytometry.
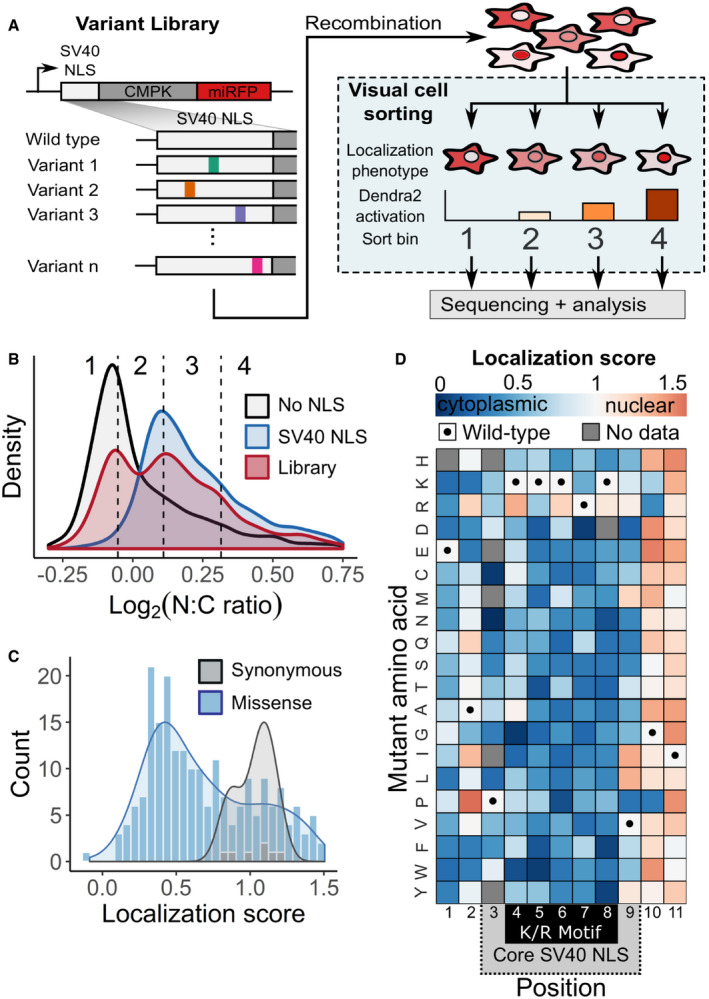
A mutagenized simian virus (SV) 40 NLS library containing 346 unique nucleotide variants fused to a chicken muscle pyruvate kinase (CMPK) miRFP reporter was recombined into a U‐2 OS H3‐Dendra2 cell line. Visual Cell Sorting was performed to separate the NLS library expressing cells into four photoactivation bins according to the microscope‐derived nucleus‐to‐cytoplasm ratio of the miRFP reporter. Each bin was deeply sequenced and analyzed to assign each amino acid variant a quantitative nuclear localization score.
U‐2 OS H3‐Dendra2 cells expressing either the NLS library, a wild‐type control, or a no NLS control were imaged at 20× magnification and nucleus‐to‐cytoplasm (N:C) ratios measured. Curves, estimated kernel density of cells (n = 1,529, 3,269, and 3,931 cells for no NLS, SV40 NLS, and WT NLS, respectively); dotted lines, Visual Cell Sorting photoactivation gates with associated bin numbers.
Raw variant nuclear localization scores were calculated using a scaled weighted average of variant frequencies across the four sort bins. WT‐like variants have a score of 1 and cytoplasm‐localized variants a score of 0. Localization score, mean values of normalized scores from 5 replicates (n = 637,605 cells); curves, kernel density estimate of variant score distributions.
Nuclear localization scores of missense variants (n = 202) displayed as a heatmap. Gray boxes, variants not observed or scored in a single replicate; black dots, WT sequence; dotted gray area on the horizontal axis, SV40 NLS often used to localize recombinant proteins to the nucleus; black box, the five residue K/R‐rich region.

Image analysis pipeline to calculate nucleus‐to‐cytoplasm (NC) ratio. Nuclei were segmented using the H3‐Dendra2 signal. Cytoplasmic masks were created by dilating and then removing the nuclear mask. Mean miRFP intensity was measured within each mask, and the nucleus‐to‐cytoplasm (N:C) ratio calculated.
After selective photoactivation on the microscope based on N:C ratio, cells were subject to fluorescence‐activated cell sorting and sorted according to their nuclear localization phenotype. Two days after sorting, cells from each sort bin were re‐imaged in the miRFP channel and the nucleus‐to‐cytoplasm ratio reassessed (n = ˜1,500 per photoactivation bin). Center line, median; box limits, 1st and 3rd quartiles; whiskers, 1.5× interquartile range; points, outliers. R1T2, recombination replicate 1, Visual Cell Sorting technical replicate 2.
Representative images of sorted cells.
Correlation plots of normalized scores calculated for each replicate. r 2, square of Pearson's correlation coefficient.
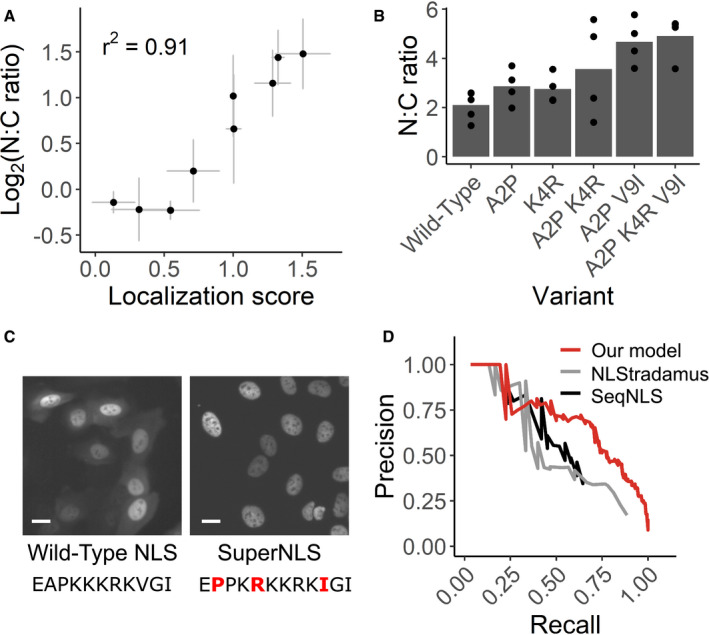
Nine NLS variants were individually expressed in the CMPK‐miRFP reporter in U‐2 OS H3‐ Dendra2 cells. The median nucleus‐to‐cytoplasm (N:C) ratio of cells expressing each variant was measured by microscope and compared to its localization score derived by Visual Cell Sorting. n ≥ 141 cells per variant per replicate. Bars, mean across at least three separate replicates.
SV40 NLS variants that appeared to enhance nuclear localization were individually tested both alone and in combination. NLS variants with up to three amino acid changes were expressed in U‐2 OS H3‐Dendra2 cells and imaged; the median N:C ratio was quantified across cells in the same well. n ≥ 527 cells per variant per replicate.
Representative images from cells expressing the wild‐type SV40 NLS or the optimized superNLS fused to the miRFP reporter. Scale bars = 20 μm; red letters, amino acid differences from the wild type construct.
Nuclear localization scores derived from Visual Cell Sorting were used to generate a predictive model that was trained on UniProt NLS annotations. Precision/recall curves for our model and two other linear motif scoring models, NLStradamus (Nguyen Ba et al, 2009) and SeqNLS (Lin & Hu, 2013), on a test dataset (n = 30 NLSs) are shown.
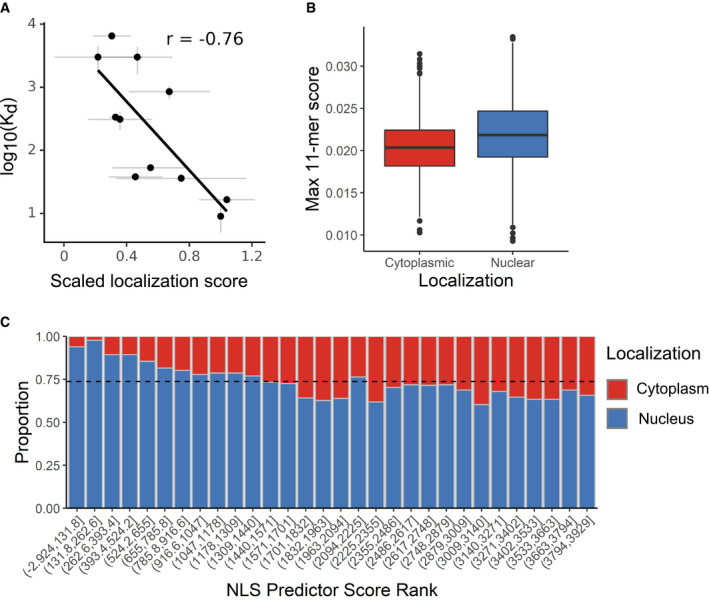
Dissociation constants measuring binding between SV40 NLS variants and importin alpha, as reported by Hodel et al (2001) were plotted against the variants’ mean normalized scores. Gray bars, standard error from the mean. r, Pearson's correlation coefficient.
All 11‐mers in proteins annotated as exclusively cytoplasmic or exclusively nuclear by the Human Protein Atlas were subject to our NLS prediction model; the top‐scoring 11‐mer within each protein was extracted for each group (n = 3,925 11‐mers; Wilcoxon rank sum P‐value < 10−16). Center line, median; box limits, 1st and 3rd quartiles; whiskers, 1.5× interquartile range; points, outliers.
Each protein's top‐scoring 11‐mer was ranked and binned according to its score (n = 131 proteins per bin). Dotted line, expected proportion of nuclear proteins per bin if the model has no predictive power.
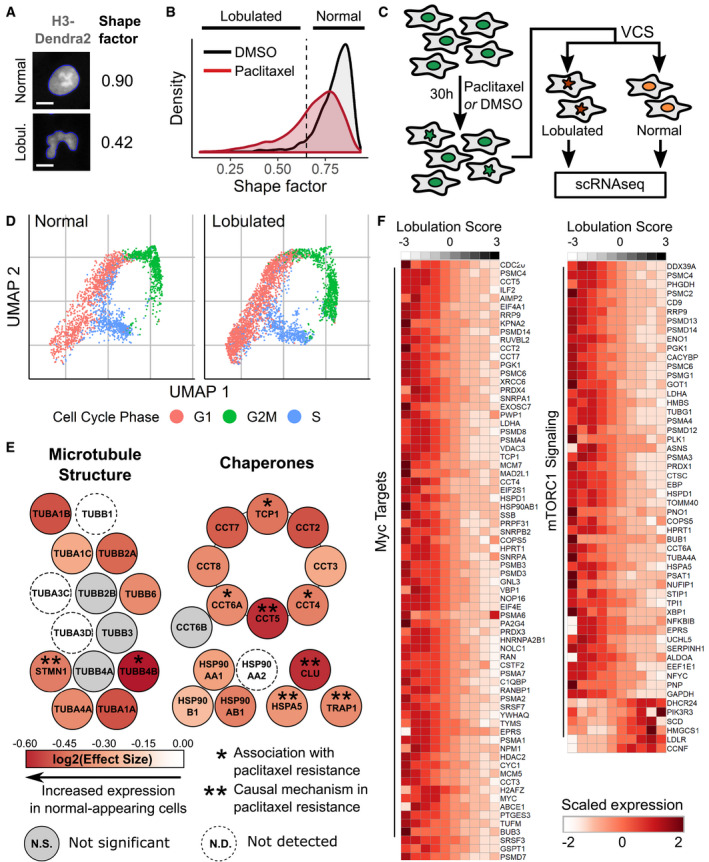
RPE‐1 NLS‐Dendra2 × 3 cells were treated for 24 h with 0.25 nM paclitaxel or DMSO and imaged. The shape factor, which measures the degree of an object's circularity, was computed for each nucleus. One normal nucleus with a shape factor near one and one lobulated nucleus with a low shape factor are shown. The computationally determined boundaries of each nucleus are shown in blue; scale bar = 10 μm.
Shape factor density plots for vehicle (DMSO) and 0.25 nM paclitaxel‐treated RPE‐1 cells (n ≥ 3,914 cells per treatment). Dashed line, cutoff for lobulated nuclei (shape factor < 0.65).
RPE‐1 cells were treated with 0.25 nM paclitaxel, then subjected to Visual Cell Sorting according to nuclear shape factor. Populations of cells with normal or lobulated nuclei were subjected separately to single‐cell RNA sequencing.
UMAP analysis of single‐cell RNA sequencing results of paclitaxel‐treated cells. Expression of cell cycle‐related genes was used to annotate each cell as being in G1, S, or G2/M.
A differential gene test was performed using as covariates cell cycle scores and a lobulation score, which is higher in lobulated cells compared to morphologically normal cells (Fig EV4D). Genes related to microtubule structure or various chaperone complexes are colored according to the expected log2 fold change per unit increase in lobulation score (effect size); asterisks, genes associated with paclitaxel resistance (Alli et al, 2007; Ooe et al, 2007; Di Michele et al, 2009; Su et al, 2009; Li et al, 2013; Dorman et al, 2016).
Expression counts for genes associated with c‐Myc and mTORC1 signaling were aggregated across cells binned according to their lobulation score, then log‐normalized and rescaled. Higher lobulation scores correspond to a higher likelihood of nuclear lobulation.
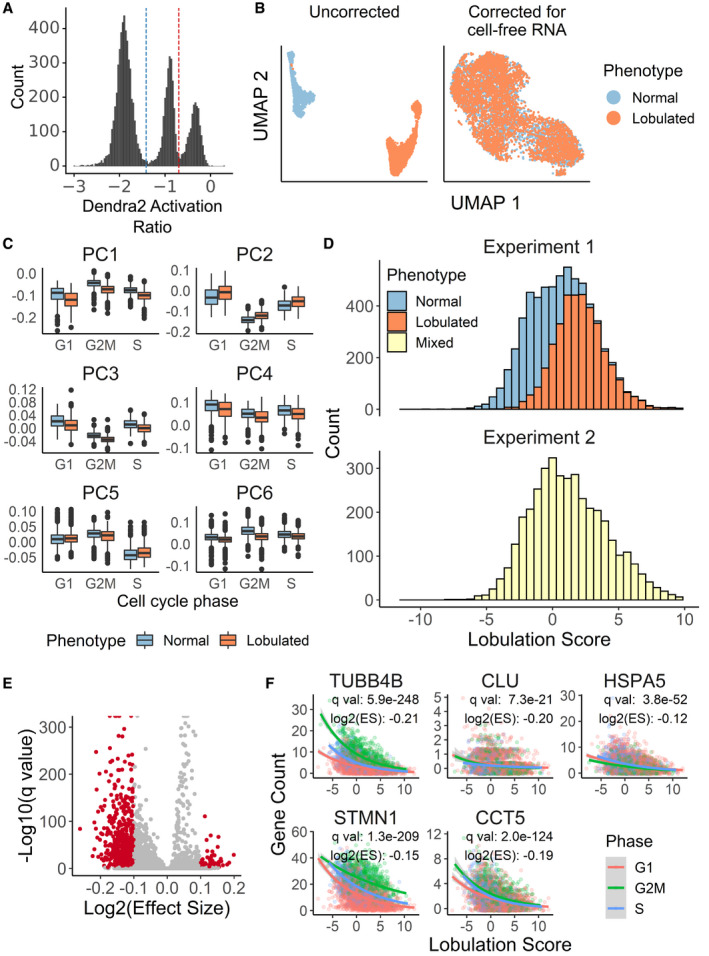
Photoactivation gates for Visual Cell Sorting. Cells between the blue and red dotted lines represent putative normal nuclear shape factor cells activated with 405 nm light for 200 ms; and cells above the red dotted line represent putative low nuclear shape factor (lobulated) cells activated for 800 ms. Cells below the blue dotted line were not imaged or not activated
UMAP projection of the single‐cell transcriptomes derived from Visual Cell Sorting‐separated lobulated and normal cells before and cell‐free RNA correction with the algorithm used by SoupX (preprint: Young & Behjati, 2018)
Visual Cell Sorting‐separated cells were aligned to an unseparated, paclitaxel‐treated population with the mutual nearest neighbors algorithm (Haghverdi et al, 2018). The first six principle components of the separated cells (n = 6,277), subset by nuclear phenotype and cell cycle stage, are shown. Center line, median; box limits, 1st and 3rd quartiles; whiskers, 1.5× interquartile range; points, outliers.
Lobulation scores were generated using linear combinations of principle components 1–4. Top, Visual Cell Sorting experiment (n = 6,277 cells); bottom, unseparated cell population (n = 3,859 cells).
Volcano plot showing DEGs significantly correlated with the lobulation score in the unseparated, paclitaxel‐treated population. Red points, significant DEGs with a log2 (Effect Size), which estimates the expected log2 fold change per unit increase in lobulation score, > 0.1 and a q‐value < 0.01.
Raw gene counts of selected significant DEGs of cells in the unseparated, paclitaxel‐treated population versus the cells’ lobulation scores. Colored lines, negative binomial regression model stratified by cell cycle stage; ES, effect size, the expected fold change in gene expression per unit increase in lobulation score.
Comment in
-
(Photo)convert to pooled visual screening.Mol Syst Biol. 2020 Jun;16(6):e9640. doi: 10.15252/msb.20209640. Mol Syst Biol. 2020. PMID: 32543109 Free PMC article.
References
-
- Alli E, Yang JM, Ford JM, Hait WN (2007) Reversal of stathmin‐mediated resistance to paclitaxel and vinblastine in human breast carcinoma cells. Mol Pharmacol 71: 1233–1240 - PubMed
-
- Beg AA, Ruben SM, Scheinman RI, Haskill S, Rosen CA, Baldwin AS (1992) IκB interacts with the nuclear localization sequences of the subunits of NF‐κB: a mechanism for cytoplasmic retention. Genes Dev 6: 1899–1913 - PubMed
Publication types
MeSH terms
Substances
Associated data
- Actions
Grants and funding
LinkOut - more resources
Full Text Sources
Other Literature Sources
Molecular Biology Databases
Research Materials
