. 2020 Jun 5:9:e56942.
doi: 10.7554/eLife.56942.

Flexible motor sequence generation during stereotyped escape responses

Affiliations

Flexible motor sequence generation during stereotyped escape responses

Yuan Wang et al. Elife. .

Abstract

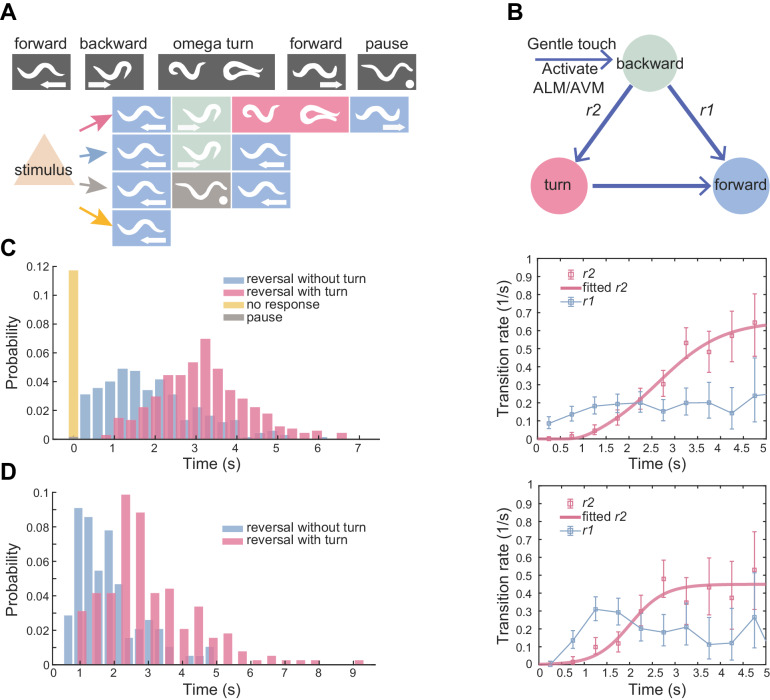
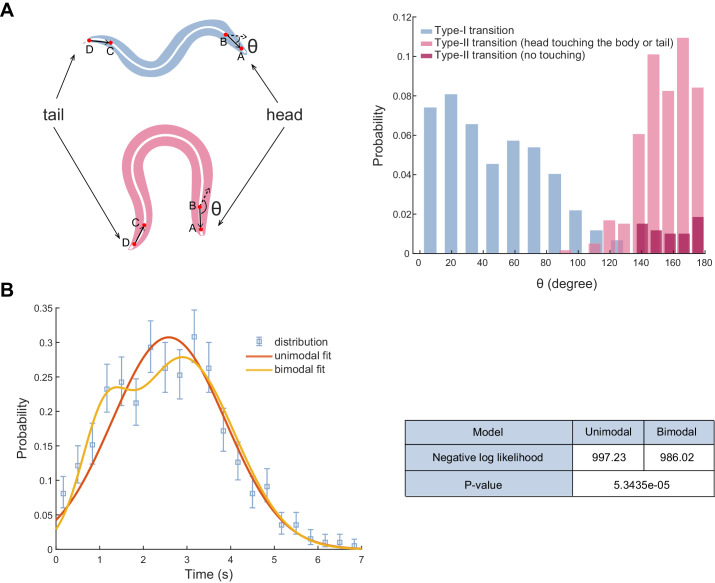
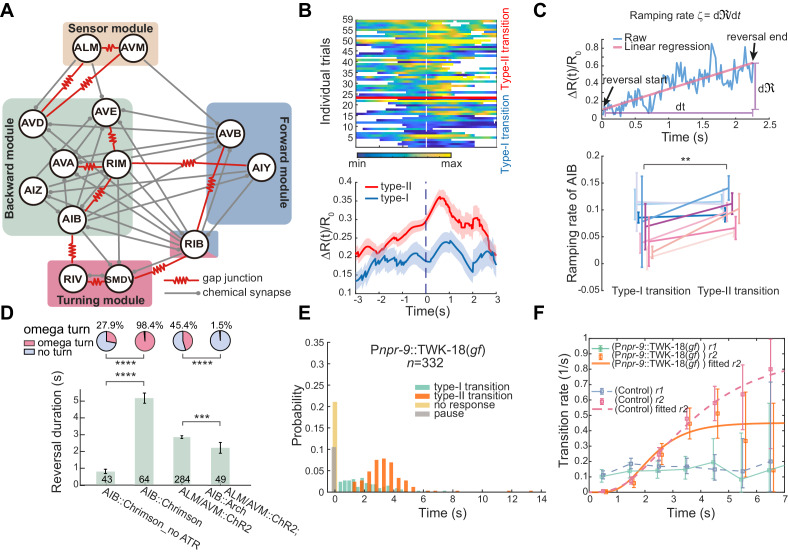
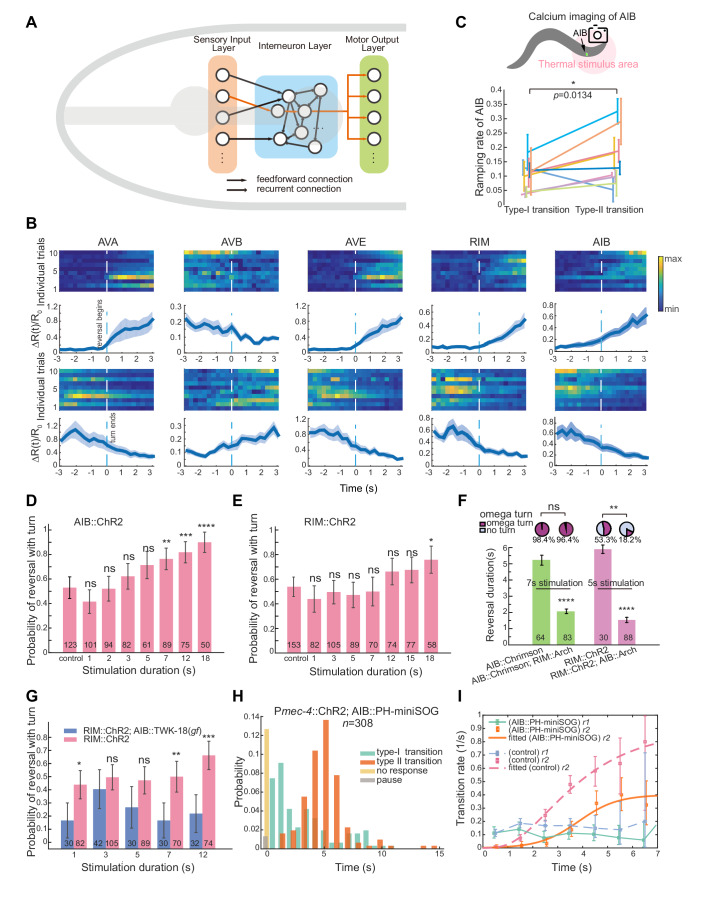
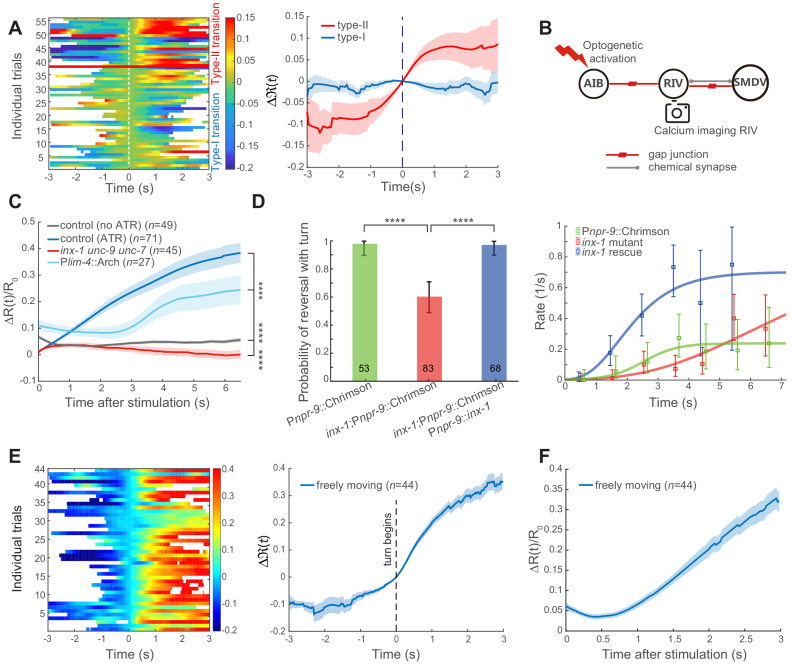
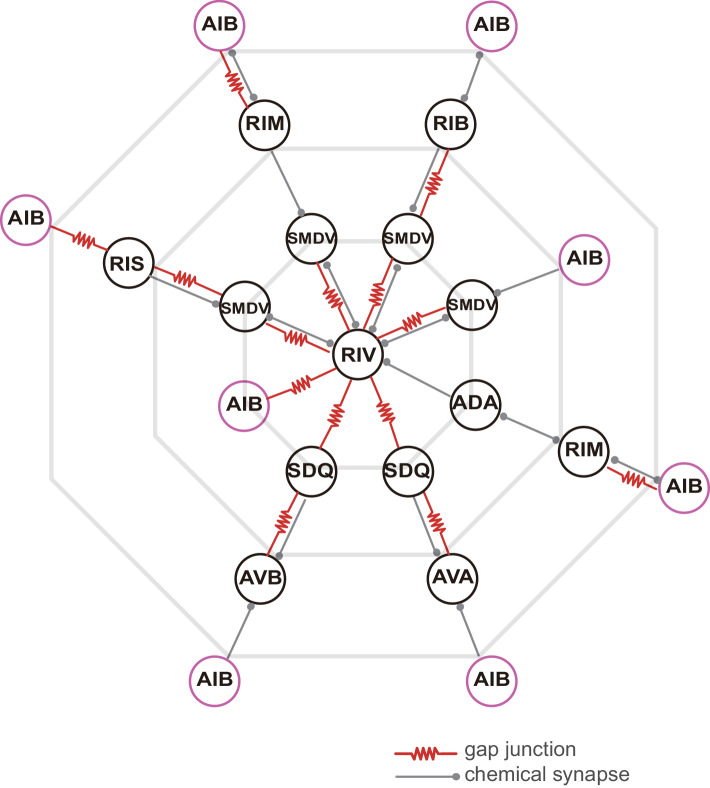
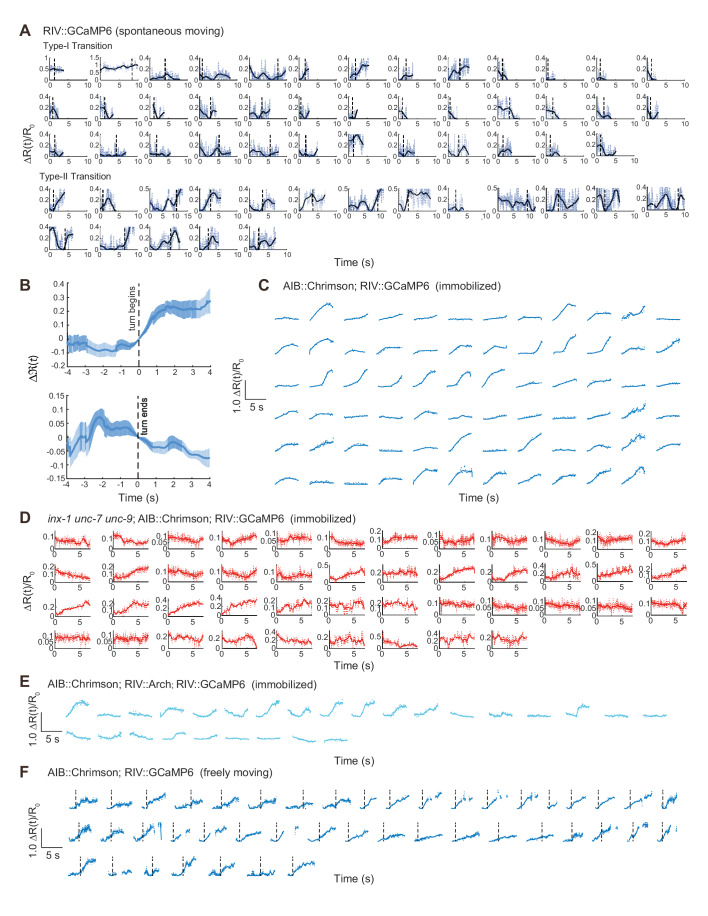
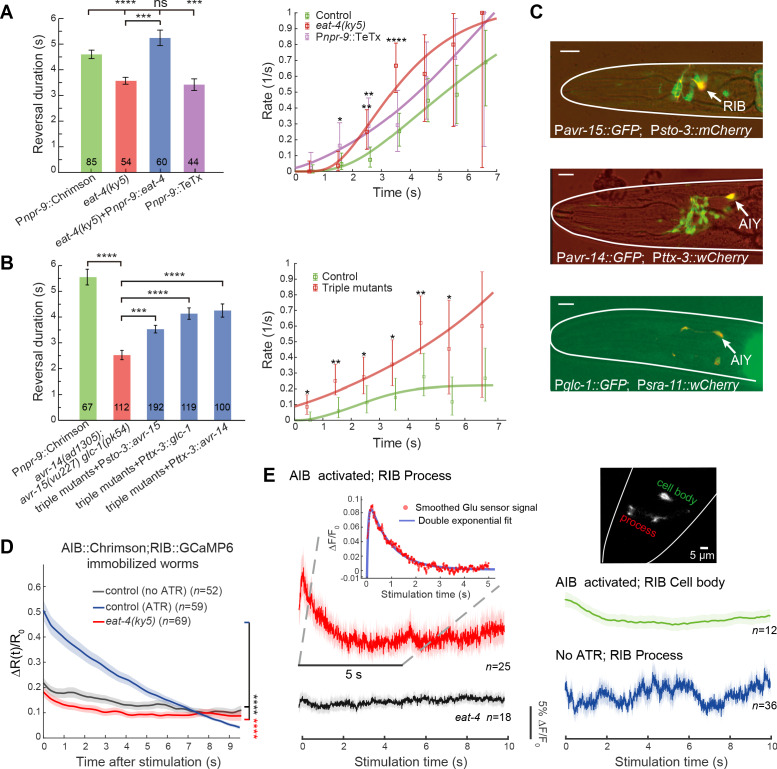
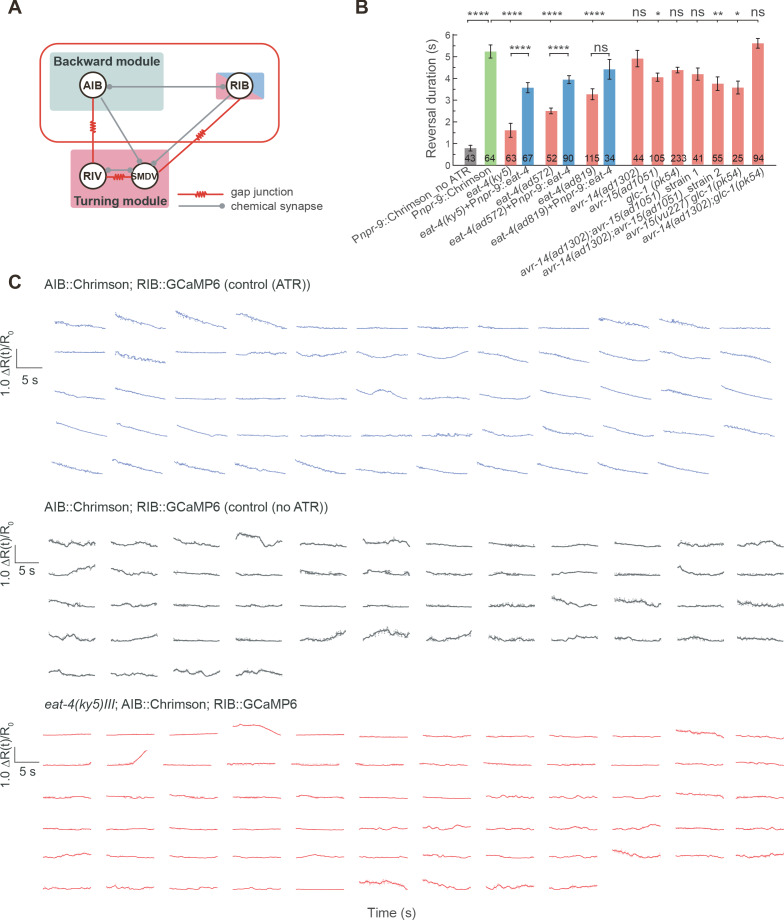
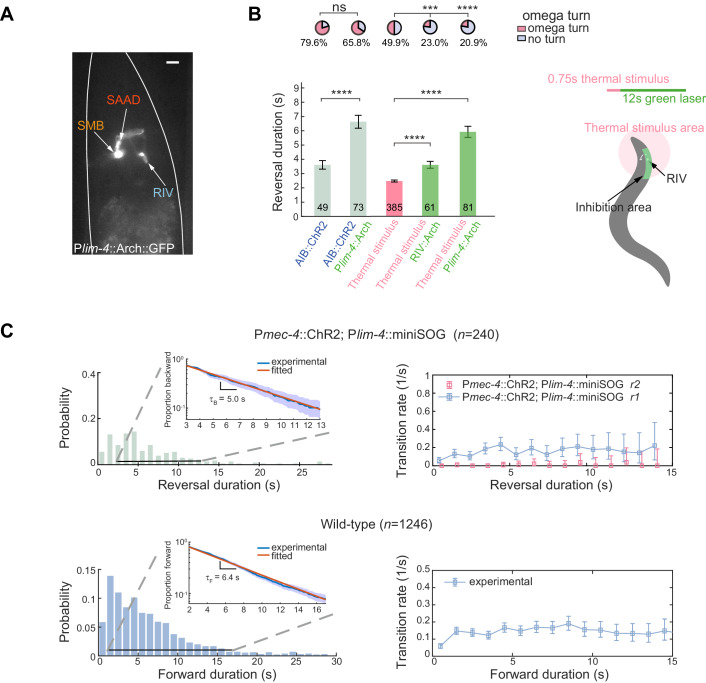
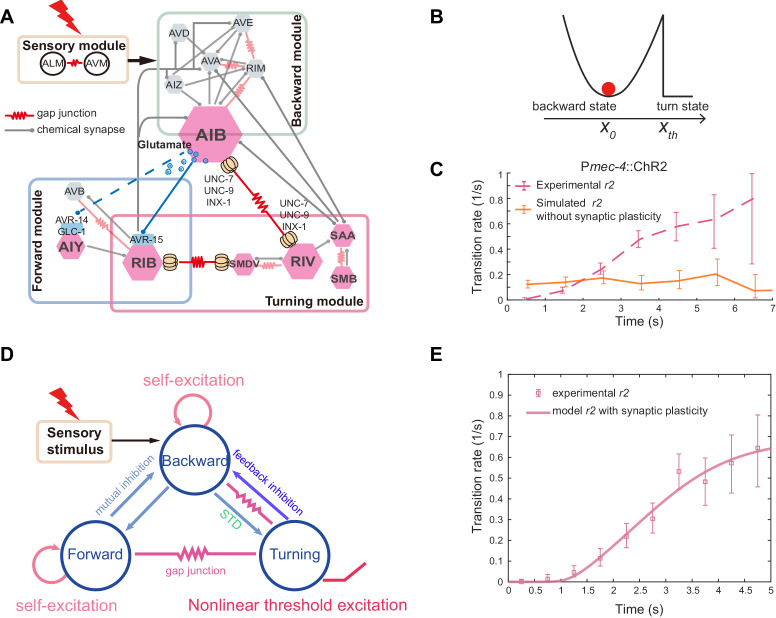
Complex animal behaviors arise from a flexible combination of stereotyped motor primitives. Here we use the escape responses of the nematode Caenorhabditis elegans to study how a nervous system dynamically explores the action space. The initiation of the escape responses is predictable: the animal moves away from a potential threat, a mechanical or thermal stimulus. But the motor sequence and the timing that follow are variable. We report that a feedforward excitation between neurons encoding distinct motor states underlies robust motor sequence generation, while mutual inhibition between these neurons controls the flexibility of timing in a motor sequence. Electrical synapses contribute to feedforward coupling whereas glutamatergic synapses contribute to inhibition. We conclude that C. elegans generates robust and flexible motor sequences by combining an excitatory coupling and a winner-take-all operation via mutual inhibition between motor modules.

Keywords: C. elegans; escape response; feedforward excitation; motor sequence generation; mutual inhibition; neuroscience; winner-take-all.


Conflict of interest statement

YW, XZ, QX, WH, JF, JH, TX, YX, MA, MZ, QW No competing interests declared

Figures

Figure 1.
Figure 1.. Flexible motor sequence generation during C. elegans escape responses.
(A) Optogenetic stimulation of mechanosensory neurons ALM/AVM (Pmec-4::ChR2) was carried out with blue light (473 nm, 4.63 mW/mm2) for 1.5 s during animal forward movement. Identical stimuli could induce four different behavioral outputs: reversal followed by an omega turn, reversal followed by forward movement, pause state or forward movement (no response). (B) Definitions of type-I and type-II transitions. (C) Reversal length distribution (left) and transition rates (right) during ALM/AVM (Pmec-4::ChR2) triggered escape responses. Total number of trials, n = 674; reversal without turn, n = 272; reversal with turn, n = 322; no response, n = 79; pause, n = 1. Number of animals used can be found in Supplementary file 4. Here and below, the error bars of transition rates represent 95% binomial proportion confidence interval. (D) Reversal length distribution (left) and transition rates (right) during thermal stimulus induced escape responses. Wild-type, n = 385. Animal heads were thermally stimulated by an infrared laser (1480 nm; 400 mA) for 0.75 s. Solid lines are theoretical fits using Equation 4 and fitted type-II transition rates pass goodness-of-fit test (p>0.05).
Figure 1—figure supplement 1.
Figure 1—figure supplement 1.. Definition of the type-II transition and statistical test of reversal length distribution.
(A) Left, examples of reorientation angle θ during the type-I (up) and the type-II transition (bottom). θ was measured as the angle between the head vector (BA) and the tail vector (DC). The worm body centerline was equally divided into 100 segments. The head vector (BA) is denoted as point B (mean coordinate of the 10th-14th segment) to A (mean coordinate of the 1st-5th segment), while the tail vector is denoted as point D (mean coordinate of 96th-100th segment) to C (mean coordinate of the 86th-90th segment). Immediately after the end of reversal, we identified a frame in which the worm exhibited a highly coiled body posture to calculate θ. If the head touched the body or tail, θ was computed from the frame before touching. Right, distribution of θ during ALM/AVM (Pmec-4::ChR2) triggered escape responses. A type-II transition was identified by either the head touching the body (or tail) or θ > 135° within a single head swing. Total trials, n=594; type-I transition, n=272; type-II transition (touching the body or tail), n=283; type-II transition (no touching), n=39. (B) A Gaussian mixture model to fit the reversal length distribution during ALM/AVM (Pmec-4::ChR2) triggered escape responses. We performed the likelihood ratio test between the unimodal Gaussian distribution fit and the bimodal Gaussian mixture model fit. After computing the difference of the negative log likelihoods, we found a p-value = 5.4e-5 using the χk2 distribution, where k = 3 is the difference of the number of free parameters in the unimodal (total 2 parameters) and bimodal (total 5 parameters) distribution. At level α=0.01, we have sufficient evidence that the bimodal distribution fits the reversal length better than the unimodal distribution.
Figure 2.
Figure 2.. Interneurons AIB are crucial for motor state transitions.
(A) Simplified circuit diagram underlying the gentle touch induced escape responses. Neurons were grouped into four modules based on their functional roles and activity patterns. (B) Calcium activity of AIB during spontaneous reversals before type-I (n = 23) and type-II (n = 36) transitions in unrestrained behaving animals (Pinx-1::GCaMP6;Pinx-1::wCherry). Here, data are aligned to the ends of reversals (vertical dashed line, t = 0). Heat map across trials (up) and ΔR(t)/R0 (Mean ± SEM, bottom) are shown. (C) Ramping rate of calcium activity in AIB. Up, raw single trial ΔR(t)/R0 from reversal start to reversal end. The ramping rate is the slope of the red line, fitted by linear regression. Bottom, ramping rates of AIB during type-I and type-II transitions. Each color (Mean ± SEM) represents single animal data across multiple trials. Total nine animals (Pinx-1::GCaMP6;Pinx-1::wCherry) were tested. Very short reversals (less than 1.5 s) are excluded, for some of them have negative ramping rates and the slope estimate is susceptible to noise (but including those trials doesn’t affect our conclusion). **p<0.01, two-way ANOVA. (D) Optogenetic activation of AIB (635 nm, 4.46 mW/mm2, 7 s) or inhibition of AIB (561 nm, 21.71 mW/mm2, 12 s) during ALM/AVM (473 nm, 14.71 mW/mm2, 1.5 s) triggered avoidance behaviors, reversal durations (bar graph) and fractions of animals executing omega turns (pie chart) are shown. Error bars are SEMs. Bar graph, Mann–Whitney U test. Pie chart, χ2 test. *p<0.05, ***p<0.001, ****p<0.0001. Here and below, the actual turning percentages (nturn/ntotal) are noted beside the pie chart and numbers within the bars indicate the number of trials with reversal. (E–F) Reversal length distribution (E) and transition rates (F) during escape responses when AIB were persistently hyperpolarized through an exogenous expression of the potassium channel TWK-18. Control group is from Figure 1C.
Figure 2—figure supplement 1.
Figure 2—figure supplement 1.. Local interneurons AIB and RIM in the backward module differentially modulate motor state transitions.
(A) Schematic diagram of the C. elegans nervous system. (B) Multi-neuron calcium imaging in freely behaving animals (Pnmr-1/Plim-4/Plgc-55/Pnpr-9::NLS::wCherry::SL2::GCaMP6). Interneurons in the backward and forward modules were simultaneously imaged using a confocal microscopy (see Materials and methods for details). Data are aligned to the onset of a reversal (up, vertical dashed lines, t = 0) or the end of a turn (bottom, vertical dashed lines, t = 0). Heat map across trials and ΔR(t)/R0 (Mean ± SEM) across trials are shown. (C) Ramping rate of AIB calcium activity during thermally-induced escape responses. Ramping rate is significantly higher in type-II transition (nine animals, each point has more than three trials). *p<0.05, two-way ANOVA. (D–E) Characterization of the probability of type-II transition during optogenetic stimulation of two different interneurons AIB (left) and RIM (right) for varying durations. Longer activation of AIB consistently led to a higher probability of type-II transition (left). The control groups are animals performing spontaneous motor state transitions without optogenetic stimulation. A blue laser (473 nm, 14.71 mW/mm2) was used to stimulate ChR2 expressed neurons. (F–G) Hyperpolarization of RIM (Ptdc-1::Arch) or AIB (Pnpr-9::Arch) both affected reversal duration (bar graph), but only inhibiting AIB affected the probability of type-II transition (pie chart). In F), simultaneous optogenetic activation of AIB (or RIM) (635 nm, 4.46 mW/mm2 for AIB or 473 nm, 14.71 mW/mm2 for RIM) and inhibition (561 nm, 6.80 mW/mm2) of RIM (or AIB) were carried out for 7 (or 5) seconds. In G), RIM were activated for varying durations, while AIB were inactivated through an exogenous expression of the potassium channel TWK-18. (H–I) Reversal length distribution and transition rates after optogenetic ablation of AIB. ALM/AVM were optogenetically activated for 1.5 s to trigger avoidance behavior. AIB were ablated by exogenous expression of a membrane targeted PH-miniSOG. Data from Figure 1C) are used as control. For reversal duration, error bars indicate SEMs. Mann–Whitney U test. For probability of turn, error bars indicate 95% binomial proportion confidence interval. χ2 test. *p<0.05, **p<0.01, ***p<0.001, ****p<0.0001. All multiple comparisons were adjusted using Bonferroni correction.
Figure 3.
Figure 3.. Feedforward excitation via electrical coupling drives omega turns.
(A) Calcium activity of RIV during the type-I (n = 38) and the type-II (n = 18) transitions in spontaneous behaving animals (Plim-4::GCaMP6). Here, data are aligned to the ends of reversals (vertical dashed line, t = 0). Heat map across trials (left) and ΔR(t) (Mean ± SEM, right, also see Materials and Methods) are shown. (B) Optical neurophysiology for probing the feedforward coupling between the backward module and the turning module. (C) Simultaneous optogenetic activation of AIB (635 nm, 6.11 mW/mm2) and calcium imaging of RIV in immobilized animals. ΔR(t)/R0 (Mean ± SEM) under different genetic backgrounds are shown: control (ATR) is wild-type (dark blue); inx-1unc-9unc-7 triple mutant (red); calcium imaging of RIV in the presence of moderate inhibition (561 nm, 1.94 mW/mm2) of RIV (light blue, Plim-4::Arch). The control (no ATR) represents imaging data from wild-type animals without feeding all-trans retinal (grey). ****p<0.0001, two-way ANOVA. (D) Probability of a reversal followed by a turn (left) and type-II transition rates (right) for gap junction deficient mutants. AIB, expressing Chrimson, were optogenetically activated for 7 s (635 nm, 4.46 mW/mm2) in wild-type animals (green), gap junction deficient mutants inx-1 (red), and inx-1 mutants, in which INX-1 channels were restored specifically in AIB (blue). Error bars indicate 95% binomial proportion confidence interval. χ2 test. ****p<0.0001. (E) Simultaneous optogenetic activation of AIB (635 nm, 6.11 mW/mm2) and calcium imaging of RIV in unrestrained behaving animals. Left, calcium activity heatmap across trials. t < 0 represents reversals. Omega turns start at t = 0. Right, ΔR(t) (mean ± SEM) are shown (blue). (F) Data are related to (E), but t = 0 is aligned to the beginning of AIB stimulation.
Figure 3—figure supplement 1.
Figure 3—figure supplement 1.. Possible polysynaptic pathways from AIB to RIV (less than four layers are shown) according to C. elegans connectome.
SDQ were oxygen-sensing neurons and topological cluster analyses suggest ADA may be involved in chemosensation. RIM, RIS and RIV have direct electrical coupling with AIB.
Figure 3—figure supplement 2.
Figure 3—figure supplement 2.. Optogenetic activation of AIB and calcium imaging of RIV in different experimental conditions.
(A and C–F) Single trial data related to Figure 3A, (C and E–F). In (F), dashed lines indicate the start of a turn. (B) Calcium activity of RIV (Plim-4::GCaMP6, n = 20) during thermal stimulus induced escape responses in freely moving animals. ΔR(t) = [ΔR(t) - ΔR(t = 0)]/R0 (mean ± SEM) are shown. t = 0 is aligned to the initiation (up) or termination (bottom) of an omega turn.
Figure 4.
Figure 4.. Glutamatergic inhibition modulates type-II transition.
(A) Reversal durations (left) and type-II transition rates (right) in glutamatergic synaptic transmission deficient animals upon strong and persistent optogenetic activation of AIB. Optogenetic stimulation was delivered for 7 s using red light (635 nm, 4.46 mW/mm2). Right, compare r2 in eat-4 mutant or in Pnpr-9::TeTx with control animals across the whole distribution (Kolmogorov-Smirnov test, p=6.2e-7, p=0.0026) or within a time window (χ2 test: * p<0.05, ** p<0.01, *** p<0.001, **** p<0.0001). (B) Reversal durations (left) and type-II transition rates (right) in GluCl receptor mutants upon optogenetic activation of AIB (635 nm, 4.46 mW/mm2). Right, compare r2 in triple receptor mutant with control animals across the whole distribution (Kolmogorov-Smirnov test, p=5.9e-8) or within a time window (χ2 test: * p<0.05, ** p<0.01). (C) Genes encoding GluCl receptors were expressed in local interneurons RIB and AIY respectively. GFP reporter lines were constructed using avr-14, avr-15 and glc-1 promoters, respectively; mCherry (or wCherry) reporters were used for cell identification. Expression pattern from one section is showed. Scale bar, 10 µm. (D) Simultaneous optogenetic activation of AIB (635nm, 6.11 mW/mm2) and calcium imaging of RIB in immobilized animals under wide-type (control (ATR)) (blue) or eat-4 glutamate deficient mutant background (red). ΔR(t)/R0 (Mean ± SEM) are shown. t = 0 represents the beginning of AIB stimulation. The control group (no ATR) (grey) represents imaging data from animals without feeding all-trans retinal. ****p<0.0001, two-way ANOVA. (E) Functional coupling between AIB and RIB neurons was directly tested through glutamate imaging. Upon stimulation of AIB (Pnpr-9::Chrimson), the process (red), cell body (green) of the RIB (Psto-3::iGluSnFR) and the RIB process in eat-4 glutamate deficient mutants (grey) exhibited distinct fluorescence signals. The control group (blue) represents imaging data from animals without feeding all-trans retinal. Raw iGluSnFR imaging was recorded at 150 Hz. Trial average (bold color) and SEM (shaded region) are shown. Inset, the fluorescence signal of the process (red) is fitted with a double exponential function (blue), B(e-tτ1-e-tτ2)+c, where B, τ1,τ2 and c are free parameters. τ1 represents the time constant of glutamate signal decay, and c is the baseline constant, which was subtracted in the inset plot. For reversal duration, Error bars indicate SEM. Mann–Whitney U test: ***p<0.001, ****p<0.0001. All multiple comparisons were adjusted using Bonferroni correction.
Figure 4—figure supplement 1.
Figure 4—figure supplement 1.. Glutamatergic inhibitions between AIB and RIB flexibly control the motor state transitions.
(A) Couplings between the backward, forward and turning modules. AIB, RIV and RIB are highlighted. (B) Reversal length during optogenetic activation of AIB in various glutamate postsynaptic receptor mutants and restoring eat-4 specifically in AIB in different eat-4 glutamate deficient mutants. GluCl single and double mutants exhibited longer reversals than the triple mutants (Figure 4B), suggesting that AVR-14, AVR-15 and GLC-1 proteins function synergistically to mediate feedforward inhibition. Error bars indicate SEMs. *p<0.05, **p<0.01, ****p<0.0001. Mann–Whitney U test. All multiple comparisons were adjusted using Bonferroni correction. (C) Single trial data related to Figure 4D).
Figure 4—figure supplement 2.
Figure 4—figure supplement 2.. Functional coupling between AIB and RIB neurons was directly tested through glutamate imaging.
(A) Single trial data of the glutamatergic signal on the process of RIB after AIB activation onset, related to Figure 4E). Raw data and smoothed data (bold line) are showed. (B) Examination of AIB calcium activity after optogenetic activation of AIB, related to Figure 4E). Raw data and smoothed data (bold line) are showed.
Figure 5.
Figure 5.. Local interneurons RIB promote both turning and forward behaviors.
(A) Calcium activity of RIB during type-I (up, n = 41) and type-II transitions (bottom, n = 25). ΔR(t) (mean ± SEM) are shown. t = 0 is aligned to the initiation of forward movement (up) or an omega turn (bottom). (B) Statistics of motor state transitions (left) and representative curvature kymographs (right) upon optogenetic manipulation of RIB. Left, the probability for a transition and its 95% confidence limits were computed. RIB::Chrimson1, n = 65, red light (635 nm, 3.75 mW/mm2); RIB::Chrimson2, n = 82, red light (635 nm, 1.00 mW/mm2); RIB::Arch, n = 83, green light (561 nm, 8.14 mW/mm2). Right, animals crawled on fresh agar plates. Body curvature was normalized by a k · L, where L is the body length. Green (or red) shaded regions show selected spatiotemporal regions for optogenetic inhibition (or activation). The kymograph of turning behaviors exhibits longer cycles to complete body bending and larger body curvature, which are different from those during forward movement. (C) Reversal length distributions (left) and transition rates (right) when ALM/AVM activation was followed by optogenetic inhibition of RIB (12 s green light, 561 nm, 1.94 mW/mm2). Pmec-4::ChR2;Psto-3::Arch, n = 173. Control group is from Figure 1C. (D) Calcium imaging of RIV in wild-type (blue) and RIB-ablated animals (orange) upon optogenetic stimulation of AIB in freely behaving animals. ΔR(t)/R0 (Mean ± SEM) are shown. (E) Data are related to (D), but all trials were aligned to the onset of omega turns. (F) Reversal length during ALM/AVM-triggered escape responses in RIB-ablated animals or in animals where chemical synaptic transmission from RIB was blocked. Error bars indicate SEM. Mann–Whitney U test, ****p<0.0001. All multiple comparisons were adjusted using Bonferroni correction.
Figure 5—figure supplement 1.
Figure 5—figure supplement 1.. RIB receive feedforward inhibition to modulate type-II transition and neurons in the turning module might contribute to reversal termination.
(A) Single trial data related to Figure 5A). Dashed lines indicate the initiation of forward movement (up) or omega turns (bottom). (B) Persistent inhibition of RIB by expressing an exogenous histamine channel (HisCl) during ALM/AVM-triggered escape responses. Type-II transition quickly approached a plateau at a lower rate, which is consistent with our model prediction and Figure 5C). Control group is from Figure 1C). (C) Single trial data related to Figure 5D–E). (D) Left, simultaneous optogenetic activation of AIB and calcium imaging of RIV or SAAD/SMB (Pnpr-9::Chrimson;Plim-4::GCaMP6) in freely behaving animals. t = 0 is aligned to the onset of an omega turn. ΔR(t) (mean ± SEM) are shown. Right, smoothed single trial data. Dashed lines indicate the start of a turn.
Figure 6.
Figure 6.. Feedback inhibition from the turning module contributes to reversal termination.
(A) Expression pattern of Plim-4::Arch::GFP. Scale bar, 10 µm. (B) Left, escape responses induced by optogenetic activation of AIB (blue text, 473 nm, 14.71 mW/mm2, 1.5 s) or thermal stimulus (pink text, 1480 nm, 0.75 s) followed by optogenetic inhibition of Arch-expressed interneurons (green text, 561 nm, 21.71 mW/mm2, 12 s). Bar graph, reversal durations, Mann–Whitney U test and error bars are SEMs. Pie chart, fractions of trials executing omega turns, χ2 test. *p<0.05, ***p<0.001, ****p<0.0001. All multiple comparisons were adjusted using Bonferroni correction. Right, schematic diagram for selective inhibition of RIV near animal head during thermally induced (1480 nm, 0.75 s) escape responses. (C) Up, reversal length distribution (left) and transition rate (right) in RIV/SAAD/SMB ablated animals. Bottom, spontaneous run length distribution (left) and transition rate from forward to backward movements (right) in wild-type animals. Insets are plots of survival functions: proportion of trials moving backward (up) or forward (bottom) until t. We fitted only trials with reversal duration ≥3 s and forward duration ≥2 s.
Figure 7.
Figure 7.. A model summary for motor sequence generation.
(A) Schematics of neuronal circuit of C. elegans avoidance behavior. Feedforward excitation between local interneurons AIB and RIV triggers turning behavior. Glutamatergic inhibition between AIB and RIB flexibly controls the motor state transitions. Feedback inhibition from the turning module helps terminate backward behavior. (B) Illustration of the biophysical meaning of the type-II transition. The sub-threshold membrane potential of RIV fluctuates around the fixed point x0, just like a particle (red) in an energy well. When RIV membrane potential crosses the threshold xth, RIV along with other neurons in the turning module become fully activated and a turn starts. (C) A simple stochastic model without short-term synaptic plasticity cannot account for the experimentally observed transition rate. (D) Schematics of a three-module model based on the animal connectome and experimentally identified functional motifs. Short-term synaptic depression (STD) was introduced in the feedforward inhibition. (E) Type-II transition rate during ALM/AVM triggered escape responses. Pink line is a theoretical fit using Equation 4. τg in Equation 4 is given by the glutamate decay constant in Figure 4E.

Comment in

  • Turning away from danger.
    Liu J, Scholz M. Liu J, et al. Elife. 2020 Jul 21;9:e59910. doi: 10.7554/eLife.59910. Elife. 2020. PMID: 32691732 Free PMC article.

References

    1. Abeles M. Corticonics: Neural Circuits of the Cerebral Cortex. Cambridge University Press; 1991.
    1. Ahamed T, Costa AC, Stephens GJ. Capturing the continuous complexity of behavior in C. elegans. arXiv. 2019 https://arxiv.org/abs/1911.10559
    1. Alkema MJ, Hunter-Ensor M, Ringstad N, Horvitz HR. Tyramine functions independently of octopamine in the Caenorhabditis elegans nervous system. Neuron. 2005;46:247–260. doi: 10.1016/j.neuron.2005.02.024. - DOI - PubMed
    1. Allen C, Stevens CF. An evaluation of causes for unreliability of synaptic transmission. PNAS. 1994;91:10380–10383. doi: 10.1073/pnas.91.22.10380. - DOI - PMC - PubMed
    1. Altun ZF, Chen B, Wang ZW, Hall DH. High resolution map of Caenorhabditis elegans gap junction proteins. Developmental Dynamics : An Official Publication of the American Association of Anatomists. 2009;238:1936–1950. doi: 10.1002/dvdy.22025. - DOI - PMC - PubMed

Publication types