. 2020 Jul 9;5(13):e139834.
doi: 10.1172/jci.insight.139834.

Longitudinal COVID-19 profiling associates IL-1RA and IL-10 with disease severity and RANTES with mild disease

Affiliations

Longitudinal COVID-19 profiling associates IL-1RA and IL-10 with disease severity and RANTES with mild disease

Yan Zhao et al. JCI Insight. .

Abstract

Background: Identifying immune correlates of COVID-19 disease severity is an urgent need for clinical management, vaccine evaluation, and drug development. Here, we present a temporal analysis of key immune mediators, cytokines, and chemokines in blood of hospitalized COVID-19 patients from serial sampling and follow-up over 4 weeks.

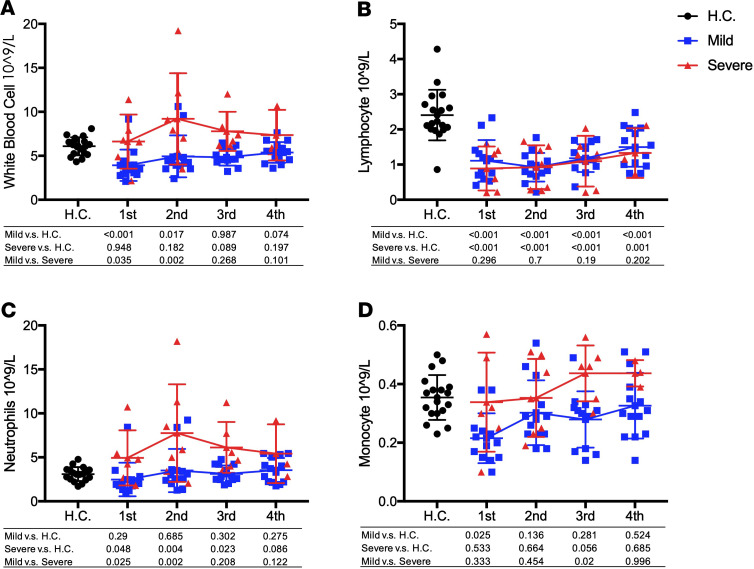
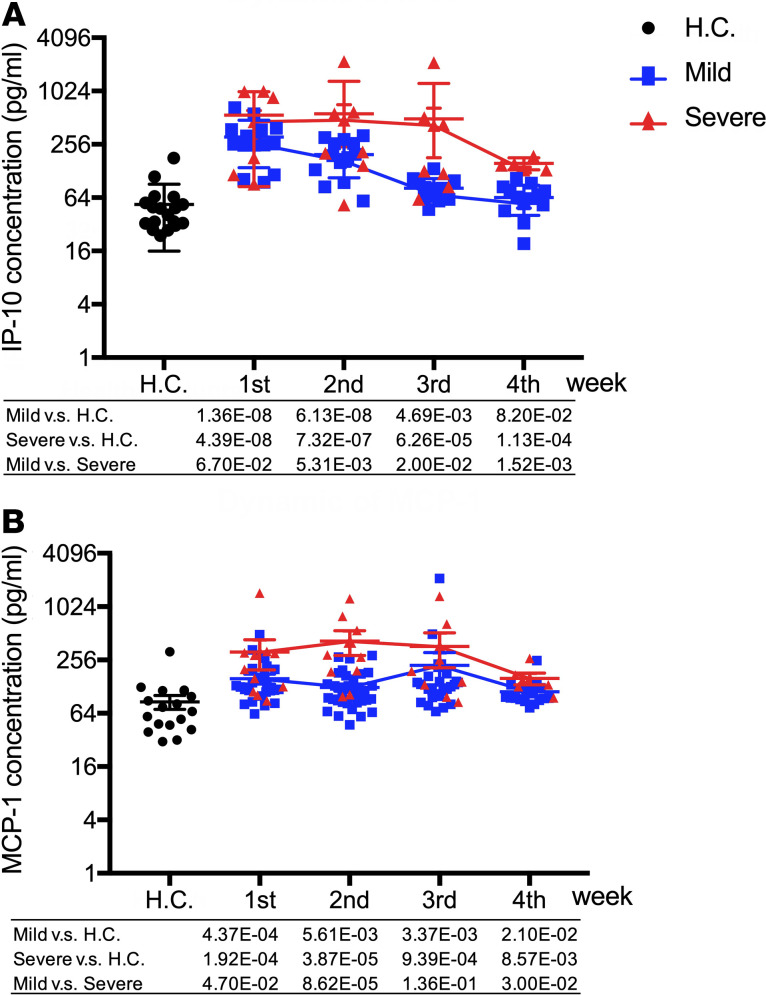
Methods: A total of 71 patients with laboratory-confirmed COVID-19 admitted to Beijing You'an Hospital in China with either mild (53 patients) or severe (18 patients) disease were enrolled with 18 healthy volunteers. We measured 34 immune mediators, cytokines, and chemokines in peripheral blood every 4-7 days over 1 month per patient using a bioplex multiplex immunoassay.

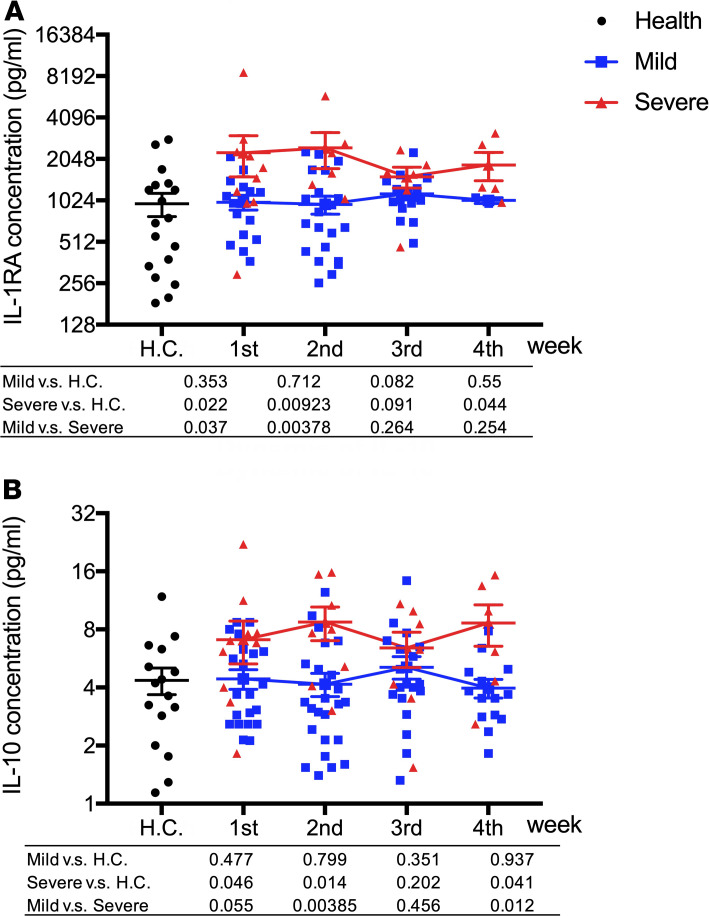
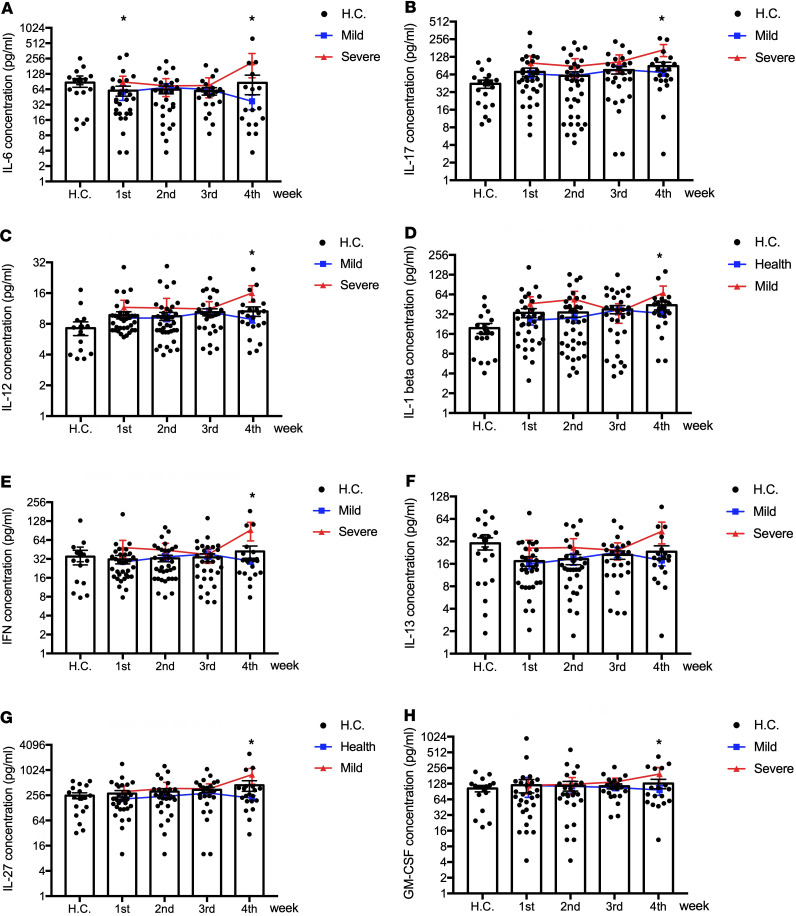
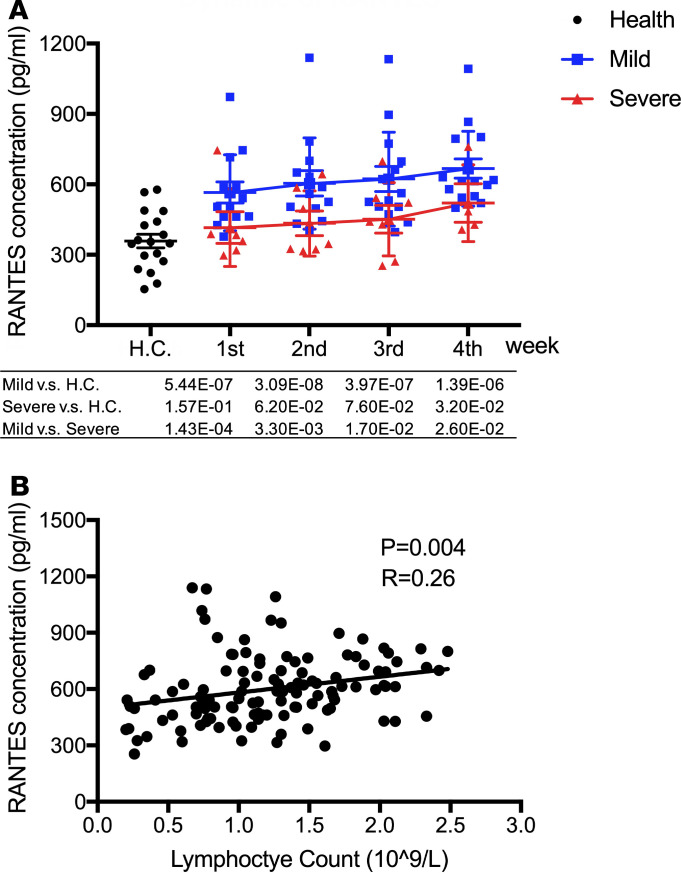
Results: We found that the chemokine RANTES (CCL5) was significantly elevated, from an early stage of the infection, in patients with mild but not severe disease. We also found that early production of inhibitory mediators including IL-10 and IL-1RA were significantly associated with disease severity, and a combination of CCL5, IL-1 receptor antagonist (IL-1RA), and IL-10 at week 1 may predict patient outcomes. The majority of cytokines that are known to be associated with the cytokine storm in virus infections such as IL-6 and IFN-γ were only significantly elevated in the late stage of severe COVID-19 illness. TNF-α and GM-CSF showed no significant differences between severe and mild cases.

Conclusion: Together, our data suggest that early intervention to increase expression of CCL5 may prevent patients from developing severe illness. Our data also suggest that measurement of levels of CCL5, as well as IL-1RA and IL-10 in blood individually and in combination, might be useful prognostic biomarkers to guide treatment strategies.

Keywords: Adaptive immunity; COVID-19.


Conflict of interest statement

Conflict of interest: The authors have declared that no conflict of interest exists.

Figures

Figure 1
Figure 1. Dynamic changes of blood cells during COVID-19 infection.
(A–D) The values of white blood cell (A), lymphocyte count (B), neutrophils count (C), and monocyte count (D) in severe and mild infection patients and healthy control were compared with each other. Two-tailed Student’s t test was used to compare parametric continuous data (evaluated with Kolmogorov-Smirnov test), and nonparametric t test (Mann-Whitney U test) was used when data were not normally distributed. The differences between each group were presented with a P value in the table under the diagram. The absolute numbers of white blood cell (A), lymphocyte count (B), neutrophils count (C), and monocyte count (D) in COVID-19 infection patients in weeks 1–4 of onset of symptom and health control were presented in scatter diagrams, in which health control was represented with black circles, mild patients with blue squares, and severe with red triangles. The dynamic changes of WBC, lymphocyte, neutrophils, and monocyte are presented with red lines in severe patients and blue lines in mild patients.
Figure 2
Figure 2. The dynamic changes of IP-10 and MCP-1 plasma levels between mild and severe COVID-19 infection.
(A and B) The values of IP-10 (A) and MCP-1 (B) in severe and mild infection patients and healthy control were compared with each other. Two-tailed Student’s t test was used to compare parametric continuous data (evaluated with Kolmogorov-Smirnov test), and nonparametric t test (Mann-Whitney U test) was used when data were not normally distributed. The differences between each group were presented with a P value in the table under the diagram. The values of IP-10 (A) and MCP-1 (B) in healthy controls and COVID-19 infection patients in weeks 1–4 of onset of symptom are presented in scatter diagrams, in which health control was represented with black circles, mild patients with blue squares, and severe with red triangles. The dynamic changes of IP-10 and MCP-1 are presented with red lines in severe patients and blue lines in mild patients.
Figure 3
Figure 3. Inhibitory cytokines IL-1RA and IL-10 are significantly elevated in severe cases at early stage of infection.
(A and B) The values of IL-1RA (A) and IL-10 (B) in severe and mild infection patients and healthy control were compared with each other. Two-tailed Student’s t test was used to compare parametric continuous data (evaluated with Kolmogorov-Smirnov test), and nonparametric t test (Mann-Whitney U test) was used when data were not normally distributed. The differences between each group were presented with a P value in the table under the diagram. The values of IL-1RA (A) and IL-10 (B) in healthy controls and COVID-19 infection patients in weeks 1–4 of onset of symptoms are presented in scatter diagrams, in which health control was represented with black circles, mild patients with blue squares, and severe with red triangles. The dynamics of IL-1RA (A) and IL-10 (B) were presented with red lines in severe patients and blue lines in mild patients.
Figure 4
Figure 4. Elevated IL-6, IL-17, IL-12, IL-1β, IFN-γ, IL-13, IL-27, and IL-7 in late stages of severe cases.
(A–H) The values of IL-6 (A), IL-17 (B), IL-12 (C), IL-1β (D), IFN-γ (E), IL-13 (F), IL-27 (G) and GM-CSF (H) were compared between severe and mild infection patients by 2-tailed Student’s t test with parametric continuous data (evaluated with Kolmogorov-Smirnov test) and nonparametric t test (Mann-Whitney test) when data were not normally distributed. *P < 0.05. The values of IL-6 (A), IL-17 (B), IL-12 (C), IL-1β (D), IFN-γ (E), IL-13 (F), IL-27 (G) and GM-CSF (H) in healthy controls (H.C.) and COVID-19 infection patients in weeks 1–4 of onset of symptom are presented with black dots in scatter diagrams; the dynamics of cytokines and chemokines are presented with red lines in severe patients and blue lines in mild patients.
Figure 5
Figure 5. High level of RANTES in mild but not severe COVID-19 patients.
(A) The value of RANTES in severe and mild infection patients and healthy control were compared with each other. Two-tailed Student’s t test was used to compare parametric continuous data (evaluated with Kolmogorov-Smirnov test), and nonparametric t test (Mann-Whitney U test) was used when data were not normally distributed. The differences between each group were presented with a P value in the table under the diagram. The values of RANTES in health control and COVID-19 infection patients in weeks 1–4 of onset of symptom was presented in scatter diagrams, in which health control was represented with black circles, mild patients with blue squares, and severe with red triangles. The dynamics of RANTES was presented with red lines in severe patients and blue lines in mild patients. (B) Correlation analysis between RANTES and lymphocyte counts. Correlation analysis between RANTES and lymphocyte counts was performed by linear regression analysis. Each black circle indicates an individual patient; the linear correlation between RANTES and lymphocyte count was presented with a black line.
Figure 6
Figure 6. Combination of CCL5, IL-1RA, and IL-10 predict the disease severity.
(A) a cluster plot to visualize k-means clusters with the proportion of variance explained by each component. The 2 distinct clusters are highlighted in red and blue. The patient IDs are shown next to each dots. (B) A bar plot of the number of K-mean cluster 1 and cluster 2 patients with either mild or severe COVID-19 disease. (C) A dendrogram showing agglomerative hierarchical clusters. The height on the y axis represents the distance between 2 clusters. Two major clusters are highlighted in red and blue. The patient IDs are shown at the bottom of the dendrogram. (D) A bar plot of the number of hierarchical cluster 1 and cluster 2 patients with either mild or severe COVID-19 disease.

References

    1. [No authors listed]. Coronavirus disease (COVID-19) pandemic. World Health Organization. https://www.who.int/emergencies/diseases/novel-coronavirus-2019 Accessed June 11, 2020.
    1. Wu F, et al. A new coronavirus associated with human respiratory disease in China. Nature. 2020;579(7798):265–269. doi: 10.1038/s41586-020-2008-3. - DOI - PMC - PubMed
    1. Zhu N, et al. A Novel Coronavirus from Patients with Pneumonia in China, 2019. N Engl J Med. 2020;382(8):727–733. doi: 10.1056/NEJMoa2001017. - DOI - PMC - PubMed
    1. Fehr AR, Perlman S. Coronaviruses: an overview of their replication and pathogenesis. Methods Mol Biol. 2015;1282:1–23. doi: 10.1007/978-1-4939-2438-7_1. - DOI - PMC - PubMed
    1. Perlman S, Netland J. Coronaviruses post-SARS: update on replication and pathogenesis. Nat Rev Microbiol. 2009;7(6):439–450. doi: 10.1038/nrmicro2147. - DOI - PMC - PubMed

Publication types

MeSH terms