. 2020 May-Jun:68:101692.
doi: 10.1016/j.jcrimjus.2020.101692. Epub 2020 May 1.

Impact of social distancing during COVID-19 pandemic on crime in Los Angeles and Indianapolis

Affiliations

Impact of social distancing during COVID-19 pandemic on crime in Los Angeles and Indianapolis

George Mohler et al. J Crim Justice. 2020 May-Jun.

Abstract

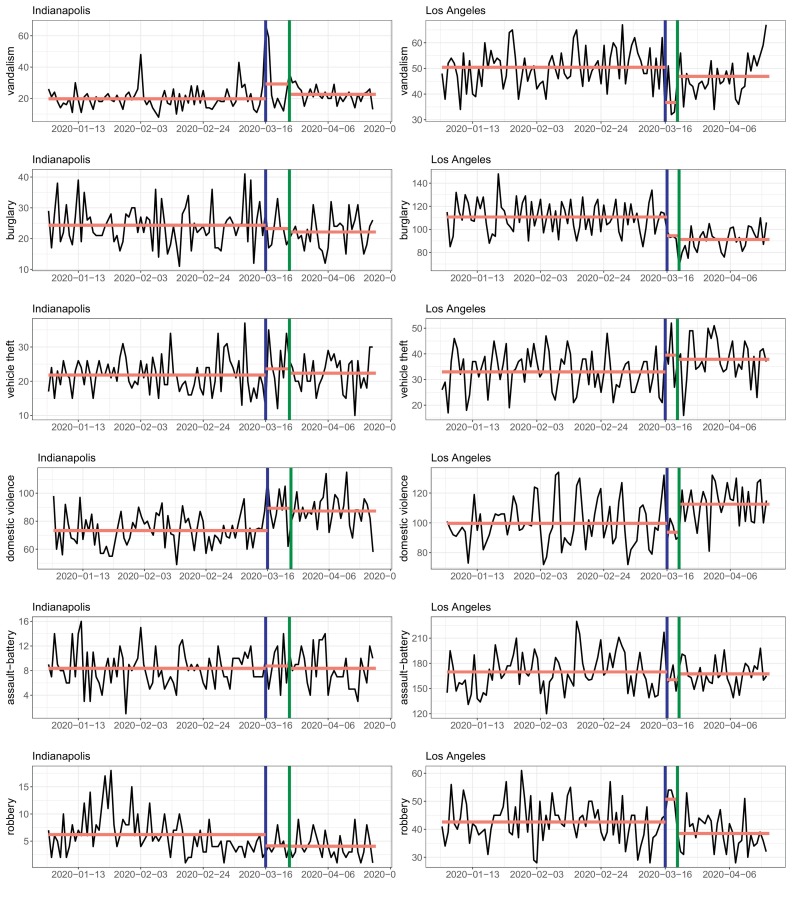
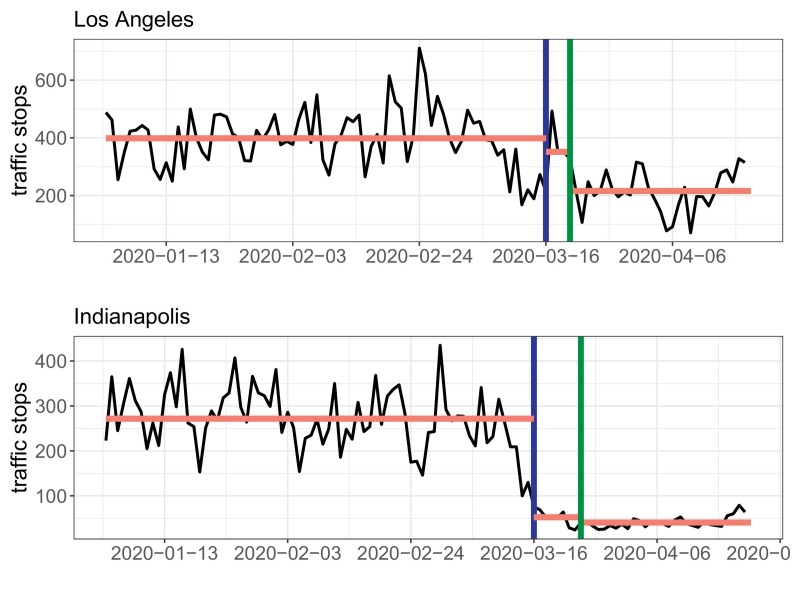
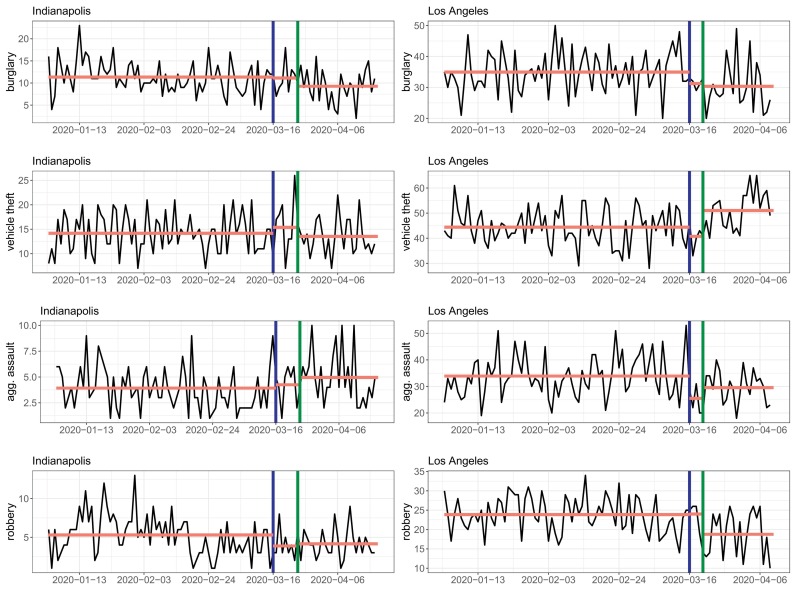
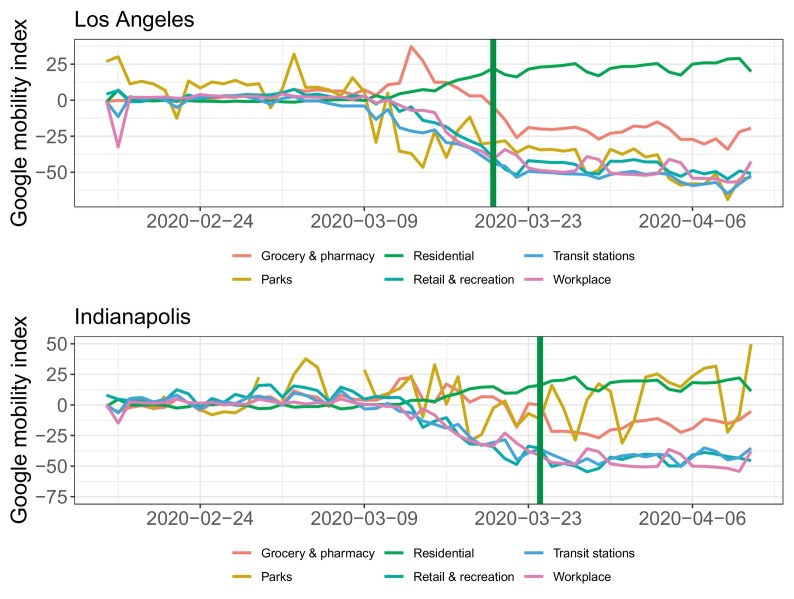
Governments have implemented social distancing measures to address the ongoing COVID-19 pandemic. The measures include instructions that individuals maintain social distance when in public, school closures, limitations on gatherings and business operations, and instructions to remain at home. Social distancing may have an impact on the volume and distribution of crime. Crimes such as residential burglary may decrease as a byproduct of increased guardianship over personal space and property. Crimes such as domestic violence may increase because of extended periods of contact between potential offenders and victims. Understanding the impact of social distancing on crime is critical for ensuring the safety of police and government capacity to deal with the evolving crisis. Understanding how social distancing policies impact crime may also provide insights into whether people are complying with public health measures. Examination of the most recently available data from both Los Angeles, CA, and Indianapolis, IN, shows that social distancing has had a statistically significant impact on a few specific crime types. However, the overall effect is notably less than might be expected given the scale of the disruption to social and economic life.

Keywords: Crime; Interrupted time series; Natural experiment; Policing; Routine activities.


Figures

Fig. 1
Fig. 1
Time series of calls for service per day (black) along with mean calls per day (red line) over each of the three time periods. Blue vertical line indicates the date schools, restaurants and bars closed and green vertical line indicates the date of the shelter in place order. (For interpretation of the references to colour in this figure legend, the reader is referred to the web version of this article.)
Fig. 2
Fig. 2
Time series of traffic stops per day (black) along with mean calls per day (red line) over each of the three time periods. Blue vertical line indicates the date schools, restaurants and bars closed and green vertical line indicates the date of the shelter in place order. (For interpretation of the references to colour in this figure legend, the reader is referred to the web version of this article.)
Fig. 3
Fig. 3
Time series of verified crime reports per day (black) along with mean calls per day (red line) over each of the three time periods. Blue vertical line indicates the date schools, restaurants and bars closed and green vertical line indicates the date of the shelter in place order. (For interpretation of the references to colour in this figure legend, the reader is referred to the web version of this article.)
Fig. 4
Fig. 4
Google mobility indices over time in Los Angeles County and Marion County (Indianapolis). Stay at home order date is indicated with green vertical line. Park mobility index in Indianapolis higher than 50 (prior to March 9) not shown. (For interpretation of the references to colour in this figure legend, the reader is referred to the web version of this article.)

References

    1. Bland J.M., Altman D.G. Multiple significance tests: The Bonferroni method. Bmj. 1995;310(6973):170. - PMC - PubMed
    1. Bootsma M.C., Ferguson N.M. The effect of public health measures on the 1918 influenza pandemic in US cities. Proceedings of the National Academy of Sciences. 2007;104(18):7588–7593. - PMC - PubMed
    1. Caley P., Philp D.J., McCracken K. Quantifying social distancing arising from pandemic influenza. Journal of the Royal Society Interface. 2008;5(23):631–639. - PMC - PubMed
    1. Campedelli G.M., Aziani A., Favarin S. 2020. Exploring the effect of {2019-nCoV} containment policies on crime: The case of Los Angeles. - DOI - PMC - PubMed
    1. Cho H., Lee J.-S., Lee S. Optimistic bias about H1N1 flu: Testing the links between risk communication, optimistic bias, and self-protection behavior. Health Communication. 2013;28(2):146–158. - PubMed