

Lessons from being challenged by COVID-19
- PMID: 32501375
- PMCID: PMC7245296
- DOI: 10.1016/j.chaos.2020.109923
Lessons from being challenged by COVID-19
Abstract
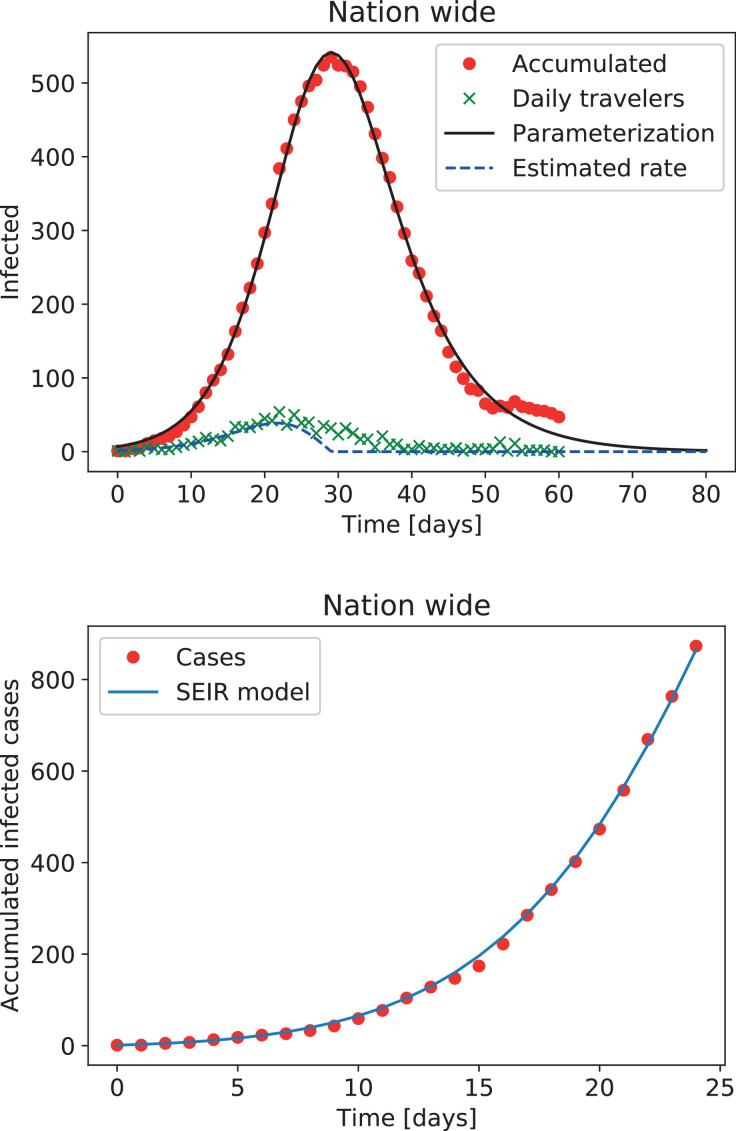
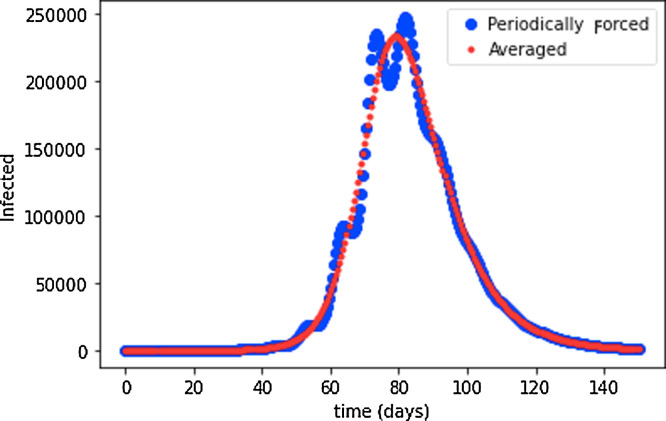
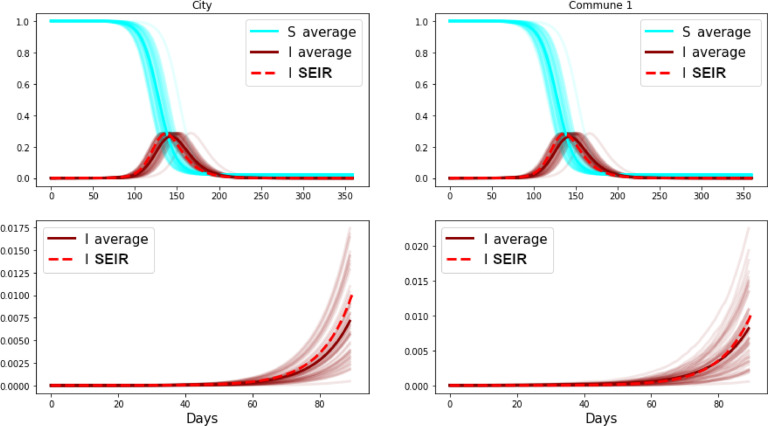
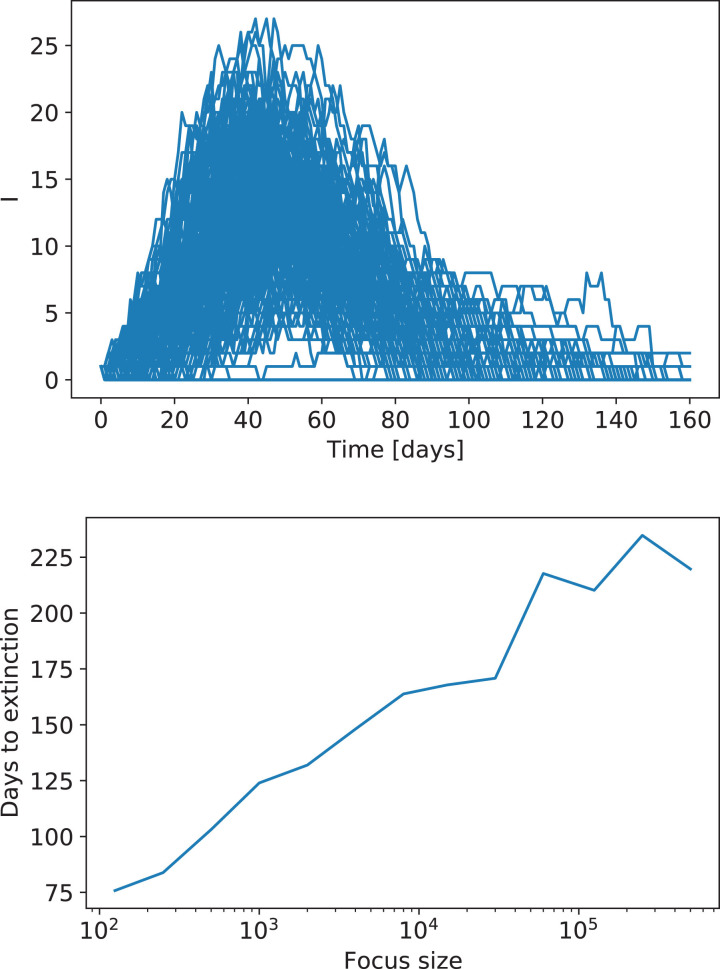
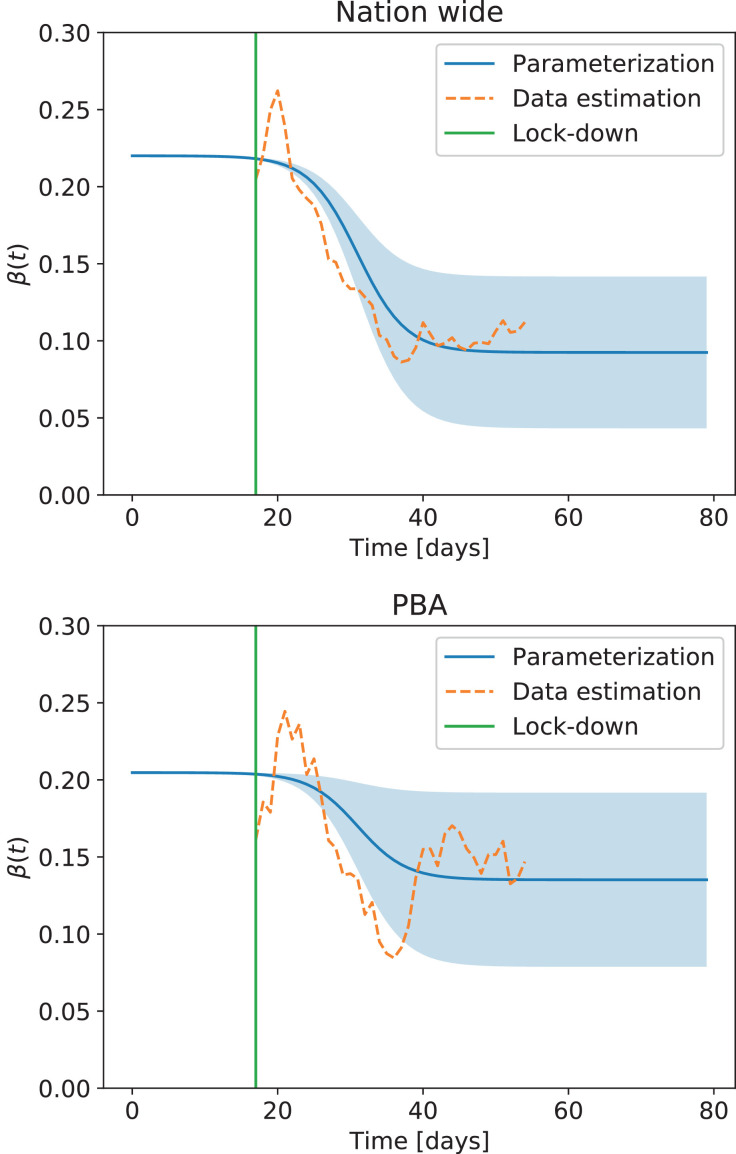
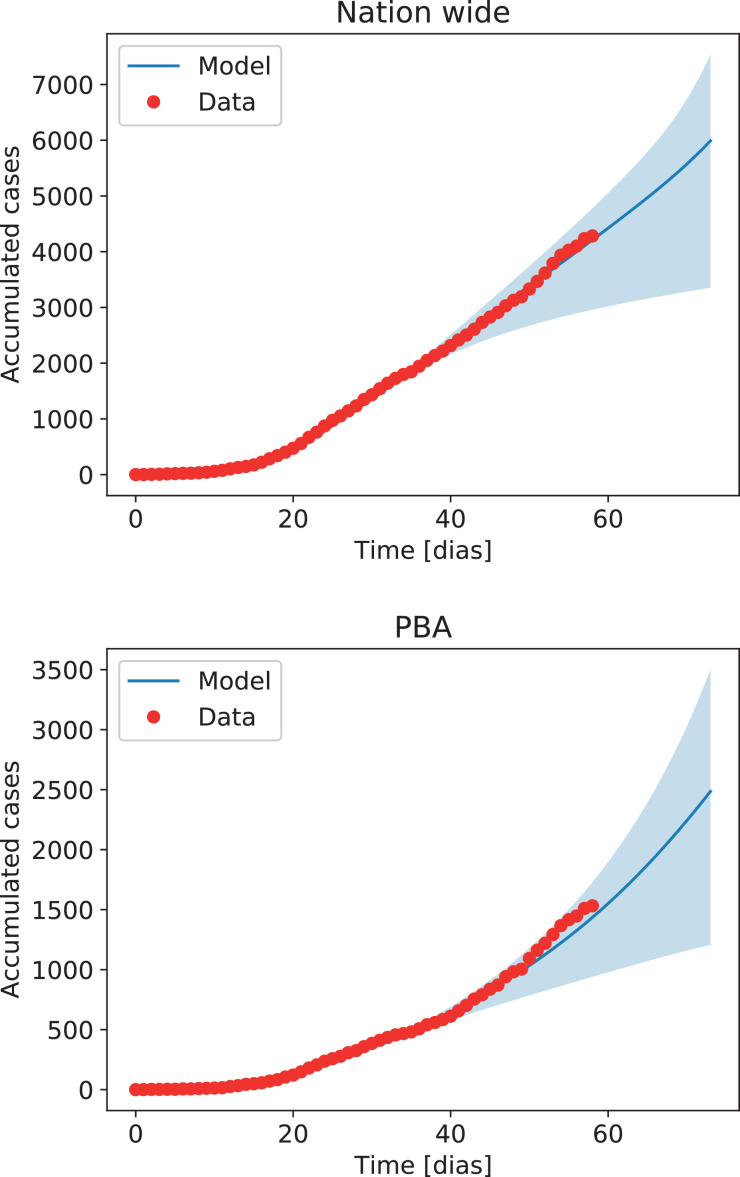
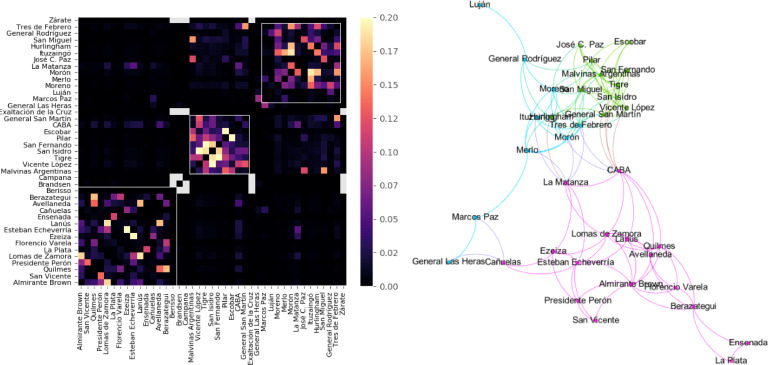
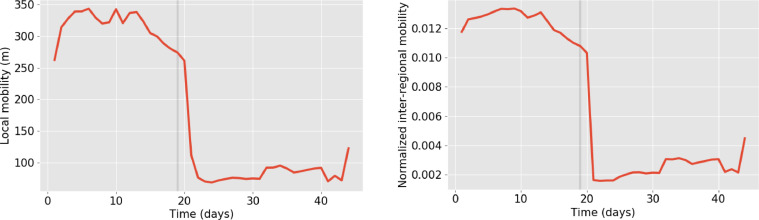
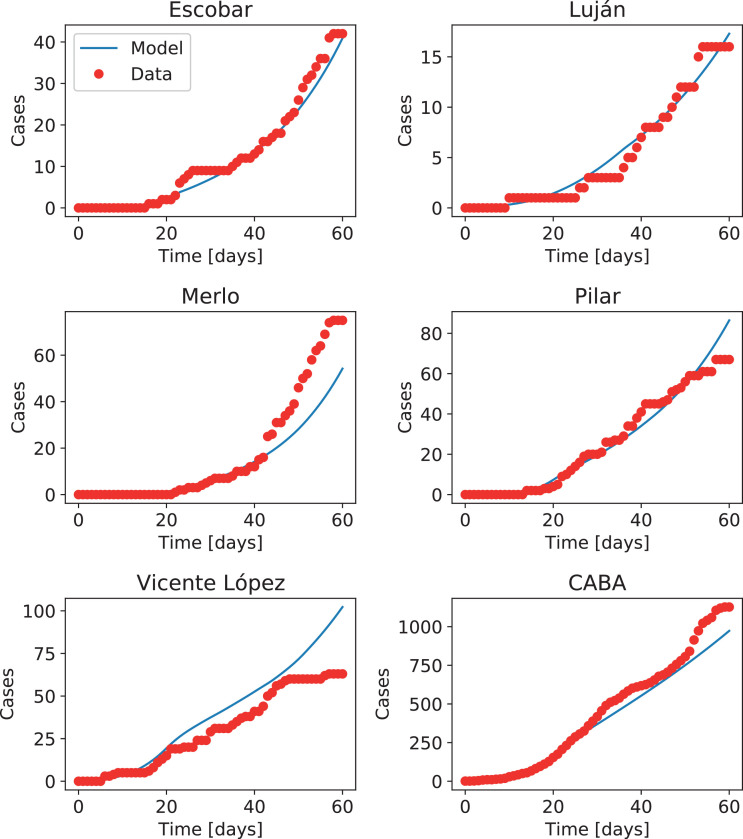
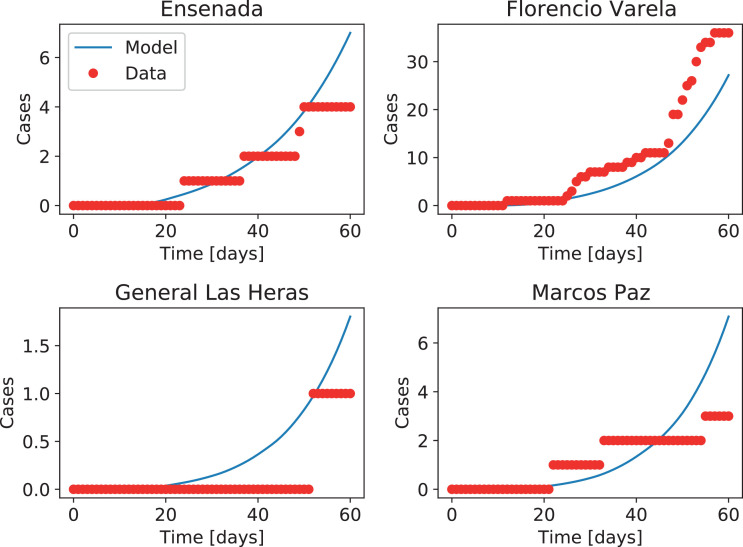
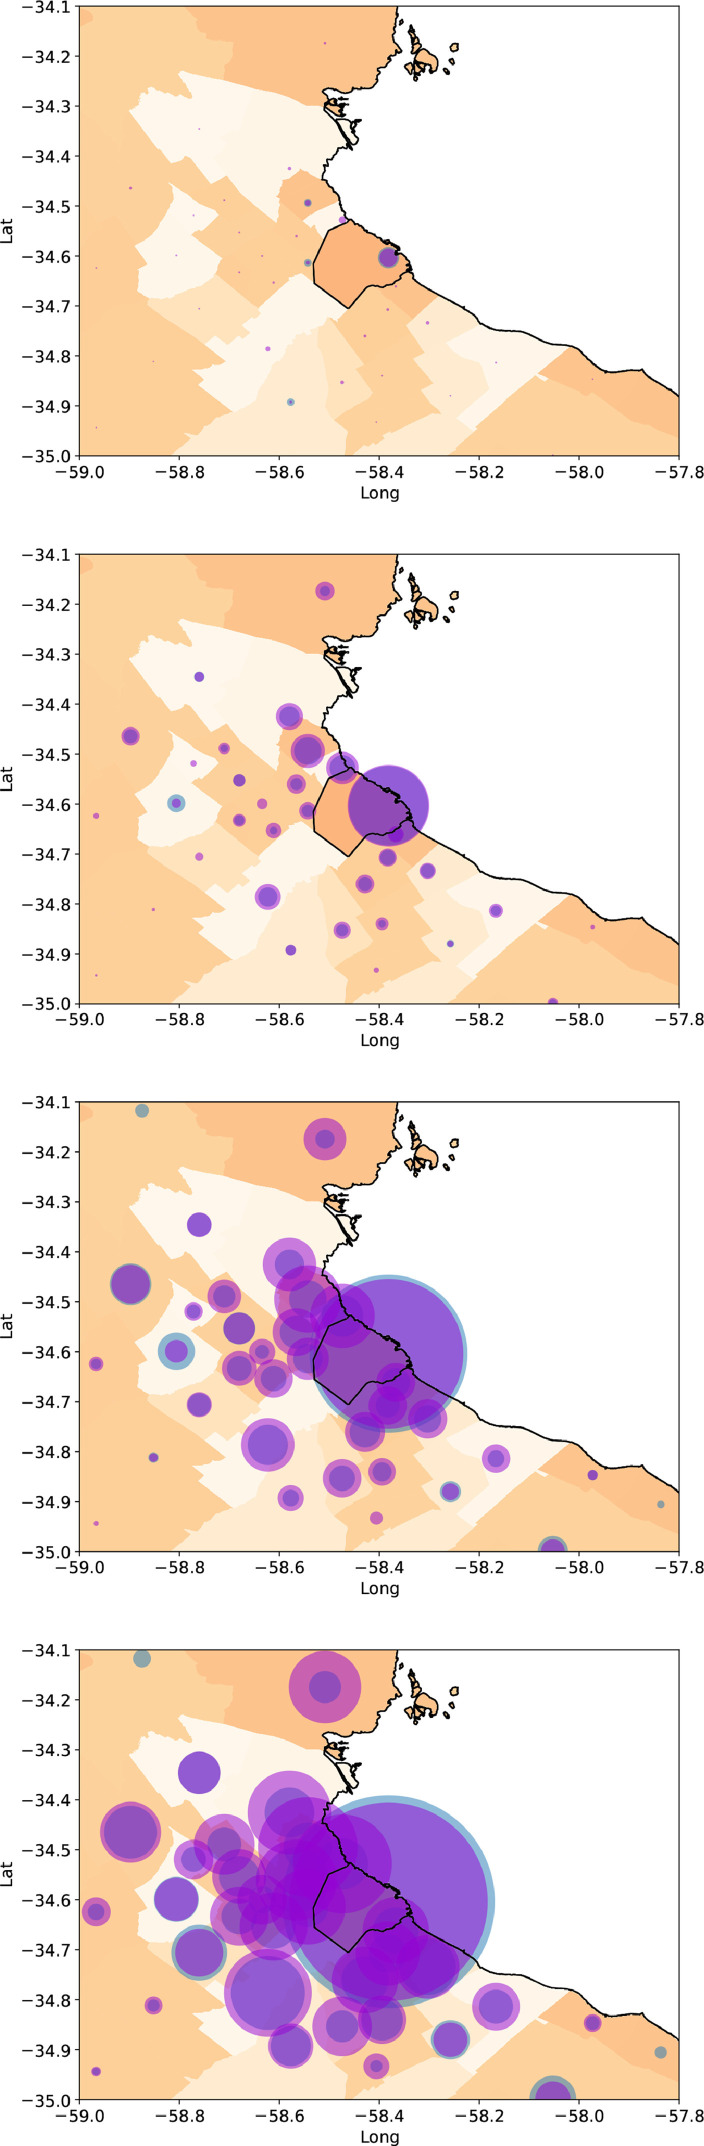
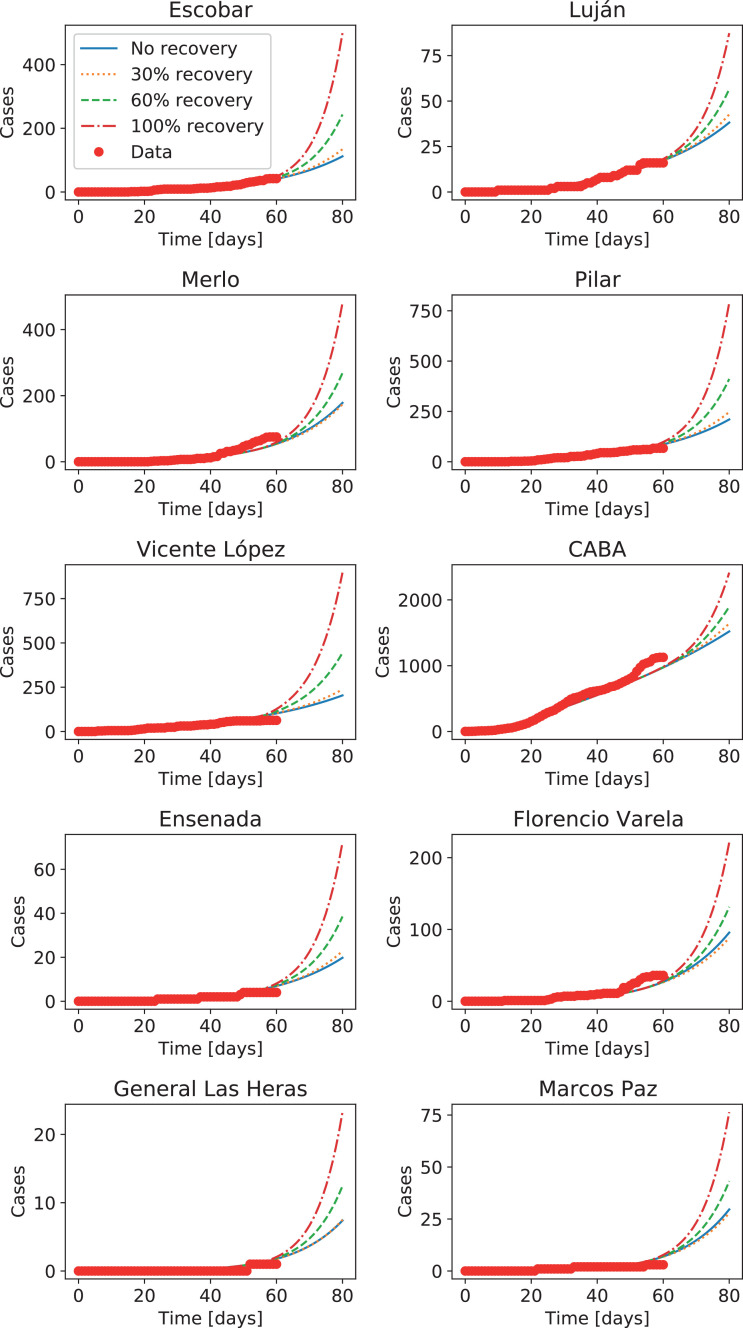
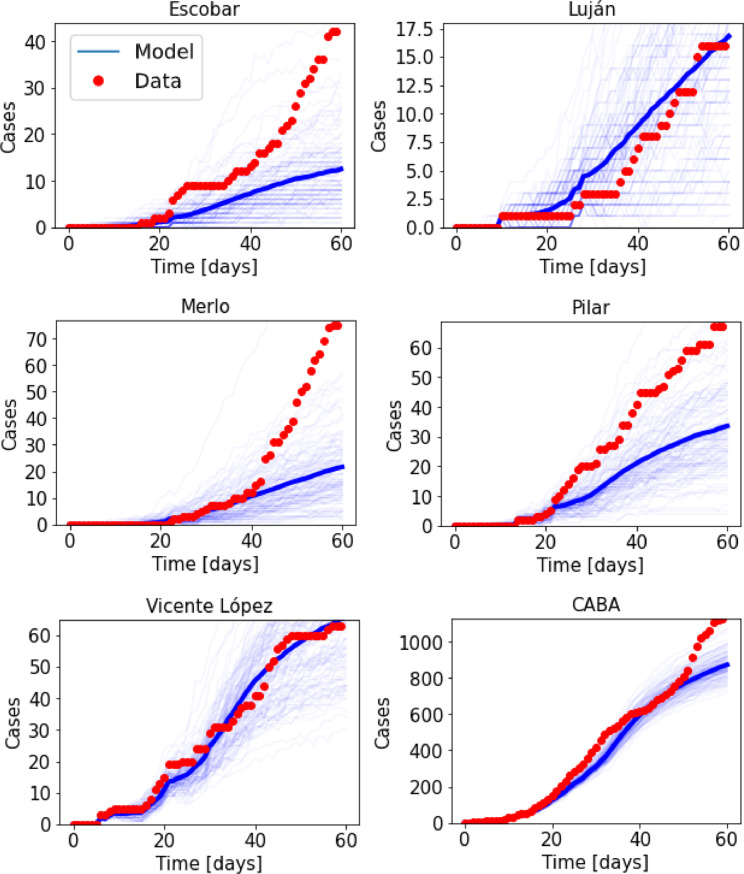
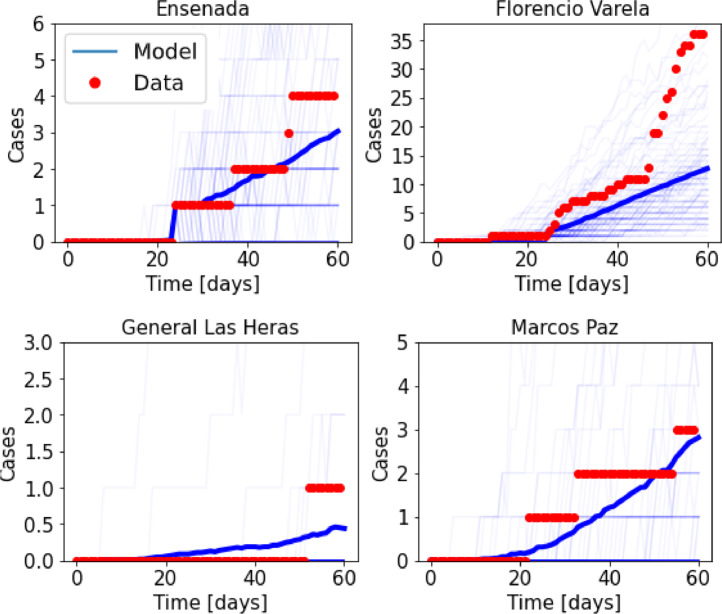
We present results of different approaches to model the evolution of the COVID-19 epidemic in Argentina, with a special focus on the megacity conformed by the city of Buenos Aires and its metropolitan area, including a total of 41 districts with over 13 million inhabitants. We first highlight the relevance of interpreting the early stage of the epidemic in light of incoming infectious travelers from abroad. Next, we critically evaluate certain proposed solutions to contain the epidemic based on instantaneous modifications of the reproductive number. Finally, we build increasingly complex and realistic models, ranging from simple homogeneous models used to estimate local reproduction numbers, to fully coupled inhomogeneous (deterministic or stochastic) models incorporating mobility estimates from cell phone location data. The models are capable of producing forecasts highly consistent with the official number of cases with minimal parameter fitting and fine-tuning. We discuss the strengths and limitations of the proposed models, focusing on the validity of different necessary first approximations, and caution future modeling efforts to exercise great care in the interpretation of long-term forecasts, and in the adoption of non-pharmaceutical interventions backed by numerical simulations.
Keywords: COVID-19; Compartmental models; Mathematical epidemiology; Mobility; Nonlinear dynamics.
© 2020 Elsevier Ltd. All rights reserved.
Conflict of interest statement
The authors declare that they have no known competing financial interests or personal relationships that could have appeared to influence the work reported in this paper.
Figures
Similar articles
-
Global analysis and prediction scenario of infectious outbreaks by recurrent dynamic model and machine learning models: A case study on COVID-19.Comput Biol Med. 2023 May;158:106817. doi: 10.1016/j.compbiomed.2023.106817. Epub 2023 Mar 23. Comput Biol Med. 2023. PMID: 36989749 Free PMC article.
-
Simple multi-scale modeling of the transmission dynamics of the 1905 plague epidemic in Bombay.Math Biosci. 2018 Jul;301:83-92. doi: 10.1016/j.mbs.2018.04.003. Epub 2018 Apr 16. Math Biosci. 2018. PMID: 29673967
-
Forecasting the effect of social distancing on COVID-19 autumn-winter outbreak in the metropolitan area of Buenos Aires.Medicina (B Aires). 2020;80 Suppl 3:7-15. Medicina (B Aires). 2020. PMID: 32658842 English.
-
Simulation and forecasting models of COVID-19 taking into account spatio-temporal dynamic characteristics: A review.Front Public Health. 2022 Oct 18;10:1033432. doi: 10.3389/fpubh.2022.1033432. eCollection 2022. Front Public Health. 2022. PMID: 36330112 Free PMC article. Review.
-
Usage of Compartmental Models in Predicting COVID-19 Outbreaks.AAPS J. 2022 Sep 2;24(5):98. doi: 10.1208/s12248-022-00743-9. AAPS J. 2022. PMID: 36056223 Free PMC article. Review.
Cited by
-
An epidemiological model with voluntary quarantine strategies governed by evolutionary game dynamics.Chaos Solitons Fractals. 2021 Feb;143:110616. doi: 10.1016/j.chaos.2020.110616. Epub 2021 Jan 7. Chaos Solitons Fractals. 2021. PMID: 33867699 Free PMC article.
-
Extended SEIR Model for Health Policies Assessment Against the COVID-19 Pandemic: the Case of Argentina.J Healthc Inform Res. 2022;6(1):91-111. doi: 10.1007/s41666-021-00110-x. Epub 2021 Dec 7. J Healthc Inform Res. 2022. PMID: 34901733 Free PMC article.
-
Isolating the net effect of multiple government interventions with an extended Susceptible-Exposed-Infectious-Recovered (SEIR) framework: empirical evidence from the second wave of COVID-19 pandemic in China.BMJ Open. 2022 Jun 20;12(6):e060996. doi: 10.1136/bmjopen-2022-060996. BMJ Open. 2022. PMID: 35725257 Free PMC article.
-
Automatic 3D cluster modelling of COVID-19 through voxel-based redistribution.Powder Technol. 2021 Sep;390:174-181. doi: 10.1016/j.powtec.2021.05.083. Epub 2021 May 25. Powder Technol. 2021. PMID: 36313254 Free PMC article.
-
Dynamic model of infected population due to spreading of pandemic COVID-19 considering both intra and inter zone mobilization factors with rate of detection.Chaos Solitons Fractals. 2021 Jan;142:110377. doi: 10.1016/j.chaos.2020.110377. Epub 2020 Oct 19. Chaos Solitons Fractals. 2021. PMID: 33100606 Free PMC article.
References
-
- Cereda D., Tirani M., Rovida F., Demicheli V., Ajelli M., Poletti P., Trentini F., Guzzetta G., Marziano V., Barone A., Magoni M., Deandrea S., Diurno G., Lombardo M., Faccini M., Pan A., Bruno R., Pariani E., Grasselli G., Piatti A., Gramegna M., Baldanti F., Melegaro A., Merler S. 2020. The early phase of the COVID-19 outbreak in Lombardy, Italy.
-
- Russell T.W., Hellewell J., Jarvis C.I., van Zandvoort K., Abbott S., Ratnayake R. Estimating the infection and case fatality ratio for coronavirus disease (COVID-19) using age-adjusted data from the outbreak on the diamond princess cruise ship, february 2020. Euro Surveill. 2020;25(12):2000256. - PMC - PubMed
LinkOut - more resources
Full Text Sources
