. 2020 Jun:85:101819.
doi: 10.1016/j.jairtraman.2020.101819. Epub 2020 Apr 10.

Identification of critical airports for controlling global infectious disease outbreaks: Stress-tests focusing in Europe

Affiliations

Identification of critical airports for controlling global infectious disease outbreaks: Stress-tests focusing in Europe

Paraskevas Nikolaou et al. J Air Transp Manag. 2020 Jun.

Abstract

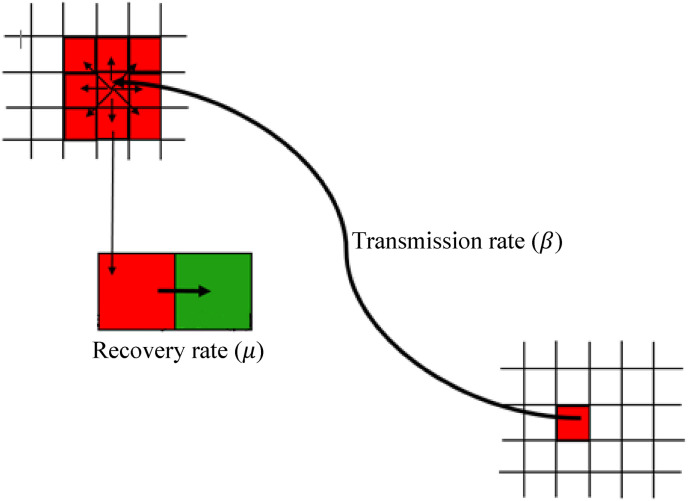
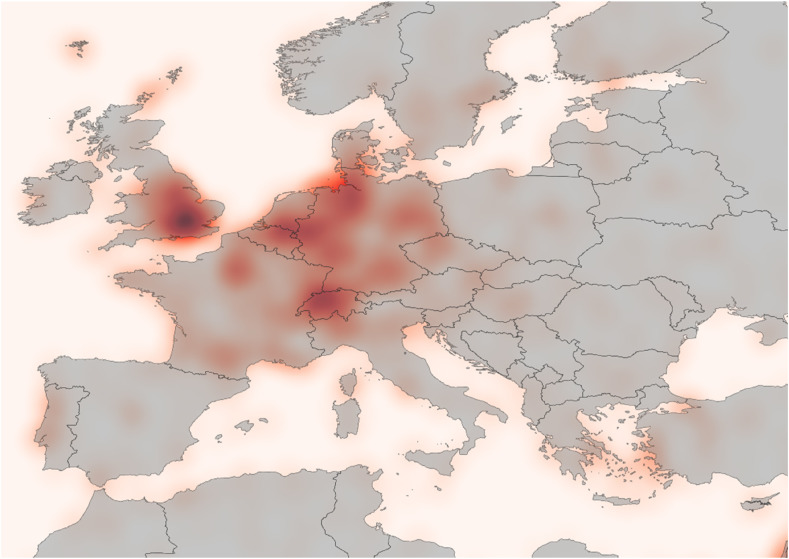
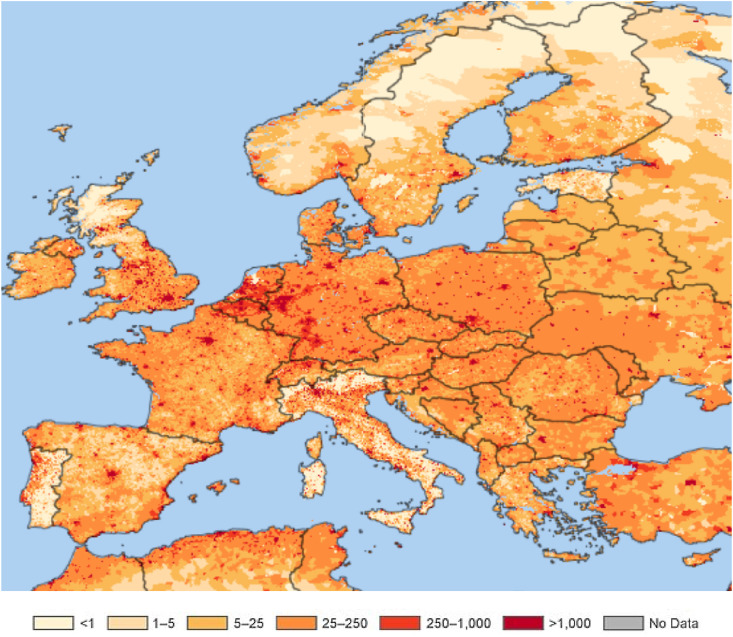
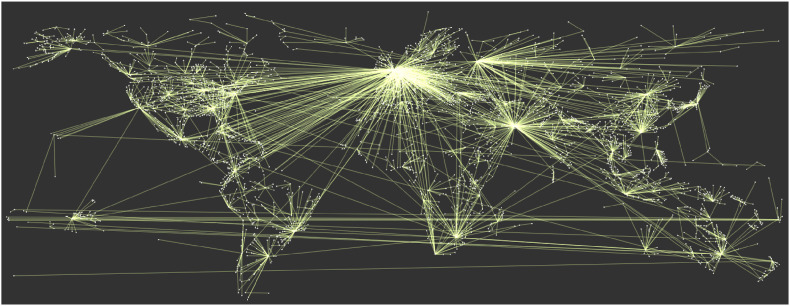
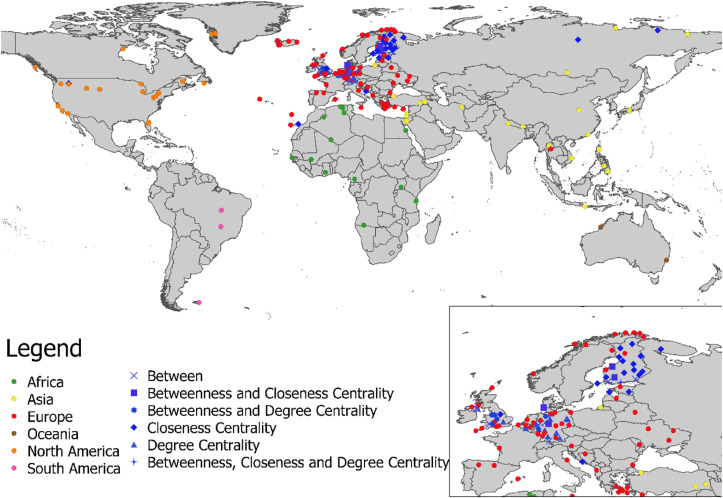
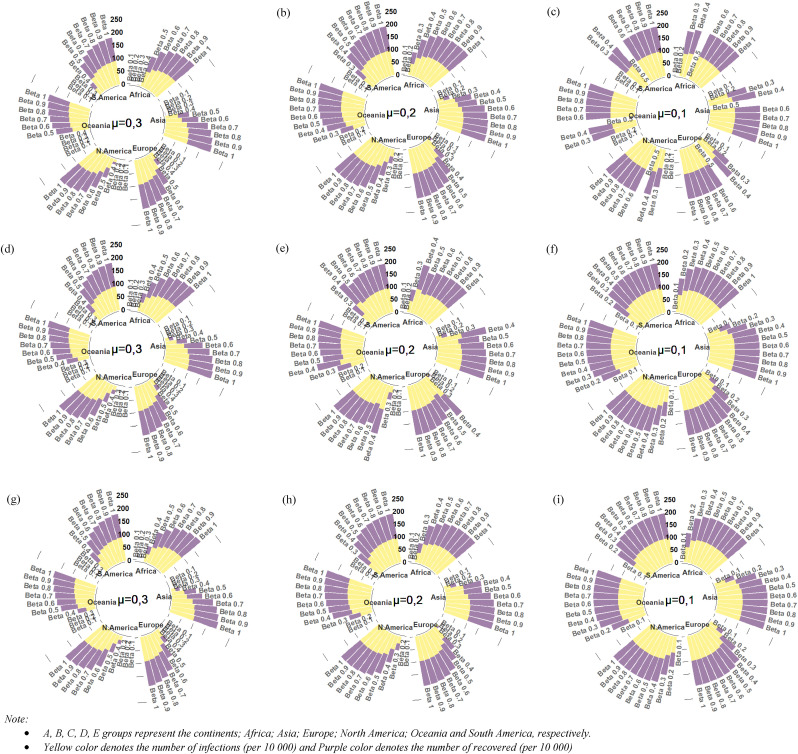
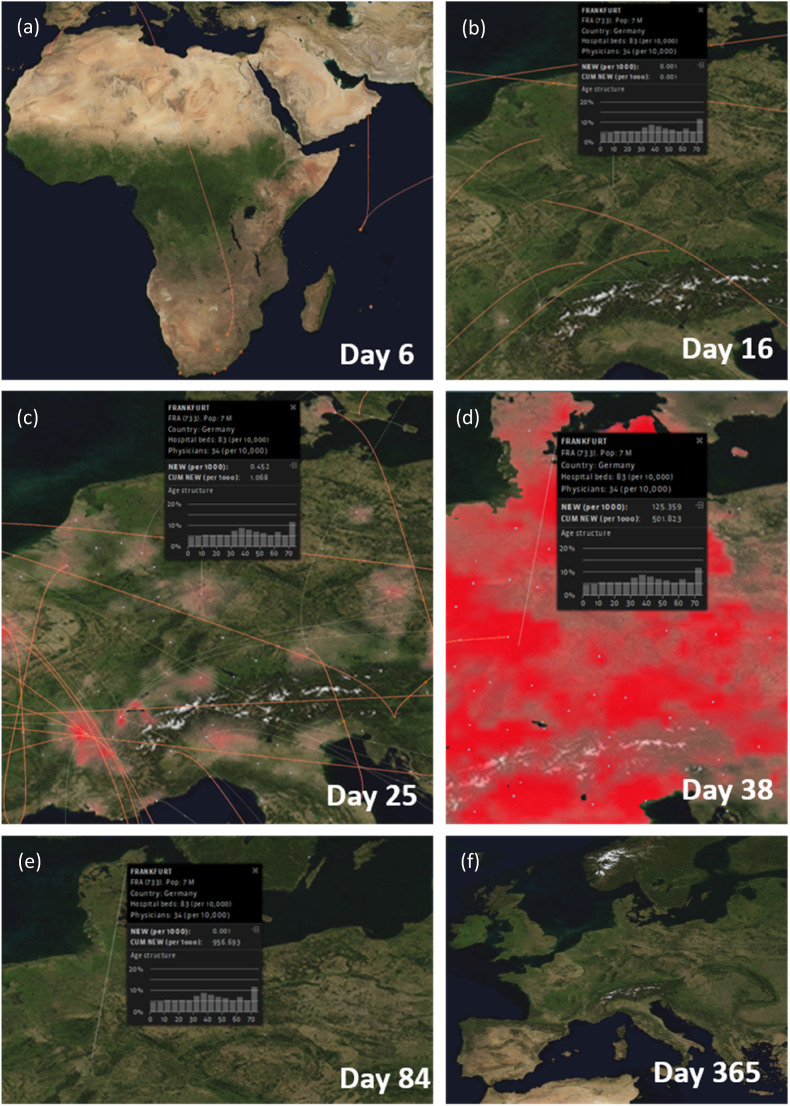
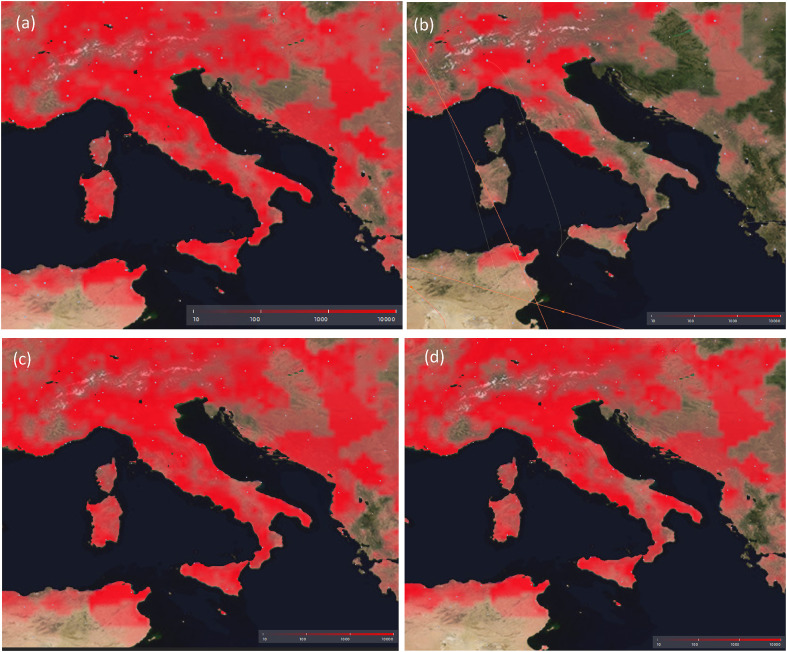
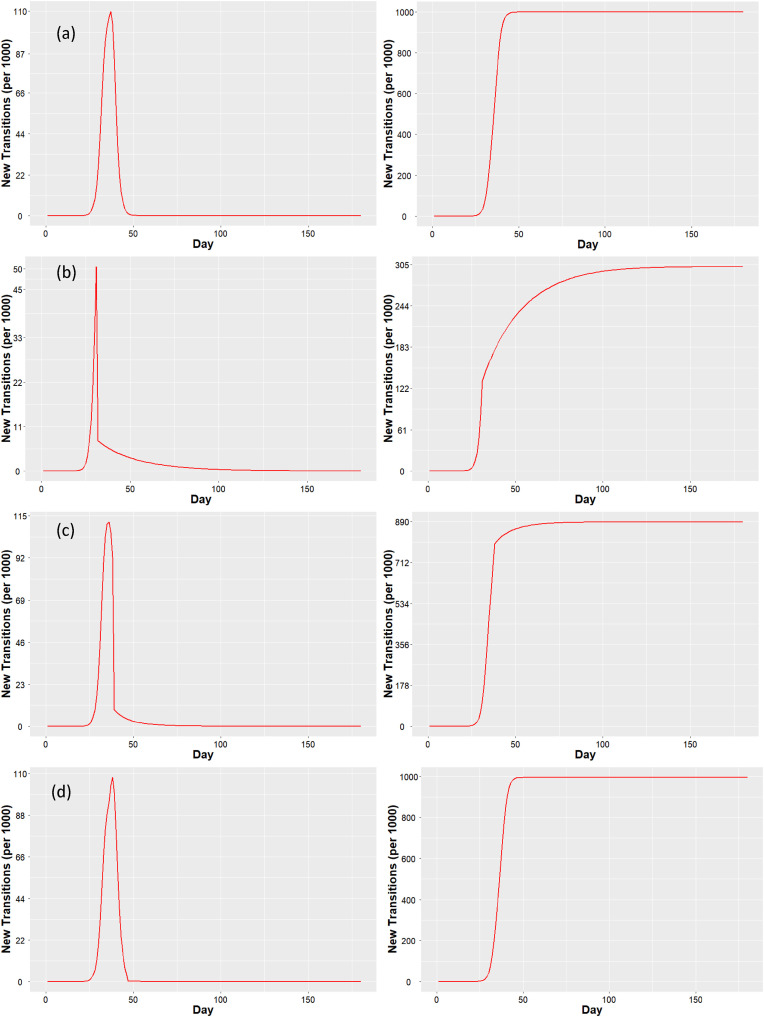
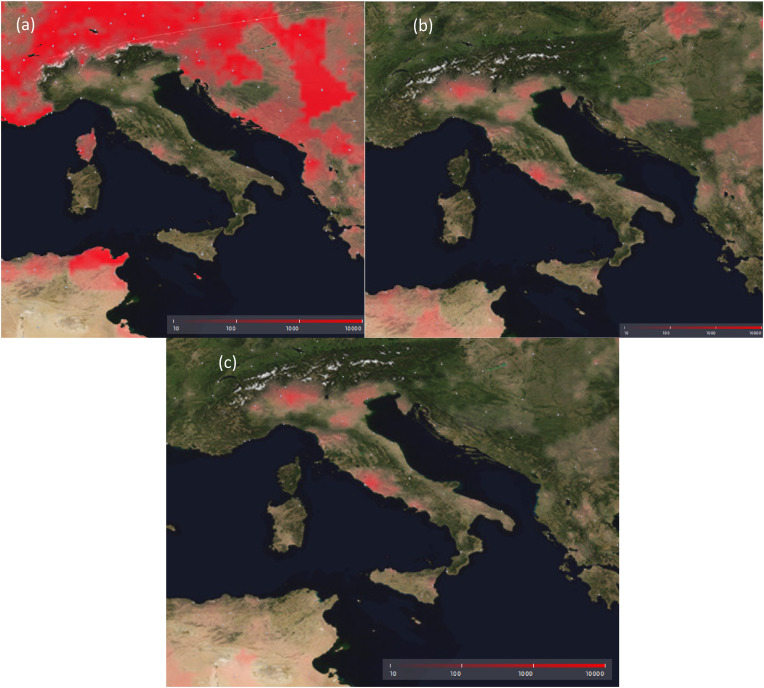
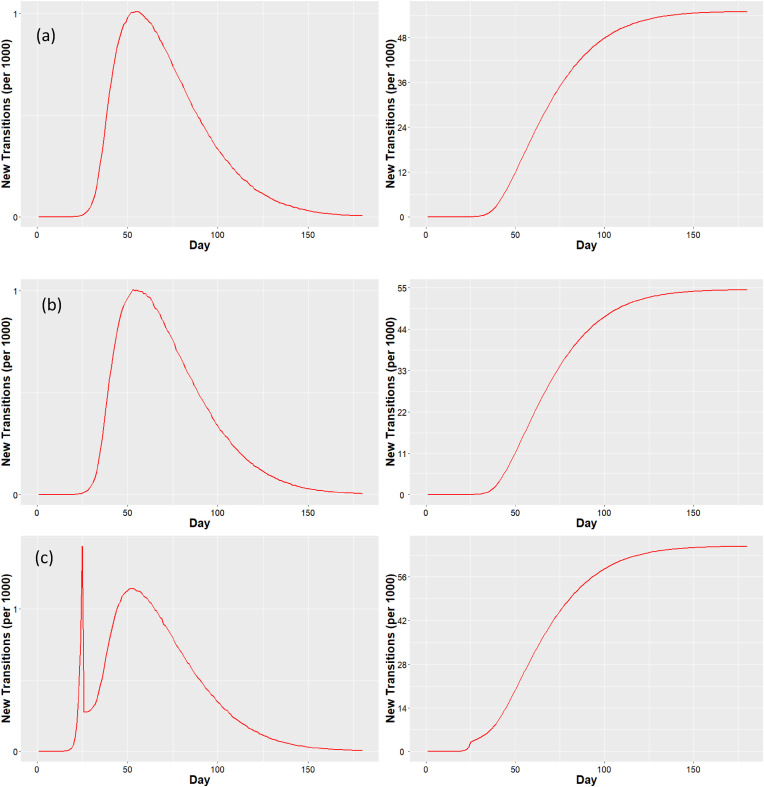
As the global population increases and transportation connectivity improves in quality and prices, the demand for mobility increases, especially in long-haul services. According to the 2017 report of the European Commission in Mobility and Transport, the performance of all modes for passenger transport (roadways and airways) are reaching record highs. Although the benefits of the increased demand for mobility are substantial and welcome, an effort should be paid such as to ameliorate possible threatening side-effects that may also arise. As World Health Organization (WHO) denotes and as has been evident from the global COVID-19 epidemic outbreak, infectious diseases can be spread directly or indirectly from one person to another under common exposure circumstances such as air transportation (especially long-haul airline connections) that may act as the medium for transmitting and spreading infectious diseases. In this paper, analytical and realistic models have been integrated, for providing evidence on the spread dynamics of infectious diseases that may face Europe through the airlines system. In particular, a detailed epidemiological model has been integrated with the airlines' and land transport network, able to simulate the epidemic spread of infectious diseases originated from distant locations. Additionally, a wide set of experiments and simulations have been conducted, providing results from detailed stress-tests covering both mild as well as aggressive cases of epidemic spreading scenarios. The results provide convincing evidence on the effectiveness that the European airports' system offer in controlling the emergence of epidemics, but also on the time and extent that controlling measures should be taken in order to break the chain of infections in realistic cases.

Keywords: Airlines' network; Epidemics modelling; European airports' security; Infectious diseases spreading.


Figures

Fig. 1
Fig. 1
Airports that were concerned in: a) Scenario 1-Africa; b) Scenario 2-Asia and; Scenario 3-South America.
Fig. 2
Fig. 2
Overall infectious diseases modeling approach.
Fig. 3
Fig. 3
Density of airports within the European region.
Fig. 4
Fig. 4
European population density.
Fig. 5
Fig. 5
Complexity of the global air transportation network.
Fig. 6
Fig. 6
Map showing the airports studied and the critical airports based on the three Centrality metrics.
Fig. 7
Fig. 7
Results of the simulation based on the three Scenarios and on different epidemic parameters (transmission rate and recover rate): a) Scenario 1, μ = 0,1; b) Scenario 1, μ = 0,2; c) Scenario 1, μ = 0,3; d) Scenario 2, μ = 0,1; e) Scenario 2, μ = 0,2; f) Scenario 2, μ = 0,3; g) Scenario 3, μ = 0,1; h) Scenario 3, μ = 0,2; i) Scenario 3, μ = 0,3.
Fig. 8
Fig. 8
Disease dynamics within the European region and for the case of Frankfurt analyzing the different stages of the virus: a) Day 6 the disease originates from popular African airports; b) Day 16 first infection on Frankfurt; c) Day 25, 331 infections were recorded in the city of Frankfurt; d) Day 38 Frankfurt recorded the higher number of infections; e) Day 84 the number of diseases was reduced and eliminated for Frankfurt; f) Day 365 infected population in Europe and the entire world were recovered from the disease.
Fig. 9
Fig. 9
Treemap depicting the extent of infection for each continent in the cases; a) Scenario 1 without monitoring strategies; b) Scenario 1 with monitoring strategies only in critical airports; c) Scenario 1 with monitoring strategies in the countries with critical airports.
Fig. 10
Fig. 10
Diagrams of the distribution of infections and cumulative numbers of infections for a) Scenario 1 without monitoring strategies; b) Scenario 1 with monitoring strategies only in critical airports; c). Scenario 1 with monitoring strategies in the countries with critical airports.
Fig. 11
Fig. 11
Diagrams of the distribution of infections and cumulative numbers of infections for a) Scenario 1 without monitoring strategies; b) Scenario 1 with monitoring strategies only in critical airports; c) Scenario 1 with monitoring strategies in the countries with critical airports.
Fig. 12
Fig. 12
Distribution of infections in the European countries for: a) the case where there are no gating strategies; b) the case where gating strategies were set for critical airports; c) the case where gating strategies were set for countries; d) gating policies in Europe when it records approximately 30.000 infections and d’ focusing on the scale of the countries; e) gating policies in Europe when it records approximately 100.000 infections and e’ focusing on the scale of the countries.
Fig. 13
Fig. 13
Map of Italy depicting the conditions were a disease starts to form Asia and there are: a) no control/restrictions applied in Italy; b) when gating measures are taken in Italy in after 31 days of the outbreak; c) when gating measures are taken in Italy in after 39 days of the outbreak; d) when gating measures are taken in Italy in after 47 days of the outbreak.
Fig. 14
Fig. 14
Epidemic dynamics in the case of Italy depicting the conditions were a disease starts to form Asia and there are: a) no control/restrictions applied in Italy; b) when gating measures are taken in Italy in after 31 days of the outbreak; c) when gating measures are taken in Italy in after 39 days of the outbreak; d) when gating measures are taken in Italy in after 47 days of the outbreak.
Fig. 15
Fig. 15
Map of Italy depicting the conditions were a disease starts to form Asia and there are: a) there are health and safety measures in Italy; b) gating when Italy records 617 total infections; c) when gating strategies are taken when the total number of infections in Italy reached 5456 (per 1000) infections.
Fig. 16
Fig. 16
Epidemic dynamics of Italy depicting the conditions were a disease starts to form Asia and there are: a) gating actions in Italy are applied immediately after the emergence of the epidemic; b) gating when Italy records 617 total infections; c) gating when the total number of infections in Italy reached 5456 (per 1000) infections.

References

    1. Angeloudis P., Fisk D. Large subway systems as complex networks. Phys. Stat. Mech. Appl. 2006;367:553–558. Matamalas, Arenas and Gómez, 2018.
    1. Balcan D., Gonçalves B., Hu H., Ramasco J., Colizza V., Vespignani A. Modeling the spatial spread of infectious diseases: the Global Epidemic and Mobility computational model. J. Comput. Sci. 2010;1(3):132–145. - PMC - PubMed
    1. Balcan D., Hu H., Goncalves B., Bajardi P., Poletto C., Ramasco J., Paoletti D., Perra N., Tizzoni M., Van den Broeck W., Colizza V., Vespignani A. Seasonal transmission potential and activity peaks of the new influenza A(H1N1): a Monte Carlo likelihood analysis based on human mobility. BMC Med. 2009;7(1) - PMC - PubMed
    1. Barabási L.-A. first ed. Cambridge University Press; 2016. Network Science.
    1. Berman O., Gavious A., Menezes M. Optimal response against bioterror attack on airport terminal. Eur. J. Oper. Res. 2012;219(2):415–424.

LinkOut - more resources