Review
. 2020 Nov:90:105350.
doi: 10.1016/j.cnsns.2020.105350. Epub 2020 May 22.

Extreme events and emergency scales

Affiliations
Review

Extreme events and emergency scales

Veniamin Smirnov et al. Commun Nonlinear Sci Numer Simul. 2020 Nov.

Abstract

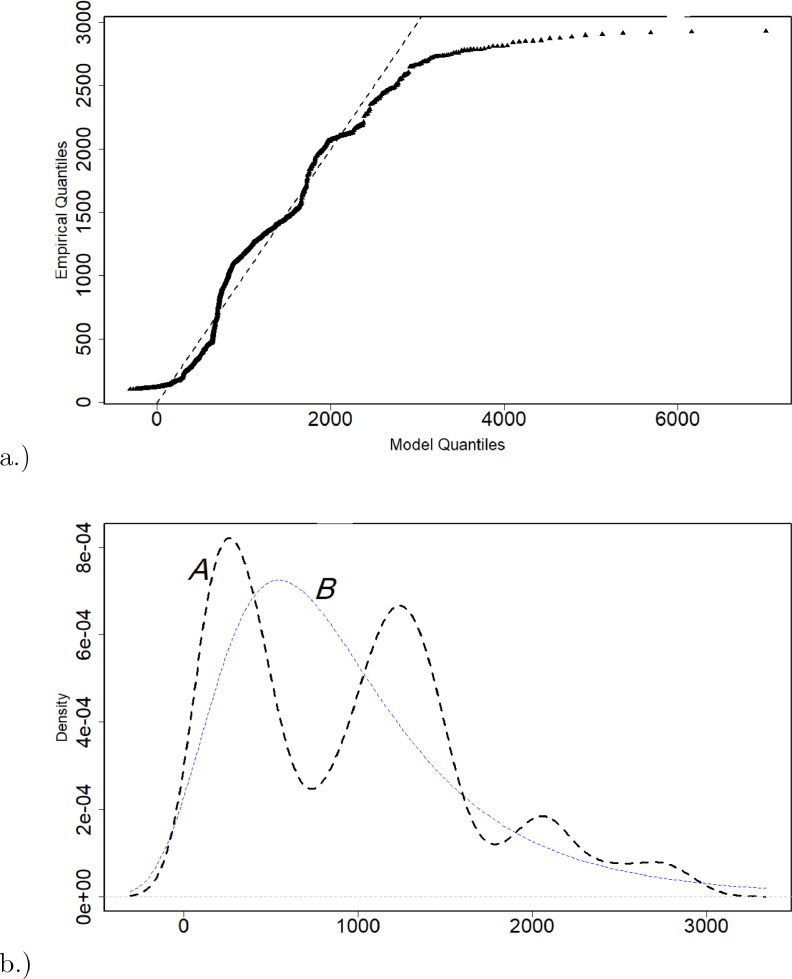
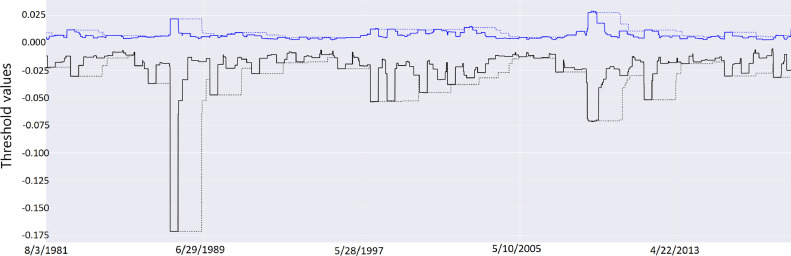
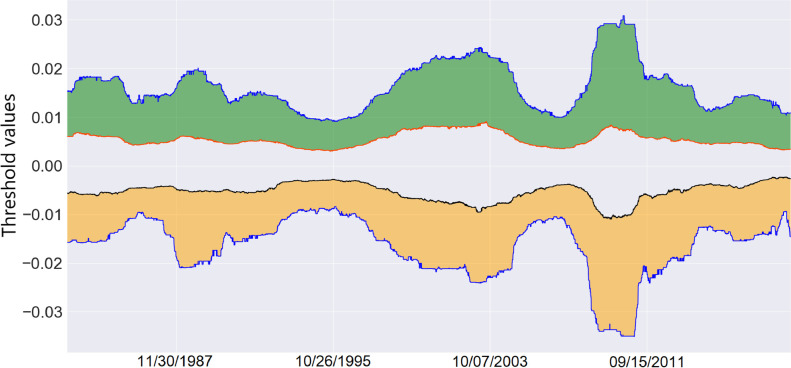
An event is extreme if its magnitude exceeds the threshold. A choice of a threshold is subject to uncertainty caused by a method, the size of available data, a hypothesis on statistics, etc. We assess the degree of uncertainty by the Shannon's entropy calculated on the probability that the threshold changes at any given time. If the amount of data is not sufficient, an observer is in the state of Lewis Carroll's Red Queen who said "When you say hill, I could show you hills, in comparison with which you'd call that a valley". If we have enough data, the uncertainty curve peaks at two values clearly separating the magnitudes of events into three emergency scales: subcritical, critical, and extreme. Our approach to defining the emergency scale is validated by 39 years of Standard and Poor's 500 (S&P500) historical data.

Keywords: Emergency scales; Extreme events; Uncertainty of threshold.


Conflict of interest statement

The authors declare no conflict of interests.

Figures

Fig. 1
Fig. 1
Degree of uncertainty of different values of the thresholds based on the amount of trading days taken into account. Three shaded regions mark three scales of emergency: I - subcritical, II - critical, III - extreme and the solid curve represents uncertainty of the Red Queen State.
Fig. 2
Fig. 2
The S&P 500 Index of 500 large-cap U.S. stocks assessing market performance.
Fig. 3
Fig. 3
The S&P 500 index log-return at market close.
Fig. 4
Fig. 4
Distribution of log-return values in the log 2-linear scale. Solid lines correspond to a Zipf’s Law (x1), dotted lines represent Power Law (x3.5), and dashed lines correlate to Gaussian distribution (exp(x2)). Curves are given for reference only.
Fig. 5
Fig. 5
The q-order Hurst exponents Hq for the time series of positive (the dashed line) and negative (the bold line) log-returns.
Fig. 6
Fig. 6
(a) A general extreme value QQ-plot with maximum likelihood estimation; (b) Density plot of empirical data where a dashed curve A is based on the empirical data, and a dashed curve B is modeled. N=2036 and bandwidth is 135.9.
Fig. 7
Fig. 7
Mean residual life plot for the S&P 500 positive returns. Solid jagged line is empirical MRL with approximate pointwise Wald 95% confidence intervals as dashed lines. The threshold u is estimated at 0.016. A vertical dashed line marks this threshold.
Fig. 8
Fig. 8
Mean residual life plot for the S&P 500 negative returns. Solid jagged line is empirical MRL with approximate point-wise Wald 95% confidence intervals as dashed lines. The threshold u is estimated at 0.017. A vertical dashed line marks this threshold.
Fig. 9
Fig. 9
Distribution of exceedances normalized by thresholds u=0.016 for positive and u=0.017 for negative returns, respectively. Dotted lines represent Zipf’s Law (x1), dash dot lines represent Gaussian distribution (exp(x2)) and dashed lines represent power law (x3.3). The curves are given for reference only.
Fig. 10
Fig. 10
(a) Quantile-Quantile plot with maximum likelihood estimation for the negative threshold; (b) QQ-plot with maximum likelihood estimation for the positive threshold.
Fig. 11
Fig. 11
Value of the thresholds for positive and negative log-return based on L-moments. The solid black and blue lines correspond to negative and positive log return thresholds, respectively, and based on a window of 100 trading days. The dotted black and blue lines correspond to negative and positive log return thresholds, respectively, and based on a window of 400 trading days. (For interpretation of the references to color in this figure legend, the reader is referred to the web version of this article.)
Fig. 12
Fig. 12
Possible threshold changing ranges from 03/11/1981 to 12/31/2018 based on 300 preceding trading days. A green strip represents positive log-return and an orange strip shows the threshold domain for negative log-return values. (For interpretation of the references to color in this figure legend, the reader is referred to the web version of this article.)
Fig. 13
Fig. 13
Possible threshold changing ranges from 05/18/1982 to 12/31/2018 based on 600 preceding trading days. A green strip represents positive log-returns and an orange strip shows the threshold domain for negative log-return values. (For interpretation of the references to color in this figure legend, the reader is referred to the web version of this article.)
Fig. 14
Fig. 14
The probability that a threshold of the log-return values will be changed on any given day calculated over the different data windows ranging from 25 to 6000 trading days.
Fig. 15
Fig. 15
The statistics of time intervals (in days) between the sequential extreme events for the fixed threshold values, u=0.016 and u=0.017, for positive and negative fluctuations of the log-return respectively. The solid line t2 corresponding to the asymptotic quadratic decay (4.11) is given for reference.
Fig. 16
Fig. 16
Degree of uncertainty of different values of the thresholds based on the amount of trading days taken into account. Three shaded regions mark three scales of emergency: I - subcritical, II - critical, III - extreme and the solid curve represents the Red Queen State.

References

    1. Kaplan S. Lexis Nexis; UK: 2004. Tolley’s handbook of disaster and emergency management: pronciples and best practices; disaster and emergency management systems.
    1. Scale R.. Mercalli scale. https://www.usgs.gov/media/images/modified-mercalli-intensity-mmi-scale-....
    1. Beaufort. Wind scale. https://www.spc.noaa.gov/faq/tornado/beaufort.html.
    1. Saffir-Simpson. Hurricane wind scale. https://www.nhc.noaa.gov/aboutsshws.php. - PMC - PubMed
    1. Tornado F.. Damage scale. https://www.spc.noaa.gov/faq/tornado/f-scale.html.

LinkOut - more resources