

Estimation of Equipotent Doses for Anti-Inflammatory Effects of Prednisolone and AZD9567, an Oral Selective Nonsteroidal Glucocorticoid Receptor Modulator
- PMID: 32501650
- PMCID: PMC7438818
- DOI: 10.1002/psp4.12536
Estimation of Equipotent Doses for Anti-Inflammatory Effects of Prednisolone and AZD9567, an Oral Selective Nonsteroidal Glucocorticoid Receptor Modulator
Abstract
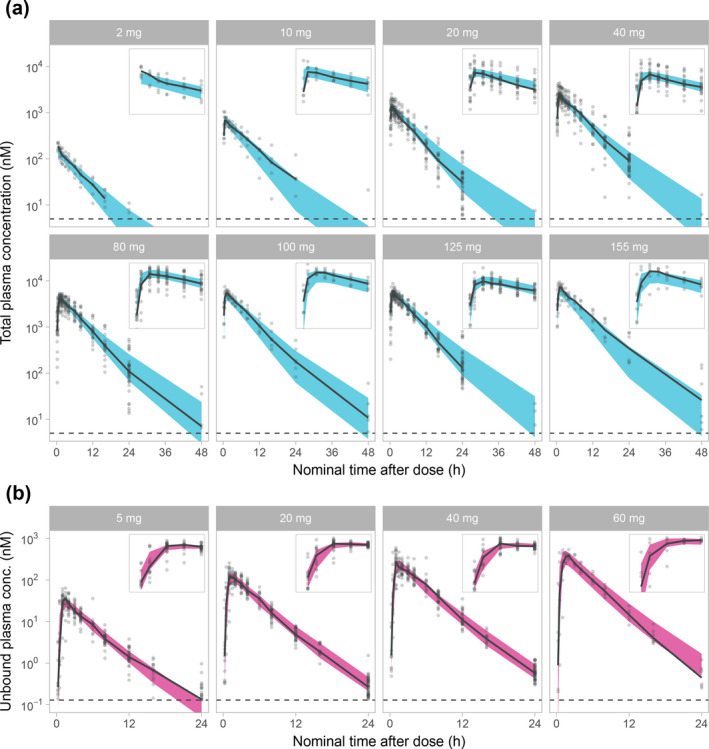
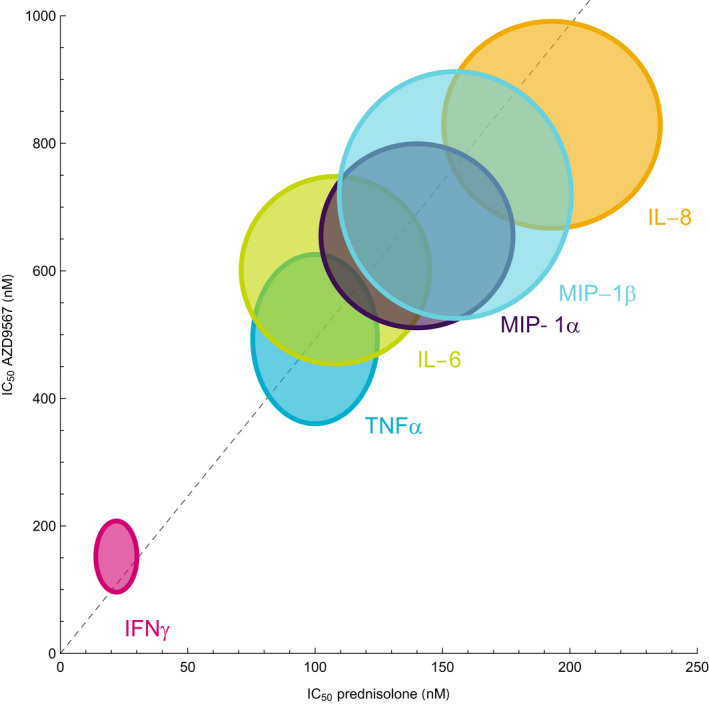
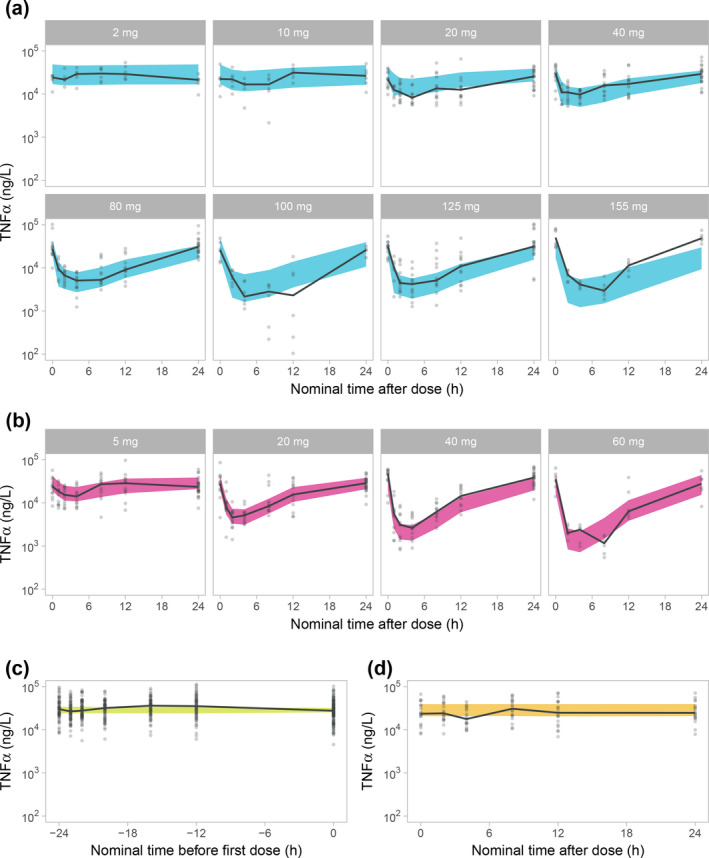
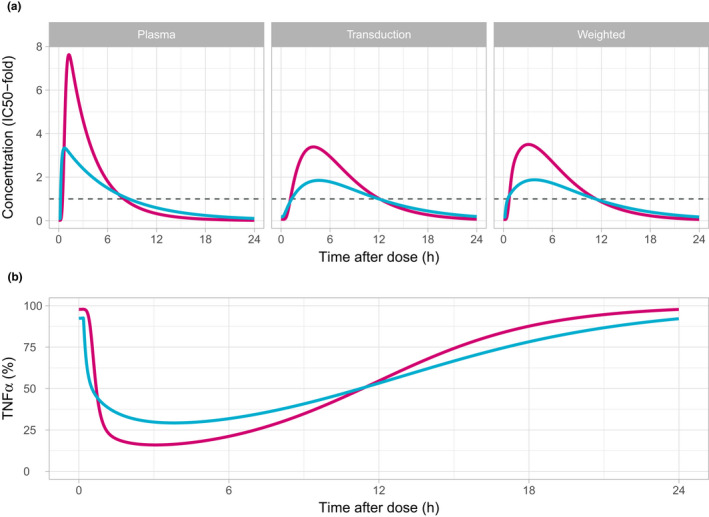
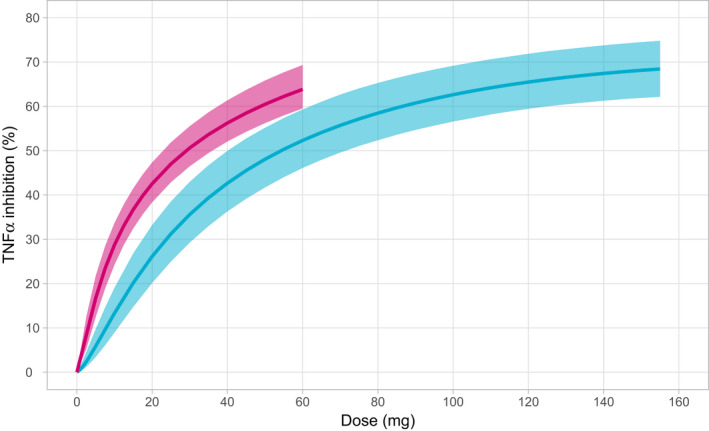
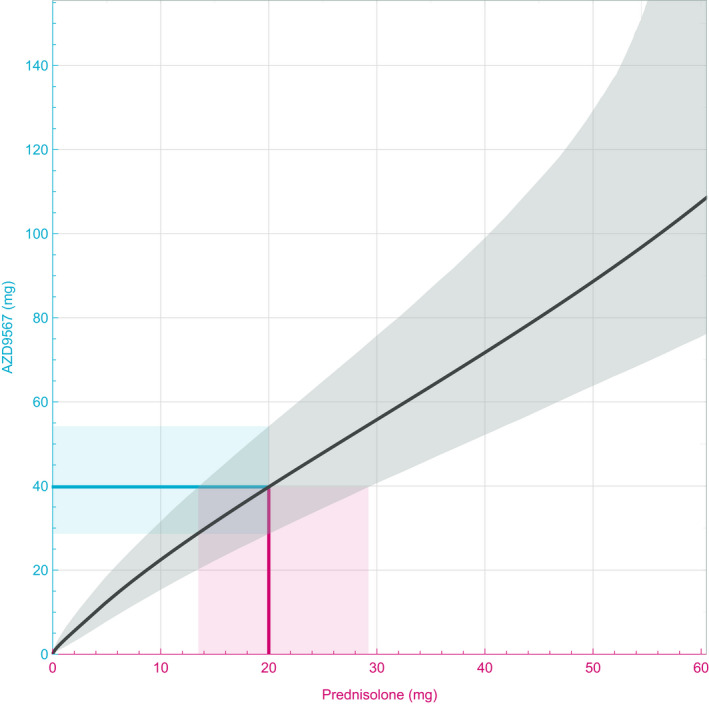
AZD9567 is a potent and selective nonsteroidal oral glucocorticoid receptor modulator. It is developed as an anti-inflammatory drug with improved safety profile compared with steroids like prednisolone. Throughout the clinical development of AZD9567, dose selection and data interpretation require a method for determining doses with the same anti-inflammatory effect as prednisolone. Equipotent doses of AZD9567 and prednisolone were defined by the same average inhibition of TNFα release, a biomarker of anti-inflammatory effect, measured in a lipopolysaccharide-stimulated whole blood ex vivo assay. Based on pharmacokinetic-pharmacodynamic models, TNFα dose-response relationships for AZD9567 and prednisolone were established. A comparison of the dose-response curves enabled estimation of an equipotency relationship. Specifically, 20 mg prednisolone was estimated to be equipotent to 40 mg AZD9567 (95% confidence interval: 29-54 mg). Static concentration-response analyses showed that the relative potencies for inhibition of TNFα release of AZD9567 and prednisolone were well aligned with several other pro-inflammatory cytokines.
© 2020 The Authors. CPT: Pharmacometrics & Systems Pharmacology published by Wiley Periodicals LLC on behalf of the American Society for Clinical Pharmacology and Therapeutics.
Conflict of interest statement
J.A., M.W.S., U.E., T.H.M., S.P., and J.L. are employees of AstraZeneca and may own stock or stock options.
Figures
Similar articles
-
AZD9567 versus prednisolone in patients with active rheumatoid arthritis: A phase IIa, randomized, double-blind, efficacy, and safety study.Clin Transl Sci. 2023 Dec;16(12):2494-2506. doi: 10.1111/cts.13624. Epub 2023 Oct 23. Clin Transl Sci. 2023. PMID: 37873558 Free PMC article. Clinical Trial.
-
Discovery of a Novel Oral Glucocorticoid Receptor Modulator (AZD9567) with Improved Side Effect Profile.J Med Chem. 2018 Mar 8;61(5):1785-1799. doi: 10.1021/acs.jmedchem.7b01690. Epub 2018 Feb 16. J Med Chem. 2018. PMID: 29424542
-
Effects of a selective glucocorticoid receptor modulator (AZD9567) versus prednisolone in healthy volunteers: two phase 1, single-blind, randomised controlled trials.Lancet Rheumatol. 2020 Jan;2(1):e31-e41. doi: 10.1016/S2665-9913(19)30103-1. Epub 2019 Dec 9. Lancet Rheumatol. 2020. PMID: 38258274
-
[Use of glucocorticoids in rheumatoid arthritis].Ugeskr Laeger. 2000 Feb 7;162(6):770-2. Ugeskr Laeger. 2000. PMID: 10689949 Review. Danish.
-
Biased regulation of glucocorticoid receptors signaling.Biomed Pharmacother. 2023 Sep;165:115145. doi: 10.1016/j.biopha.2023.115145. Epub 2023 Jul 14. Biomed Pharmacother. 2023. PMID: 37454592 Review.
Cited by
-
Pharmacometrics meets statistics-A synergy for modern drug development.CPT Pharmacometrics Syst Pharmacol. 2021 Oct;10(10):1134-1149. doi: 10.1002/psp4.12696. Epub 2021 Aug 19. CPT Pharmacometrics Syst Pharmacol. 2021. PMID: 34318621 Free PMC article.
-
AZD9567 versus prednisolone in patients with active rheumatoid arthritis: A phase IIa, randomized, double-blind, efficacy, and safety study.Clin Transl Sci. 2023 Dec;16(12):2494-2506. doi: 10.1111/cts.13624. Epub 2023 Oct 23. Clin Transl Sci. 2023. PMID: 37873558 Free PMC article. Clinical Trial.
References
-
- Ripa, L. et al Discovery of a novel oral glucocorticoid receptor modulator (AZD9567) with improved side effect profile. J. Med. Chem. 61, 1785–1799 (2018). - PubMed
-
- Vegiopoulos, A. & Herzig, S. Glucocorticoids, metabolism and metabolic diseases. Mol. Cell Endocrinol. 275, 43–61 (2007). - PubMed
-
- Liu, X.X. , Zhu, X.M. , Miao, Q. , Ye, H.Y. , Zhang, Z.Y. & Li, Y.M. Hyperglycemia induced by glucocorticoids in nondiabetic patients: a meta‐analysis. Ann. Nutr. Metab. 65, 324–332 (2014). - PubMed
-
- Berris, K.K. , Repp, A.L. & Kleerekoper, M. Glucocorticoid‐induced osteoporosis. Curr. Opin. Endocrinol. Diabetes Obes. 14, 446–450 (2007). - PubMed
Publication types
MeSH terms
Substances
LinkOut - more resources
Full Text Sources
Other Literature Sources
