Review
. 2020 Jul-Aug;40(4):1003-1019.
doi: 10.1148/rg.2020190180. Epub 2020 Jun 5.

Noninfectious Granulomatous Diseases of the Chest

Affiliations
Review

Noninfectious Granulomatous Diseases of the Chest

Muhammad Naeem et al. Radiographics. 2020 Jul-Aug.

Abstract

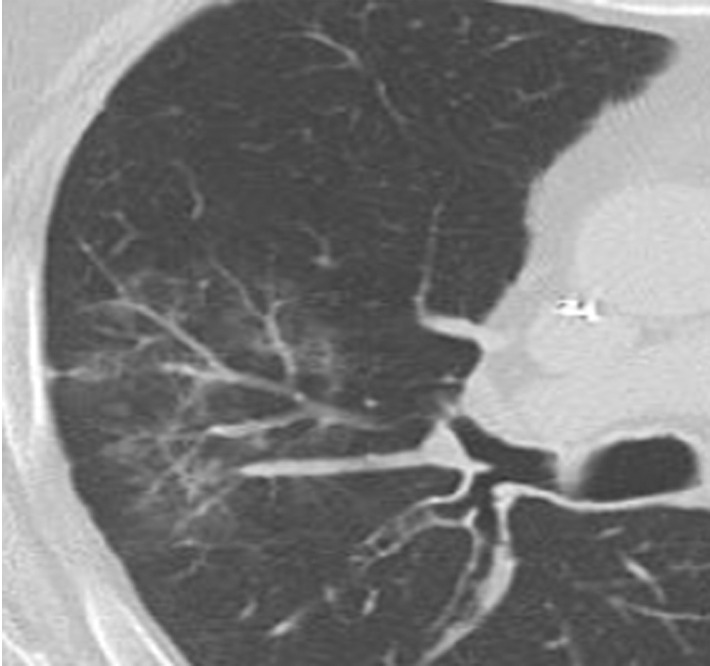
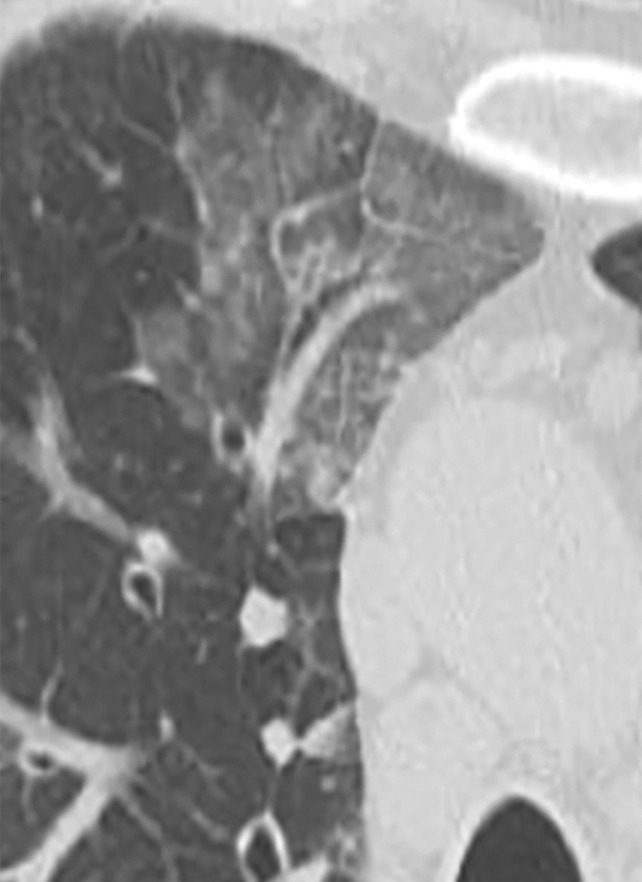
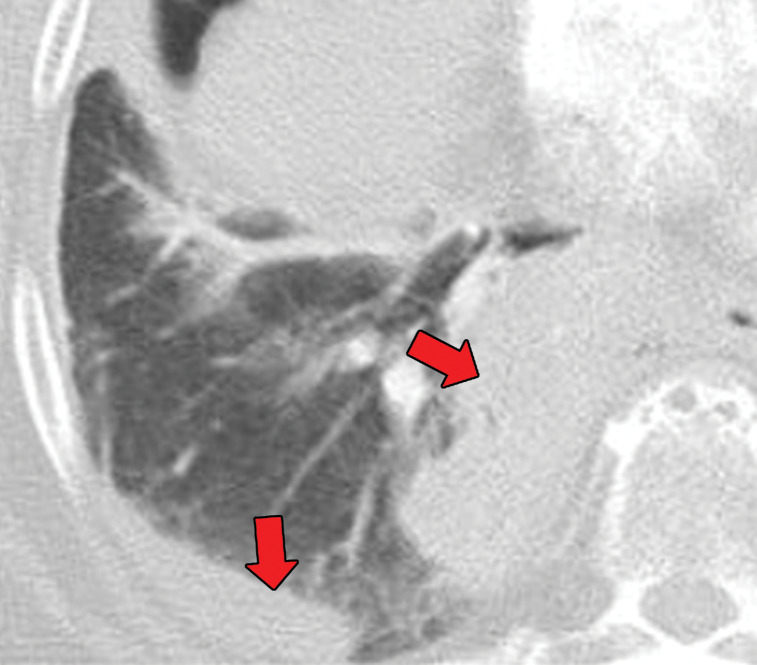
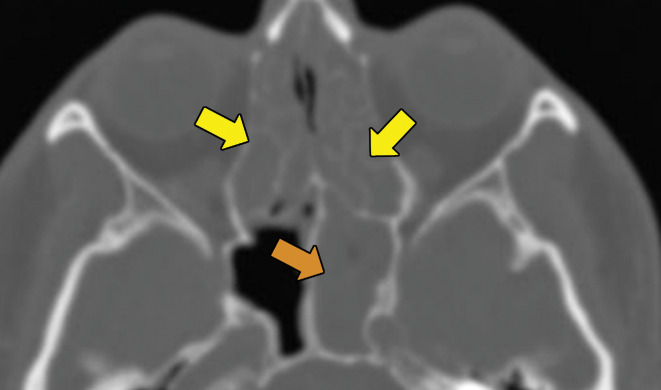
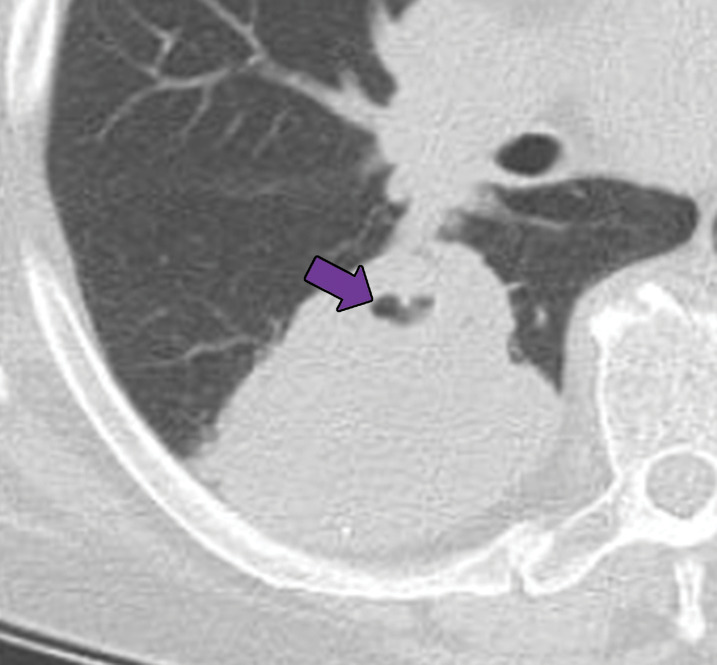
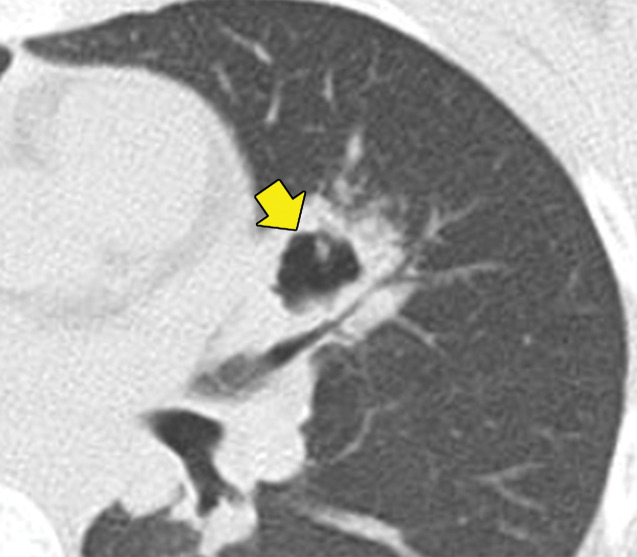
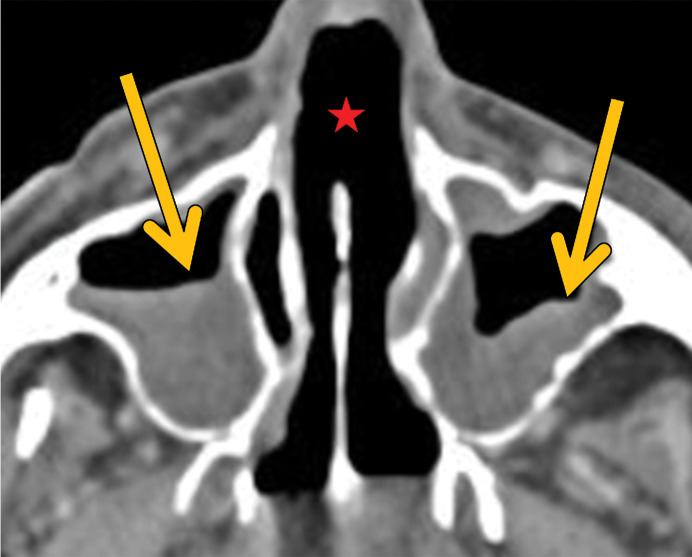
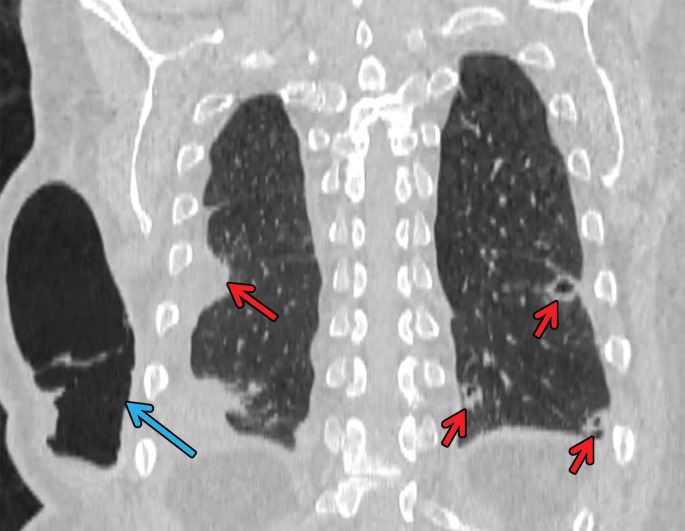
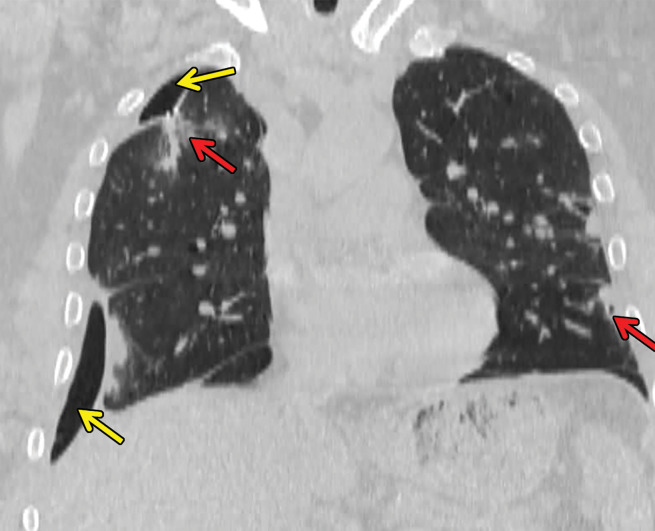
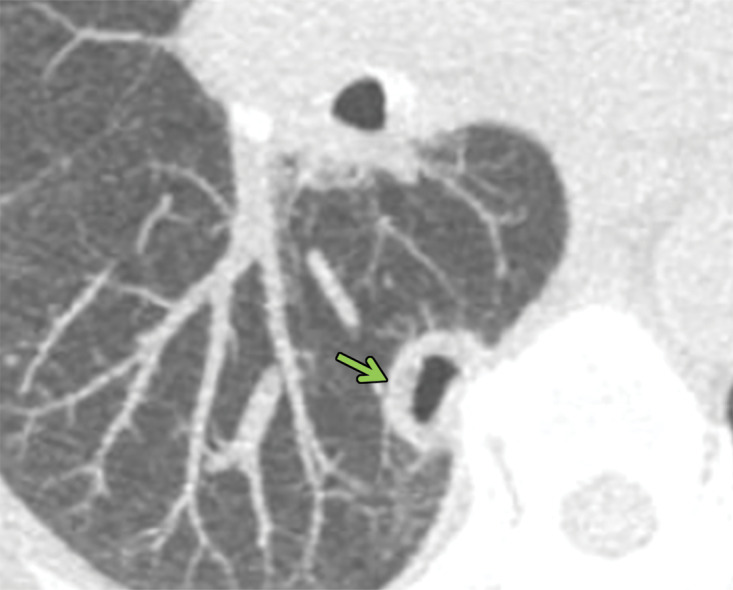
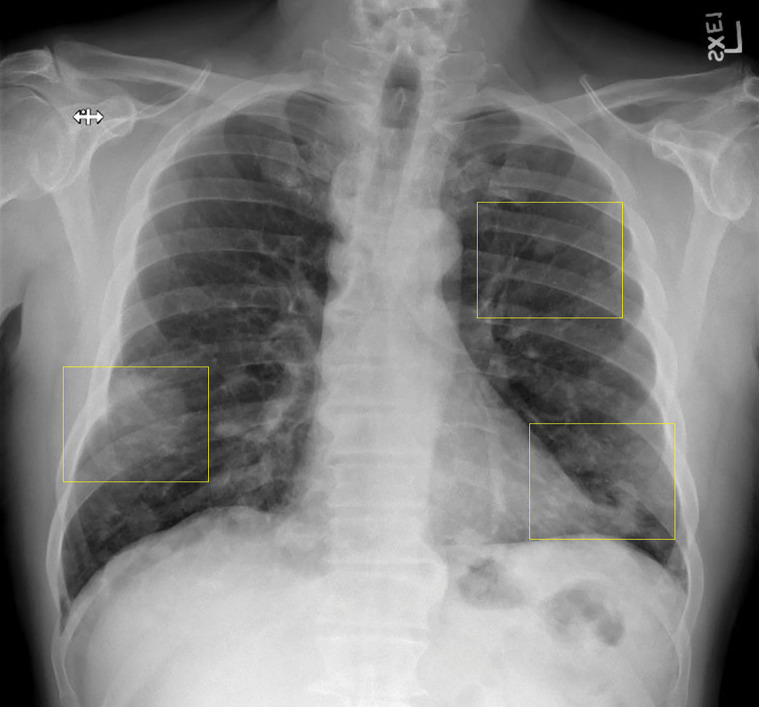
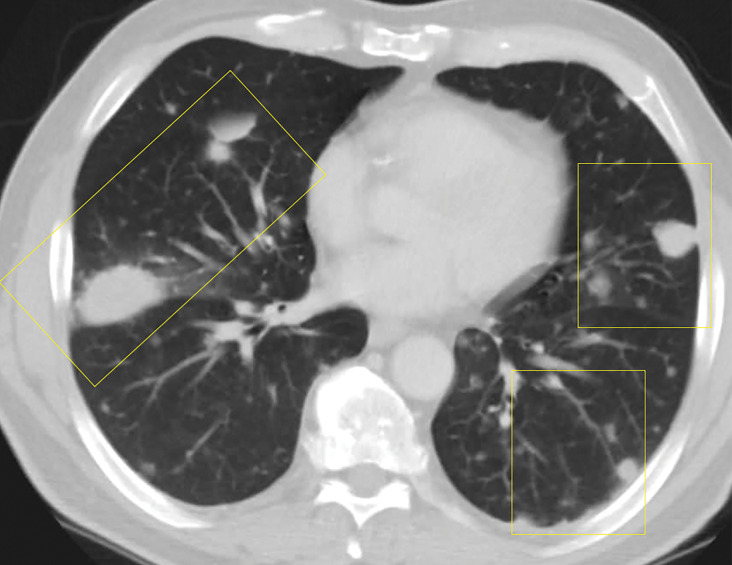
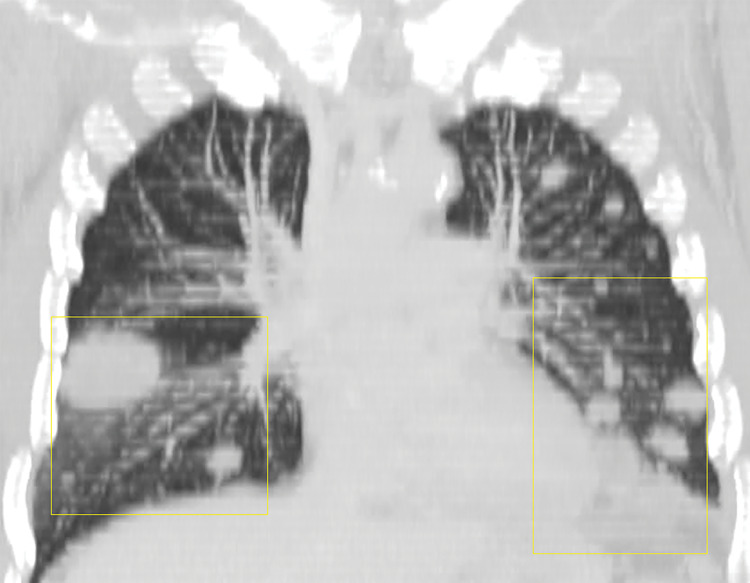
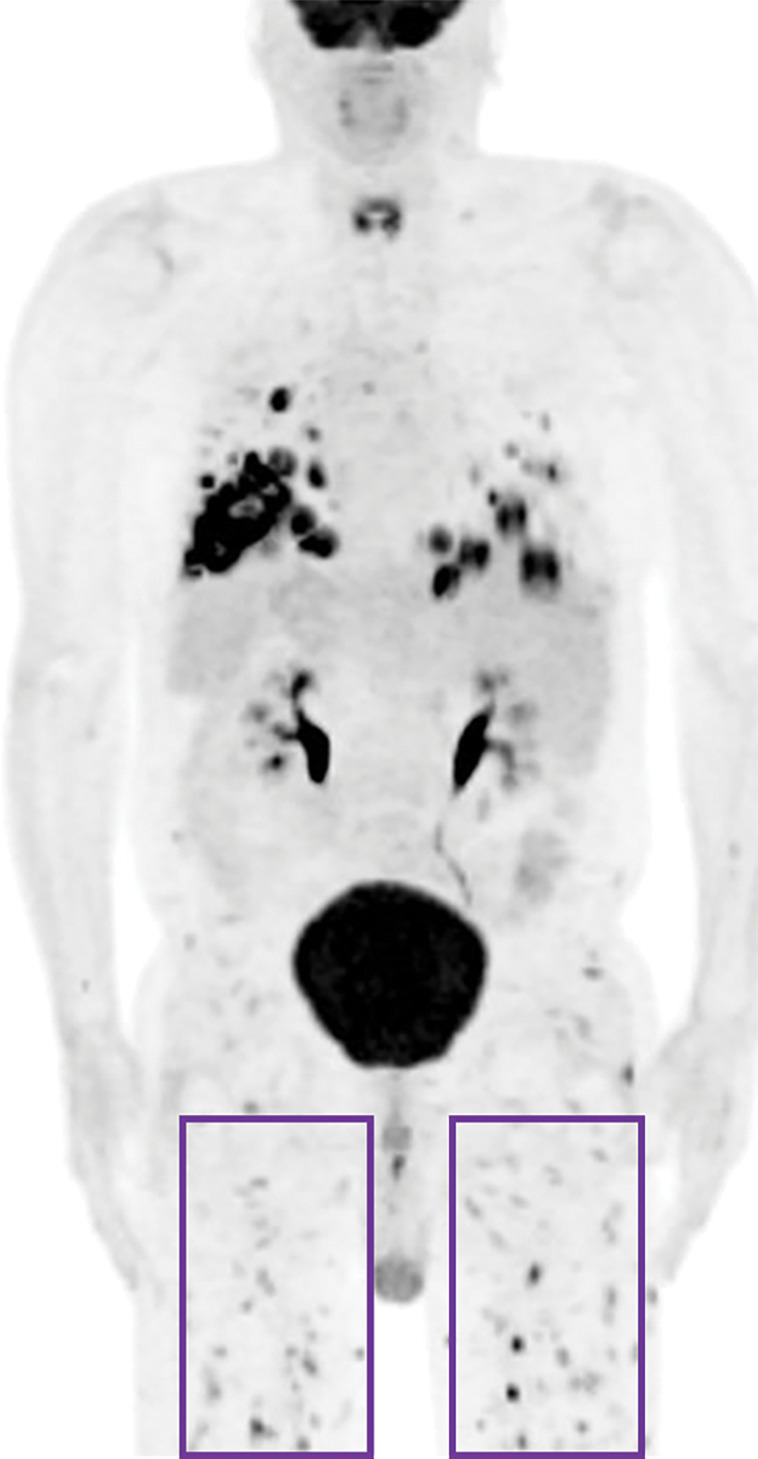
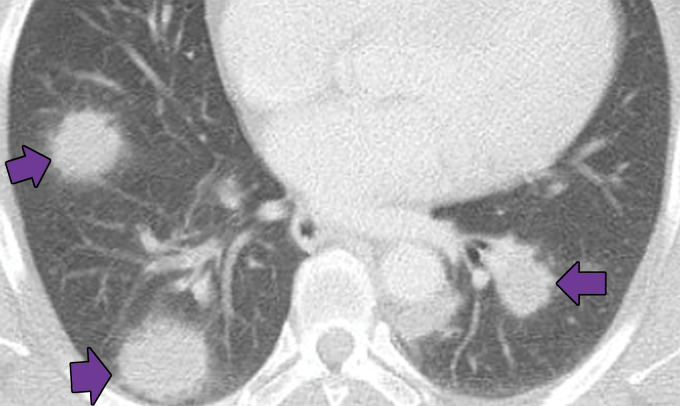
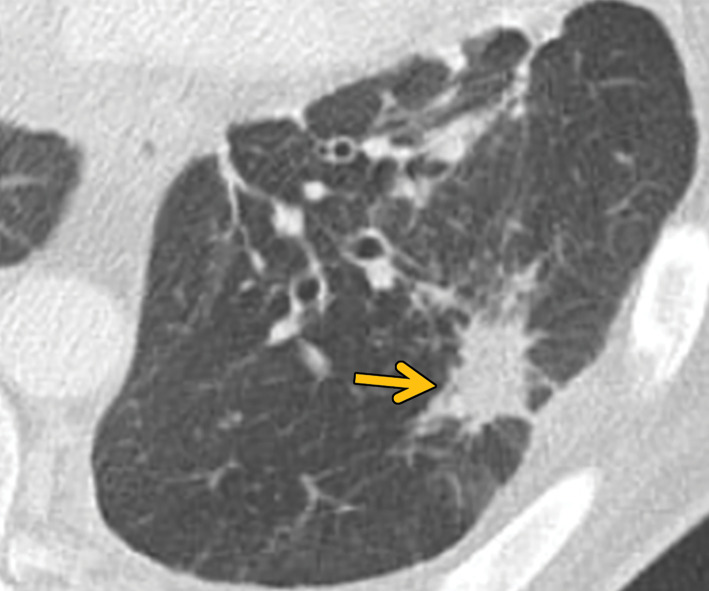
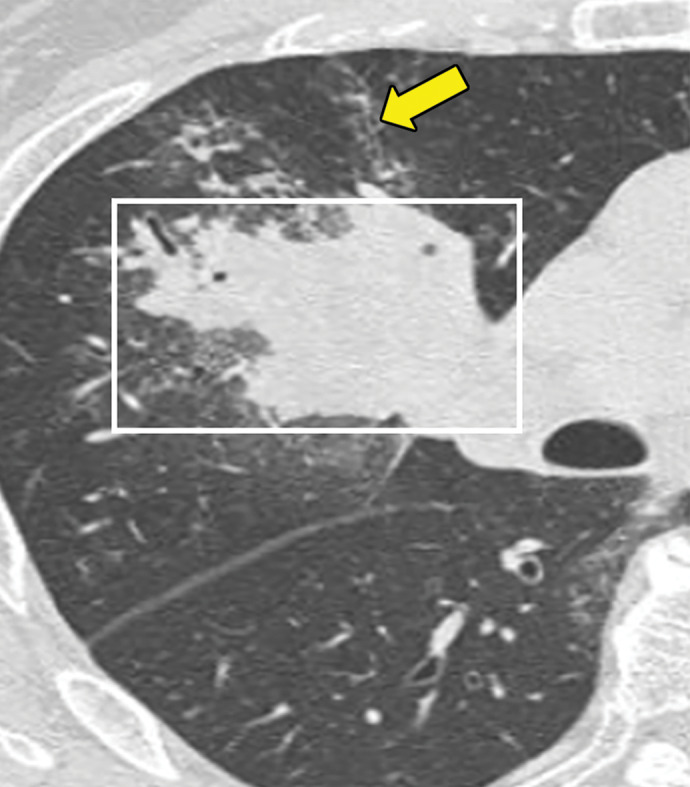
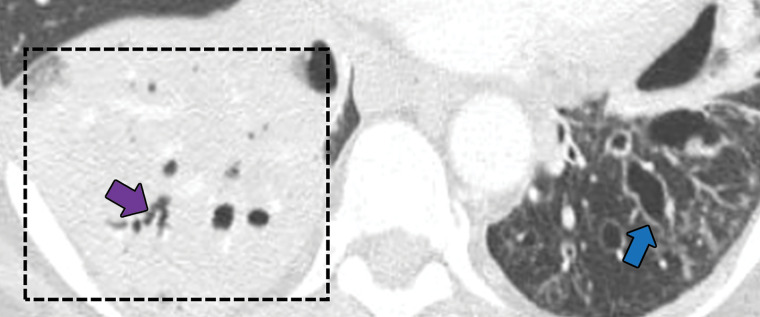
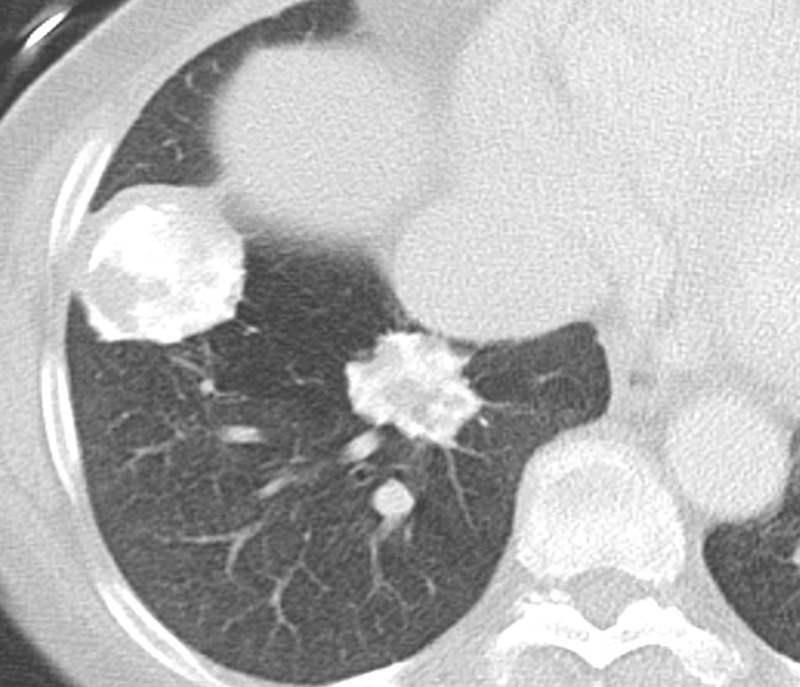
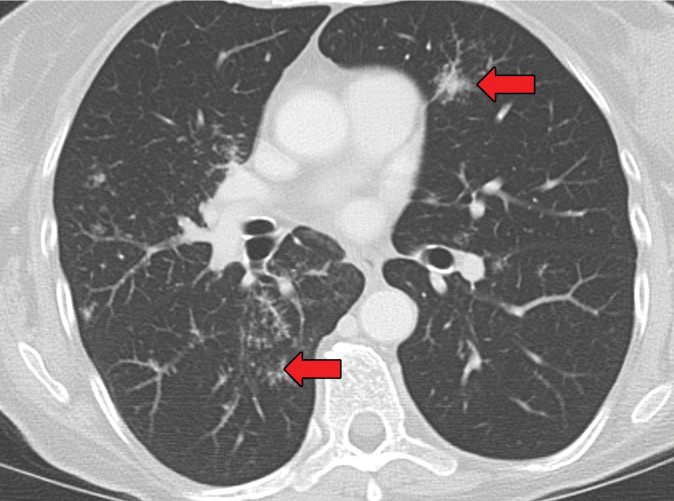
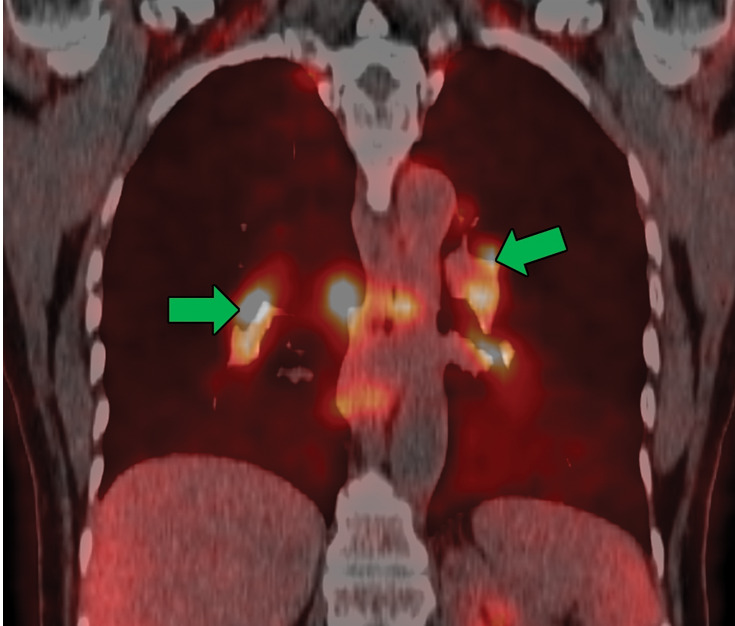
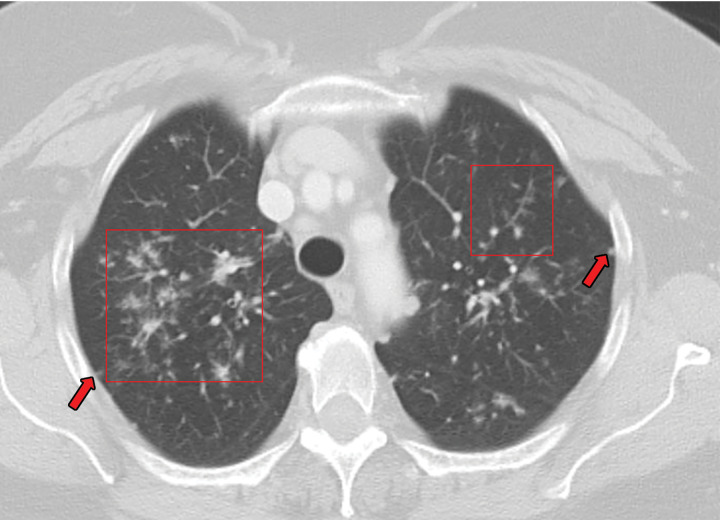
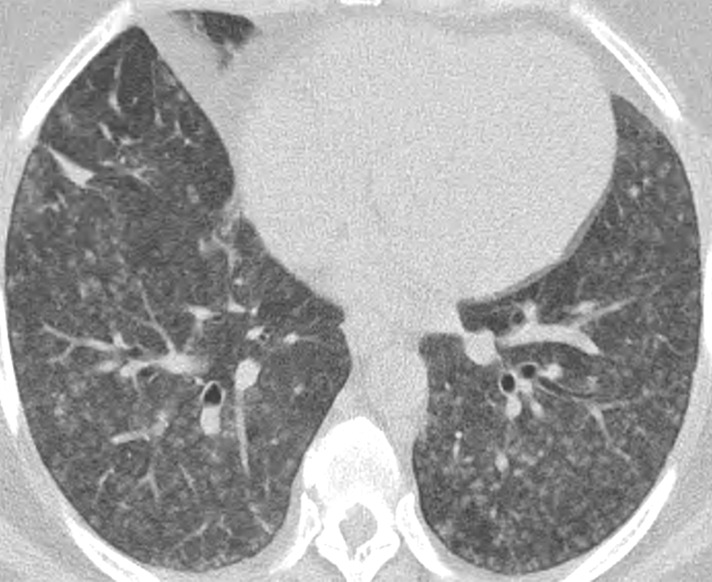
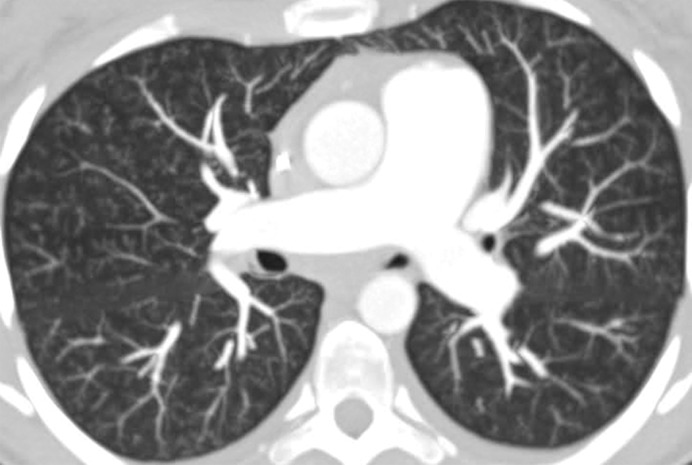
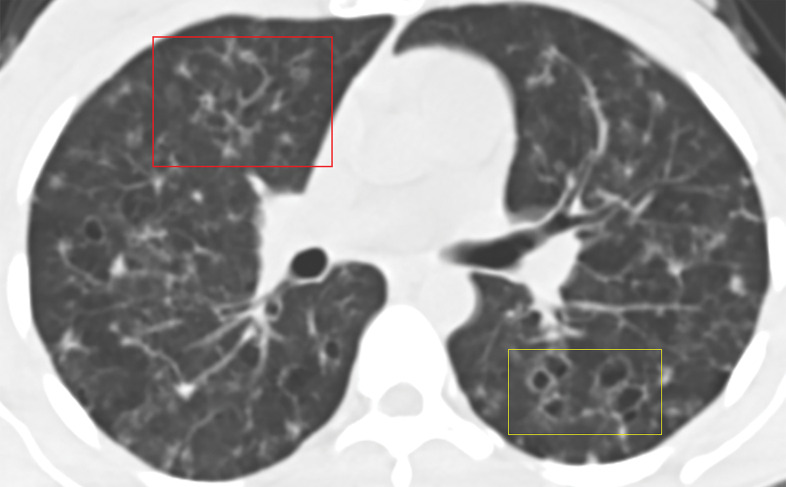
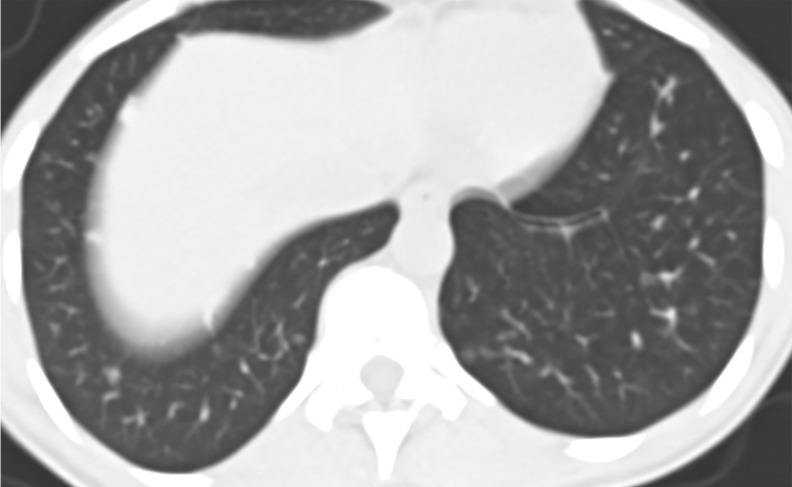
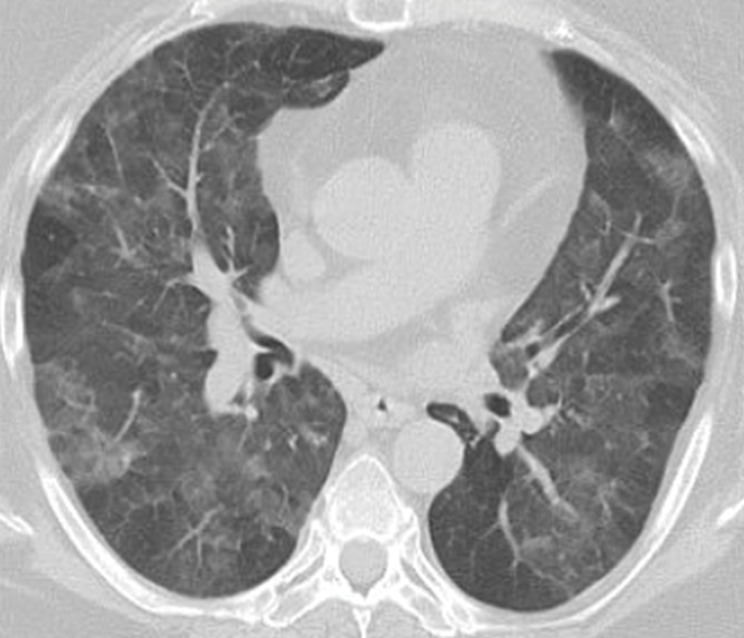
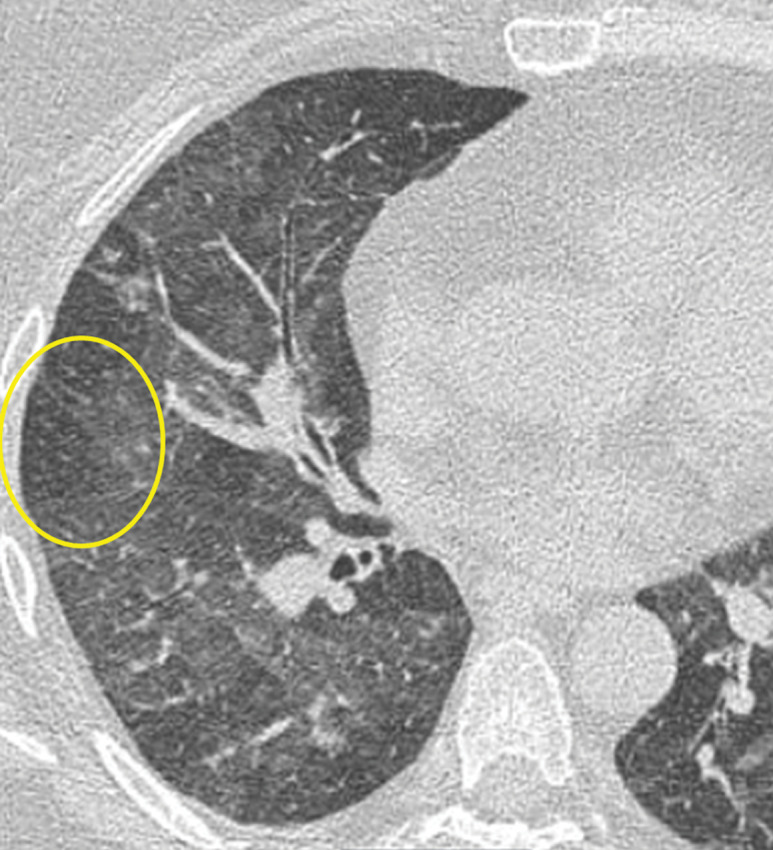
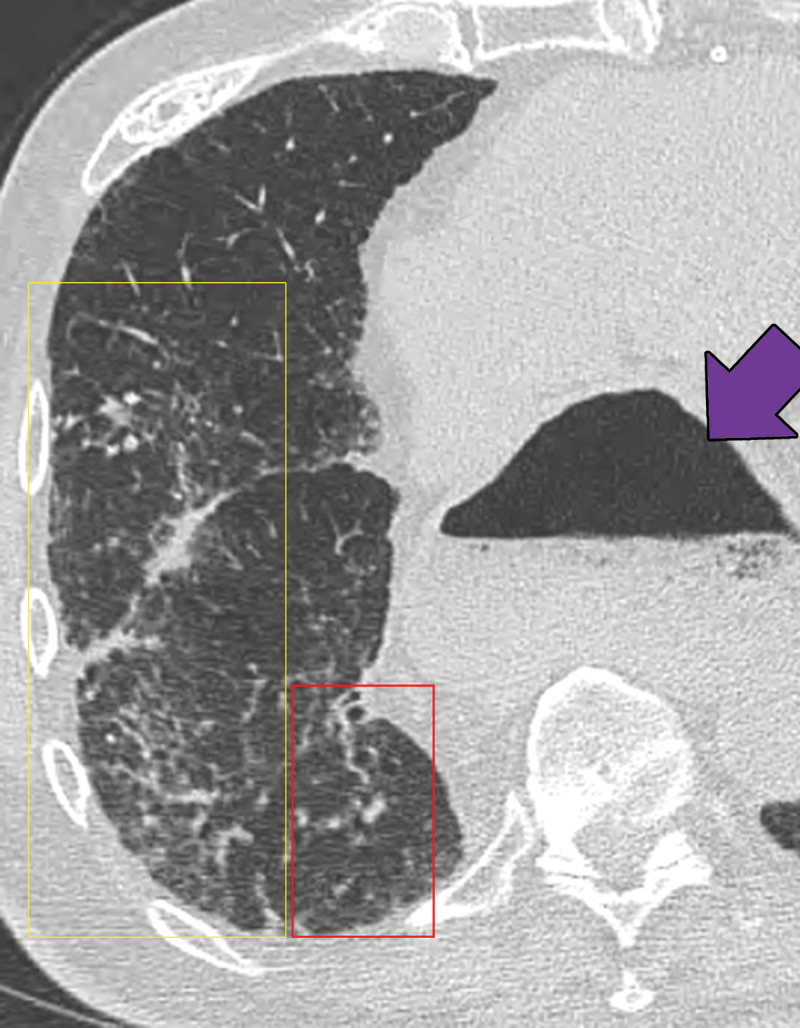
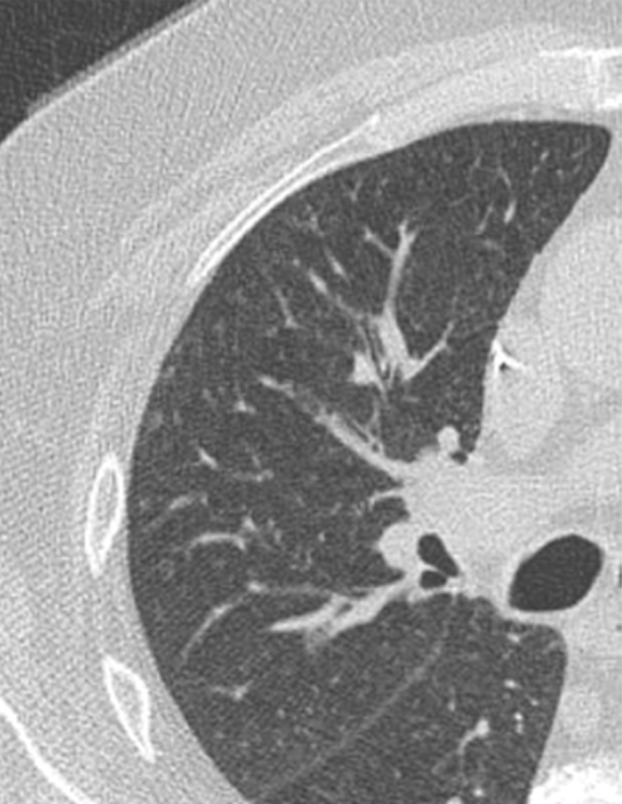
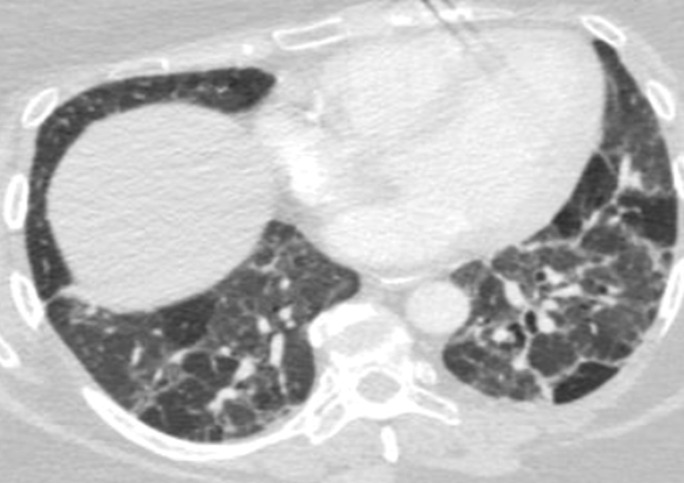
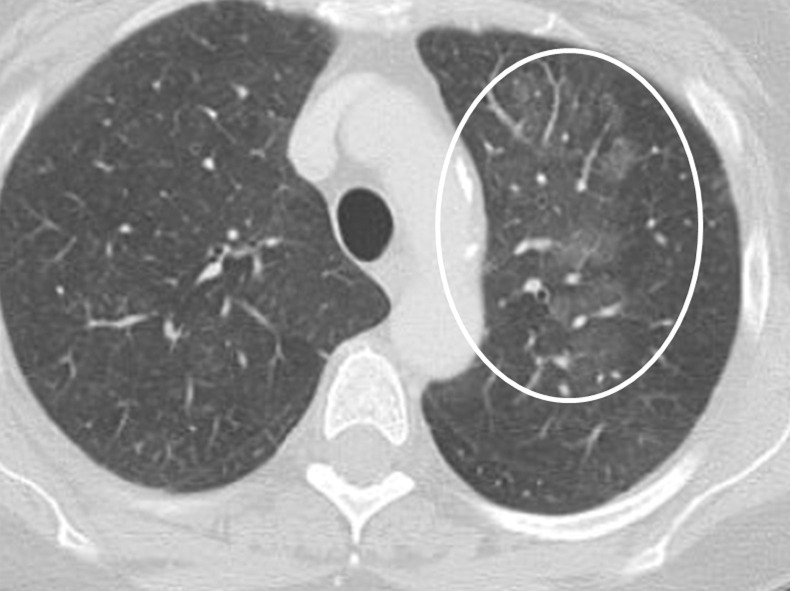
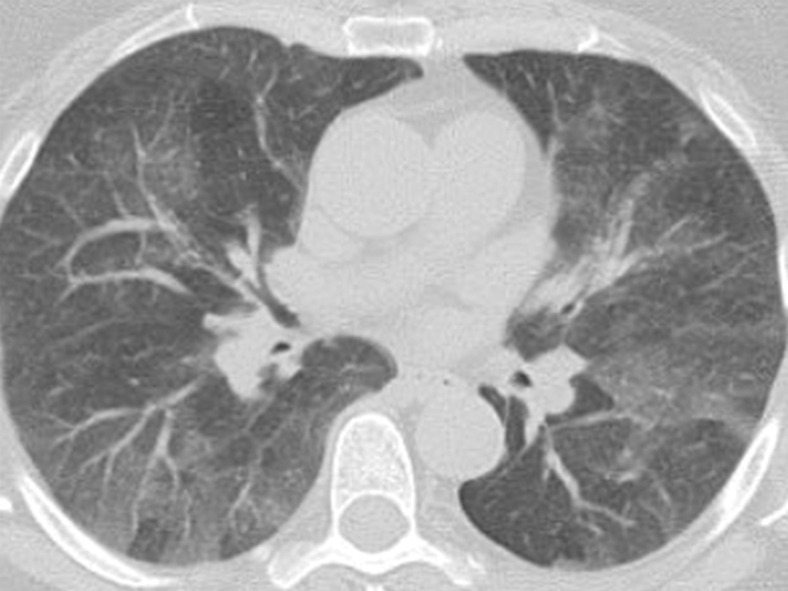
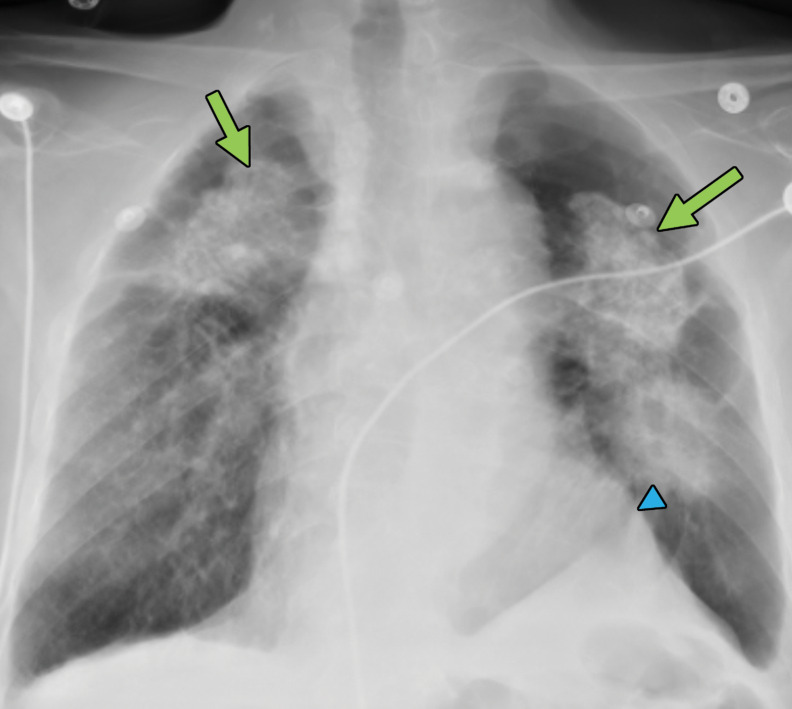
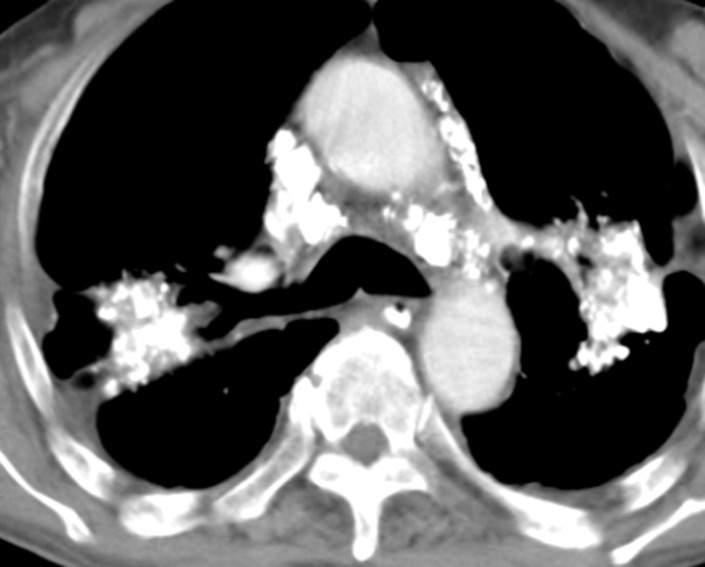
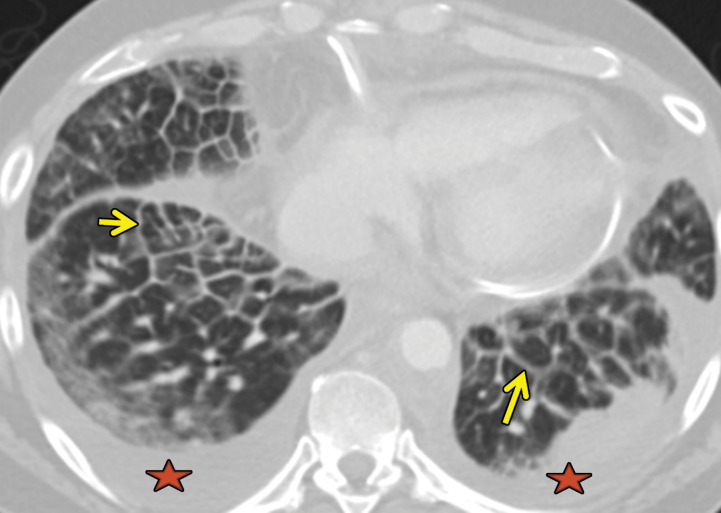
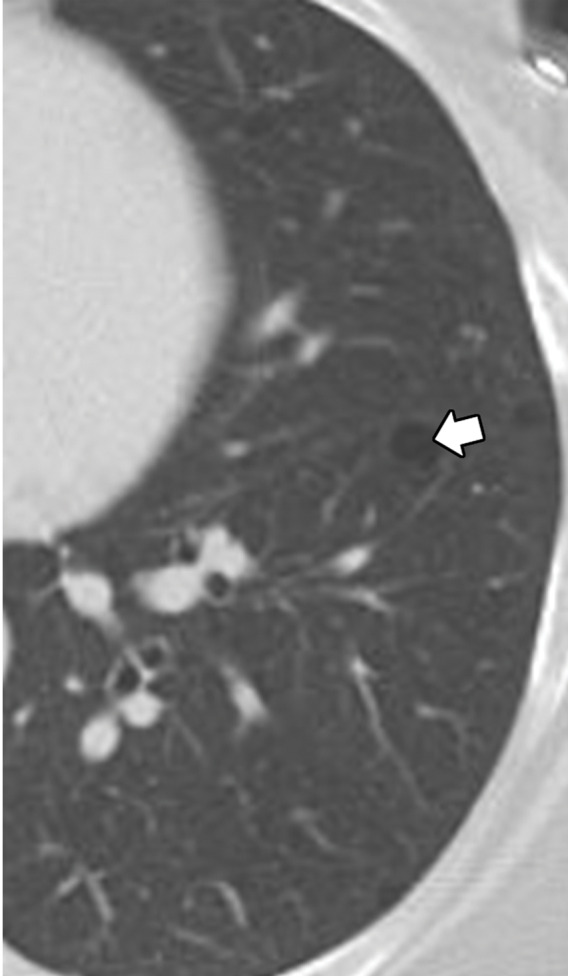
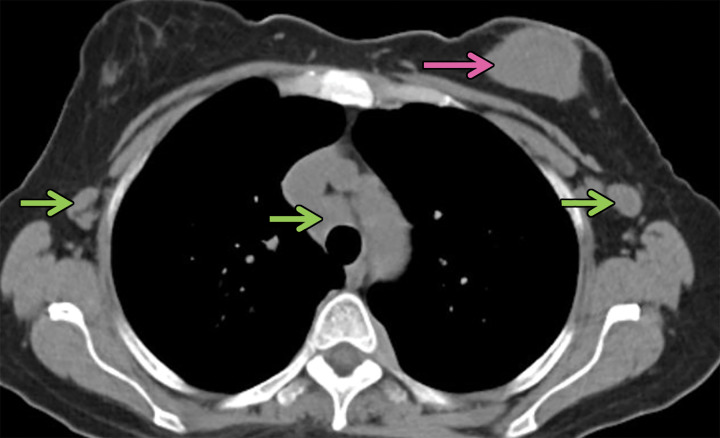
Granulomas are pathologically defined as focal aggregations of activated macrophages, Langerhans cells, and lymphocytes. Granulomas form in the lungs when the immune system barricades the substances it perceives as foreign but is unable to remove. Granulomas manifest with numerous imaging appearances in thoracic radiology, and their presence is a nonspecific finding. Granulomatous lung diseases comprise multiple entities with variable clinical manifestations and outcomes. Their imaging findings are rarely specific and can mimic malignancies, often triggering an extensive diagnostic workup. Radiologists must be familiar with the clinical manifestations and imaging findings of these entities to generate appropriate differential diagnoses. This review describes the imaging manifestations of various noninfectious, necrotizing, and nonnecrotizing granulomatous diseases that primarily affect the thorax. ©RSNA, 2020.


Figures

Flowchart categorization of various granulomatous diseases by imaging manifestations. BG = bronchocentric granulomatosis, CVID = common variable immunodeficiency, EGPA = eosinophilic granulomatosis with polyangiitis, GL-ILD = granulomatous and lymphocytic interstitial lung disease, GPA = granulomatosis with polyangiitis, IBD = inflammatory bowel disease, LG = lymphomatoid granulomatosis, pLCH = pulmonary Langerhans cell histiocytosis, RV = right ventricle.
Figure 1.
Flowchart categorization of various granulomatous diseases by imaging manifestations. BG = bronchocentric granulomatosis, CVID = common variable immunodeficiency, EGPA = eosinophilic granulomatosis with polyangiitis, GL-ILD = granulomatous and lymphocytic interstitial lung disease, GPA = granulomatosis with polyangiitis, IBD = inflammatory bowel disease, LG = lymphomatoid granulomatosis, pLCH = pulmonary Langerhans cell histiocytosis, RV = right ventricle.
Diagram shows the simplified version of sarcoid granuloma formation in steps. Antigens trigger the mast cell to release TNF (step 1), which then activates the neutrophils in the bloodstream (step 2). These activated neutrophils activate the monocytes (step 3). In a separate pathway, antigens activate natural killer (NK) cells (step 4), and these antigens are also taken up by the tissue macrophages (step 5), which would release TNF (step 6). Activated macrophages release multiple ligands after NK cells stimulate interferon gamma (IFN-γ) (step 7); these multiple chemokine ligands (eg, monocyte chemoattractant protein 1) further attract multiple immune cells (Th1/17 cells, monocytes, regulatory T cells, and B cells) in the bloodstream (step 8). In addition, IFN-γ produced by local NK and gamma delta (γδ) T cells further activates resident tissue histiocytes and dendritic cells (step 9). Activated antigen-loaded dendritic cells then migrate to peripheral lymph nodes via the lymphatic channels (step 10), and under the influence of IL-1 T cells, mature into Th1 cells. Activated Th1 then produces IL-2 that expands the T cell population (step 11) and joins other immune cells in the bloodstream (step 12). Then, these Th1 cells and other immune cells go to sites of inflammation and help in formation of a granuloma by maturation of macrophages (step 13). Over the course of days, the mature granuloma is formed, with other cells if the antigen persists. The inflammatory deposits in the lymph nodes (step 11) and the formation of the granuloma itself (step 13) are what translate into the lymphadenopathy, and pulmonary nodules demonstrate, in this example of granulomatous disease, sarcoidosis.
Figure 2.
Diagram shows the simplified version of sarcoid granuloma formation in steps. Antigens trigger the mast cell to release TNF (step 1), which then activates the neutrophils in the bloodstream (step 2). These activated neutrophils activate the monocytes (step 3). In a separate pathway, antigens activate natural killer (NK) cells (step 4), and these antigens are also taken up by the tissue macrophages (step 5), which would release TNF (step 6). Activated macrophages release multiple ligands after NK cells stimulate interferon gamma (IFN-γ) (step 7); these multiple chemokine ligands (eg, monocyte chemoattractant protein 1) further attract multiple immune cells (Th1/17 cells, monocytes, regulatory T cells, and B cells) in the bloodstream (step 8). In addition, IFN-γ produced by local NK and gamma delta (γδ) T cells further activates resident tissue histiocytes and dendritic cells (step 9). Activated antigen-loaded dendritic cells then migrate to peripheral lymph nodes via the lymphatic channels (step 10), and under the influence of IL-1 T cells, mature into Th1 cells. Activated Th1 then produces IL-2 that expands the T cell population (step 11) and joins other immune cells in the bloodstream (step 12). Then, these Th1 cells and other immune cells go to sites of inflammation and help in formation of a granuloma by maturation of macrophages (step 13). Over the course of days, the mature granuloma is formed, with other cells if the antigen persists. The inflammatory deposits in the lymph nodes (step 11) and the formation of the granuloma itself (step 13) are what translate into the lymphadenopathy, and pulmonary nodules demonstrate, in this example of granulomatous disease, sarcoidosis.
Manifestations of EGPA on axial CT images in four patients include discrete peripheral subpleural consolidation (a), micronodules (b), ground-glass opacity (c), and interlobular septal line thickening intermixed with ground-glass opacity and bronchiectasis (d).
Figure 3a.
Manifestations of EGPA on axial CT images in four patients include discrete peripheral subpleural consolidation (a), micronodules (b), ground-glass opacity (c), and interlobular septal line thickening intermixed with ground-glass opacity and bronchiectasis (d).
Figure 3b.
Manifestations of EGPA on axial CT images in four patients include discrete peripheral subpleural consolidation (a), micronodules (b), ground-glass opacity (c), and interlobular septal line thickening intermixed with ground-glass opacity and bronchiectasis (d).
Figure 3c.
Manifestations of EGPA on axial CT images in four patients include discrete peripheral subpleural consolidation (a), micronodules (b), ground-glass opacity (c), and interlobular septal line thickening intermixed with ground-glass opacity and bronchiectasis (d).
Figure 3d.
Manifestations of EGPA on axial CT images in four patients include discrete peripheral subpleural consolidation (a), micronodules (b), ground-glass opacity (c), and interlobular septal line thickening intermixed with ground-glass opacity and bronchiectasis (d).
EGPA in a 40-year-old woman. (a) Axial CT image of the chest shows peripheral consolidations in the right lower lobe (arrows), which were the patient’s pulmonary manifestation of EGPA.(b) Maxillofacial CT image shows pansinusitis that includes the left sphenoid sinus (orange arrow) and bilateral ethmoid sinuses (yellow arrows). (c) Axial CT image at 4-year follow-up shows consolidation with cavitation (arrow). Given the new development of cavitation, short-term-interval follow-up or biopsy was recommended, because EGPA consolidations rarely have cavitations. The patient was lost to follow-up and later presented with pelvic pain. CT showed diffuse lytic osseous lesions including a pathologic fracture of the left iliac bone, which was secondary to metastatic non–small cell lung cancer at biopsy.
Figure 4a.
EGPA in a 40-year-old woman. (a) Axial CT image of the chest shows peripheral consolidations in the right lower lobe (arrows), which were the patient’s pulmonary manifestation of EGPA.(b) Maxillofacial CT image shows pansinusitis that includes the left sphenoid sinus (orange arrow) and bilateral ethmoid sinuses (yellow arrows). (c) Axial CT image at 4-year follow-up shows consolidation with cavitation (arrow). Given the new development of cavitation, short-term-interval follow-up or biopsy was recommended, because EGPA consolidations rarely have cavitations. The patient was lost to follow-up and later presented with pelvic pain. CT showed diffuse lytic osseous lesions including a pathologic fracture of the left iliac bone, which was secondary to metastatic non–small cell lung cancer at biopsy.
Figure 4b.
EGPA in a 40-year-old woman. (a) Axial CT image of the chest shows peripheral consolidations in the right lower lobe (arrows), which were the patient’s pulmonary manifestation of EGPA.(b) Maxillofacial CT image shows pansinusitis that includes the left sphenoid sinus (orange arrow) and bilateral ethmoid sinuses (yellow arrows). (c) Axial CT image at 4-year follow-up shows consolidation with cavitation (arrow). Given the new development of cavitation, short-term-interval follow-up or biopsy was recommended, because EGPA consolidations rarely have cavitations. The patient was lost to follow-up and later presented with pelvic pain. CT showed diffuse lytic osseous lesions including a pathologic fracture of the left iliac bone, which was secondary to metastatic non–small cell lung cancer at biopsy.
Figure 4c.
EGPA in a 40-year-old woman. (a) Axial CT image of the chest shows peripheral consolidations in the right lower lobe (arrows), which were the patient’s pulmonary manifestation of EGPA.(b) Maxillofacial CT image shows pansinusitis that includes the left sphenoid sinus (orange arrow) and bilateral ethmoid sinuses (yellow arrows). (c) Axial CT image at 4-year follow-up shows consolidation with cavitation (arrow). Given the new development of cavitation, short-term-interval follow-up or biopsy was recommended, because EGPA consolidations rarely have cavitations. The patient was lost to follow-up and later presented with pelvic pain. CT showed diffuse lytic osseous lesions including a pathologic fracture of the left iliac bone, which was secondary to metastatic non–small cell lung cancer at biopsy.
GPA in a 27-year-old woman. (a) Axial chest CT image shows a cavitary pulmonary nodule (arrow) in the lingula. (b) Axial maxillofacial CT image shows diffuse sinus thickening involving the bilateral maxillary sinuses (arrows) with septal perforation (★).
Figure 5a.
GPA in a 27-year-old woman. (a) Axial chest CT image shows a cavitary pulmonary nodule (arrow) in the lingula. (b) Axial maxillofacial CT image shows diffuse sinus thickening involving the bilateral maxillary sinuses (arrows) with septal perforation (★).
Figure 5b.
GPA in a 27-year-old woman. (a) Axial chest CT image shows a cavitary pulmonary nodule (arrow) in the lingula. (b) Axial maxillofacial CT image shows diffuse sinus thickening involving the bilateral maxillary sinuses (arrows) with septal perforation (★).
Necrobiotic nodules in a 55-year-old woman with rheumatoid arthritis and a history of smoking. (a, b) Coronal CT images show multiple cavitary nodules (red arrows) that ruptured into the right pleural space (yellow arrows in b) and then into the skin, forming a pleurocutaneous fistula (blue arrow in a). (c) Axial maximum intensity projection reconstruction CT image shows one of the peripheral cavitary necrobiotic nodules (green arrow).
Figure 6a.
Necrobiotic nodules in a 55-year-old woman with rheumatoid arthritis and a history of smoking. (a, b) Coronal CT images show multiple cavitary nodules (red arrows) that ruptured into the right pleural space (yellow arrows in b) and then into the skin, forming a pleurocutaneous fistula (blue arrow in a). (c) Axial maximum intensity projection reconstruction CT image shows one of the peripheral cavitary necrobiotic nodules (green arrow).
Figure 6b.
Necrobiotic nodules in a 55-year-old woman with rheumatoid arthritis and a history of smoking. (a, b) Coronal CT images show multiple cavitary nodules (red arrows) that ruptured into the right pleural space (yellow arrows in b) and then into the skin, forming a pleurocutaneous fistula (blue arrow in a). (c) Axial maximum intensity projection reconstruction CT image shows one of the peripheral cavitary necrobiotic nodules (green arrow).
Figure 6c.
Necrobiotic nodules in a 55-year-old woman with rheumatoid arthritis and a history of smoking. (a, b) Coronal CT images show multiple cavitary nodules (red arrows) that ruptured into the right pleural space (yellow arrows in b) and then into the skin, forming a pleurocutaneous fistula (blue arrow in a). (c) Axial maximum intensity projection reconstruction CT image shows one of the peripheral cavitary necrobiotic nodules (green arrow).
Lymphomatoid granulomatosis in a 54-year-old man who presented with shortness of breath and skin nodules. (a) Frontal chest radiograph shows multiple pulmonary nodules of varying sizes (yellow boxes). (b, c) Axial CT image (b) and coronal maximum intensity projection CT image (c) show these nodules (yellow boxes in b and c) as solid and distributed throughout the lung. (d) Captured rotating maximum intensity projection 18F fluorodeoxyglucose PET/CT image shows diffuse hypermetabolic activity of these pulmonary nodules. Multiple hypermetabolic cutaneous nodules are also seen (purple boxes). Skin biopsy results confirmed the diagnosis of lymphomatoid granulomatosis.
Figure 7a.
Lymphomatoid granulomatosis in a 54-year-old man who presented with shortness of breath and skin nodules. (a) Frontal chest radiograph shows multiple pulmonary nodules of varying sizes (yellow boxes). (b, c) Axial CT image (b) and coronal maximum intensity projection CT image (c) show these nodules (yellow boxes in b and c) as solid and distributed throughout the lung. (d) Captured rotating maximum intensity projection 18F fluorodeoxyglucose PET/CT image shows diffuse hypermetabolic activity of these pulmonary nodules. Multiple hypermetabolic cutaneous nodules are also seen (purple boxes). Skin biopsy results confirmed the diagnosis of lymphomatoid granulomatosis.
Figure 7b.
Lymphomatoid granulomatosis in a 54-year-old man who presented with shortness of breath and skin nodules. (a) Frontal chest radiograph shows multiple pulmonary nodules of varying sizes (yellow boxes). (b, c) Axial CT image (b) and coronal maximum intensity projection CT image (c) show these nodules (yellow boxes in b and c) as solid and distributed throughout the lung. (d) Captured rotating maximum intensity projection 18F fluorodeoxyglucose PET/CT image shows diffuse hypermetabolic activity of these pulmonary nodules. Multiple hypermetabolic cutaneous nodules are also seen (purple boxes). Skin biopsy results confirmed the diagnosis of lymphomatoid granulomatosis.
Figure 7c.
Lymphomatoid granulomatosis in a 54-year-old man who presented with shortness of breath and skin nodules. (a) Frontal chest radiograph shows multiple pulmonary nodules of varying sizes (yellow boxes). (b, c) Axial CT image (b) and coronal maximum intensity projection CT image (c) show these nodules (yellow boxes in b and c) as solid and distributed throughout the lung. (d) Captured rotating maximum intensity projection 18F fluorodeoxyglucose PET/CT image shows diffuse hypermetabolic activity of these pulmonary nodules. Multiple hypermetabolic cutaneous nodules are also seen (purple boxes). Skin biopsy results confirmed the diagnosis of lymphomatoid granulomatosis.
Figure 7d.
Lymphomatoid granulomatosis in a 54-year-old man who presented with shortness of breath and skin nodules. (a) Frontal chest radiograph shows multiple pulmonary nodules of varying sizes (yellow boxes). (b, c) Axial CT image (b) and coronal maximum intensity projection CT image (c) show these nodules (yellow boxes in b and c) as solid and distributed throughout the lung. (d) Captured rotating maximum intensity projection 18F fluorodeoxyglucose PET/CT image shows diffuse hypermetabolic activity of these pulmonary nodules. Multiple hypermetabolic cutaneous nodules are also seen (purple boxes). Skin biopsy results confirmed the diagnosis of lymphomatoid granulomatosis.
Necrotizing sarcoidosis in a 56-year-old woman. Axial chest CT image shows multiple masslike solid pulmonary nodules with surrounding ground-glass halos (arrows). Percutaneous biopsy of one of the pulmonary nodules showed necrotizing sarcoidosis. These large nodules may cavitate, although cavitation is not present in this case.
Figure 8.
Necrotizing sarcoidosis in a 56-year-old woman. Axial chest CT image shows multiple masslike solid pulmonary nodules with surrounding ground-glass halos (arrows). Percutaneous biopsy of one of the pulmonary nodules showed necrotizing sarcoidosis. These large nodules may cavitate, although cavitation is not present in this case.
Bronchocentric granulomatosis in three patients. (a) Axial CT image in a 35-year-old man shows a spiculated nodule (arrow) in the left lower lobe. (b) Axial CT image in a 44-year-old woman shows peribronchovascular consolidation (white box) with tiny satellite nodules (arrow). (c) Axial CT image in a 51-year-old woman shows right lower lobe consolidation (dashed box) with peripheral bronchiectasis (purple arrow) and cystic bronchiectasis (blue arrow) with mucus plugging in the left lower lobe.
Figure 9a.
Bronchocentric granulomatosis in three patients. (a) Axial CT image in a 35-year-old man shows a spiculated nodule (arrow) in the left lower lobe. (b) Axial CT image in a 44-year-old woman shows peribronchovascular consolidation (white box) with tiny satellite nodules (arrow). (c) Axial CT image in a 51-year-old woman shows right lower lobe consolidation (dashed box) with peripheral bronchiectasis (purple arrow) and cystic bronchiectasis (blue arrow) with mucus plugging in the left lower lobe.
Figure 9b.
Bronchocentric granulomatosis in three patients. (a) Axial CT image in a 35-year-old man shows a spiculated nodule (arrow) in the left lower lobe. (b) Axial CT image in a 44-year-old woman shows peribronchovascular consolidation (white box) with tiny satellite nodules (arrow). (c) Axial CT image in a 51-year-old woman shows right lower lobe consolidation (dashed box) with peripheral bronchiectasis (purple arrow) and cystic bronchiectasis (blue arrow) with mucus plugging in the left lower lobe.
Figure 9c.
Bronchocentric granulomatosis in three patients. (a) Axial CT image in a 35-year-old man shows a spiculated nodule (arrow) in the left lower lobe. (b) Axial CT image in a 44-year-old woman shows peribronchovascular consolidation (white box) with tiny satellite nodules (arrow). (c) Axial CT image in a 51-year-old woman shows right lower lobe consolidation (dashed box) with peripheral bronchiectasis (purple arrow) and cystic bronchiectasis (blue arrow) with mucus plugging in the left lower lobe.
Pulmonary hyalinizing granulomas in a 56-year-old man. Axial CT image shows multiple large well-circumscribed nodules and masses of different sizes with coarse irregular calcifications.
Figure 10.
Pulmonary hyalinizing granulomas in a 56-year-old man. Axial CT image shows multiple large well-circumscribed nodules and masses of different sizes with coarse irregular calcifications.
Sarcoidosis in two patients. (a, b) Axial CT image (lung window) in a 49-year-old woman (a) shows many bilateral perilymphatic pulmonary nodules (red arrows), although no mediastinal lymphadenopathy was noted. (b) Coronal 18F fluorodeoxyglucose PET CT image in the same patient shows numerous hypermetabolic mediastinal and hilar lymph nodes (green arrows) that are in keeping with sarcoidosis. (c) Axial CT image (lung window) in a 51-year-old man shows multiple upper lobe–predominant central perilymphatic nodules (red boxes) and a few peripheral subpleural nodules (arrows).
Figure 11a.
Sarcoidosis in two patients. (a, b) Axial CT image (lung window) in a 49-year-old woman (a) shows many bilateral perilymphatic pulmonary nodules (red arrows), although no mediastinal lymphadenopathy was noted. (b) Coronal 18F fluorodeoxyglucose PET CT image in the same patient shows numerous hypermetabolic mediastinal and hilar lymph nodes (green arrows) that are in keeping with sarcoidosis. (c) Axial CT image (lung window) in a 51-year-old man shows multiple upper lobe–predominant central perilymphatic nodules (red boxes) and a few peripheral subpleural nodules (arrows).
Figure 11b.
Sarcoidosis in two patients. (a, b) Axial CT image (lung window) in a 49-year-old woman (a) shows many bilateral perilymphatic pulmonary nodules (red arrows), although no mediastinal lymphadenopathy was noted. (b) Coronal 18F fluorodeoxyglucose PET CT image in the same patient shows numerous hypermetabolic mediastinal and hilar lymph nodes (green arrows) that are in keeping with sarcoidosis. (c) Axial CT image (lung window) in a 51-year-old man shows multiple upper lobe–predominant central perilymphatic nodules (red boxes) and a few peripheral subpleural nodules (arrows).
Figure 11c.
Sarcoidosis in two patients. (a, b) Axial CT image (lung window) in a 49-year-old woman (a) shows many bilateral perilymphatic pulmonary nodules (red arrows), although no mediastinal lymphadenopathy was noted. (b) Coronal 18F fluorodeoxyglucose PET CT image in the same patient shows numerous hypermetabolic mediastinal and hilar lymph nodes (green arrows) that are in keeping with sarcoidosis. (c) Axial CT image (lung window) in a 51-year-old man shows multiple upper lobe–predominant central perilymphatic nodules (red boxes) and a few peripheral subpleural nodules (arrows).
Talcosis in two patients. (a) Axial CT image in a 27-year-old man with inhalational talcosis shows many diffuse centrilobular ground-glass nodules with nodular opacity and internal high attenuation. (b) Axial CT image in a 31-year-old man with intravenous talcosis shows innumerable tree-in-bud nodules with an enlarged main pulmonary artery from resultant pulmonary hypertension. This tree-in-bud distribution is in part due to intravenous particles obstructing terminal pulmonary arteries.
Figure 12a.
Talcosis in two patients. (a) Axial CT image in a 27-year-old man with inhalational talcosis shows many diffuse centrilobular ground-glass nodules with nodular opacity and internal high attenuation. (b) Axial CT image in a 31-year-old man with intravenous talcosis shows innumerable tree-in-bud nodules with an enlarged main pulmonary artery from resultant pulmonary hypertension. This tree-in-bud distribution is in part due to intravenous particles obstructing terminal pulmonary arteries.
Figure 12b.
Talcosis in two patients. (a) Axial CT image in a 27-year-old man with inhalational talcosis shows many diffuse centrilobular ground-glass nodules with nodular opacity and internal high attenuation. (b) Axial CT image in a 31-year-old man with intravenous talcosis shows innumerable tree-in-bud nodules with an enlarged main pulmonary artery from resultant pulmonary hypertension. This tree-in-bud distribution is in part due to intravenous particles obstructing terminal pulmonary arteries.
PLCH in a 30-year-old male smoker. Axial CT images show bizarrely shaped cysts (yellow box in a) predominantly in the upper lobe and multiple centrilobular nodules (red box in a). The lung bases are relatively spared (b).
Figure 13a.
PLCH in a 30-year-old male smoker. Axial CT images show bizarrely shaped cysts (yellow box in a) predominantly in the upper lobe and multiple centrilobular nodules (red box in a). The lung bases are relatively spared (b).
Figure 13b.
PLCH in a 30-year-old male smoker. Axial CT images show bizarrely shaped cysts (yellow box in a) predominantly in the upper lobe and multiple centrilobular nodules (red box in a). The lung bases are relatively spared (b).
GL-ILD in a 50-year-old woman with common variable immunodeficiency. (a) Axial CT image at initial presentation shows diffuse mosaic attenuation. (b) Axial CT image at follow-up a few months later shows improving mosaic attenuation with new micronodules (yellow oval). Follow-up CT after treatment with systemic steroids (not shown) showed improvement of both the diffuse mosaic attenuation and micronodules.
Figure 14a.
GL-ILD in a 50-year-old woman with common variable immunodeficiency. (a) Axial CT image at initial presentation shows diffuse mosaic attenuation. (b) Axial CT image at follow-up a few months later shows improving mosaic attenuation with new micronodules (yellow oval). Follow-up CT after treatment with systemic steroids (not shown) showed improvement of both the diffuse mosaic attenuation and micronodules.
Figure 14b.
GL-ILD in a 50-year-old woman with common variable immunodeficiency. (a) Axial CT image at initial presentation shows diffuse mosaic attenuation. (b) Axial CT image at follow-up a few months later shows improving mosaic attenuation with new micronodules (yellow oval). Follow-up CT after treatment with systemic steroids (not shown) showed improvement of both the diffuse mosaic attenuation and micronodules.
Sequelae of chronic aspiration in a 75-year-old man who underwent esophagectomy and gastric pull-through 9 years previously for treatment of esophageal cancer. Axial CT image shows lower lung–predominant ground-glass opacity and reticulation in the right middle and lower lobes (yellow box) and mild bronchiectasis (red box). A dilated gastric conduit is also present (arrow). These findings were stable from a prior examination and were most consistent with sequelae of chronic aspiration.
Figure 15.
Sequelae of chronic aspiration in a 75-year-old man who underwent esophagectomy and gastric pull-through 9 years previously for treatment of esophageal cancer. Axial CT image shows lower lung–predominant ground-glass opacity and reticulation in the right middle and lower lobes (yellow box) and mild bronchiectasis (red box). A dilated gastric conduit is also present (arrow). These findings were stable from a prior examination and were most consistent with sequelae of chronic aspiration.
Variable CT imaging appearance of hypersensitivity pneumonitis in three patients. (a) Axial CT image in a 35-year-old man shows multiple centrilobular nodules. (b) Axial CT image in a 56-year-old woman shows mixed ground-glass opacity and mosaic attenuation interspersed with normal lung parenchyma (head cheese sign). (c, d) Axial CT images in a 46-year-old woman with a long history of using a hot tub shows areas of ground-glass attenuation predominantly in the left upper lobe (white oval in c). Evidence of air trapping appears on the expiratory image (d).
Figure 16a.
Variable CT imaging appearance of hypersensitivity pneumonitis in three patients. (a) Axial CT image in a 35-year-old man shows multiple centrilobular nodules. (b) Axial CT image in a 56-year-old woman shows mixed ground-glass opacity and mosaic attenuation interspersed with normal lung parenchyma (head cheese sign). (c, d) Axial CT images in a 46-year-old woman with a long history of using a hot tub shows areas of ground-glass attenuation predominantly in the left upper lobe (white oval in c). Evidence of air trapping appears on the expiratory image (d).
Figure 16b.
Variable CT imaging appearance of hypersensitivity pneumonitis in three patients. (a) Axial CT image in a 35-year-old man shows multiple centrilobular nodules. (b) Axial CT image in a 56-year-old woman shows mixed ground-glass opacity and mosaic attenuation interspersed with normal lung parenchyma (head cheese sign). (c, d) Axial CT images in a 46-year-old woman with a long history of using a hot tub shows areas of ground-glass attenuation predominantly in the left upper lobe (white oval in c). Evidence of air trapping appears on the expiratory image (d).
Figure 16c.
Variable CT imaging appearance of hypersensitivity pneumonitis in three patients. (a) Axial CT image in a 35-year-old man shows multiple centrilobular nodules. (b) Axial CT image in a 56-year-old woman shows mixed ground-glass opacity and mosaic attenuation interspersed with normal lung parenchyma (head cheese sign). (c, d) Axial CT images in a 46-year-old woman with a long history of using a hot tub shows areas of ground-glass attenuation predominantly in the left upper lobe (white oval in c). Evidence of air trapping appears on the expiratory image (d).
Figure 16d.
Variable CT imaging appearance of hypersensitivity pneumonitis in three patients. (a) Axial CT image in a 35-year-old man shows multiple centrilobular nodules. (b) Axial CT image in a 56-year-old woman shows mixed ground-glass opacity and mosaic attenuation interspersed with normal lung parenchyma (head cheese sign). (c, d) Axial CT images in a 46-year-old woman with a long history of using a hot tub shows areas of ground-glass attenuation predominantly in the left upper lobe (white oval in c). Evidence of air trapping appears on the expiratory image (d).
Progressive massive fibrosis in a 61-year-old man. Frontal chest radiograph (a) shows large bilateral upper lobe–predominant masses with irregular margins (arrows) and upper lobe volume loss, indicated by a juxtaphrenic peak (arrowhead). (b) Axial CT image shows bilateral large calcified conglomerate masses with adjacent fibrosis and calcified mediastinal lymph nodes.
Figure 17a.
Progressive massive fibrosis in a 61-year-old man. Frontal chest radiograph (a) shows large bilateral upper lobe–predominant masses with irregular margins (arrows) and upper lobe volume loss, indicated by a juxtaphrenic peak (arrowhead). (b) Axial CT image shows bilateral large calcified conglomerate masses with adjacent fibrosis and calcified mediastinal lymph nodes.
Figure 17b.
Progressive massive fibrosis in a 61-year-old man. Frontal chest radiograph (a) shows large bilateral upper lobe–predominant masses with irregular margins (arrows) and upper lobe volume loss, indicated by a juxtaphrenic peak (arrowhead). (b) Axial CT image shows bilateral large calcified conglomerate masses with adjacent fibrosis and calcified mediastinal lymph nodes.
Erdheim-Chester disease in a 55-year-old man. (a) Axial CT image shows interlobular and intralobular smooth septal line thickening (arrows) with bilateral pleural effusions (★). (b) Sagittal reconstruction CT image (soft-tissue window) shows a rind of soft tissue encasing the heart (purple arrow) and aorta (yellow arrow). (c) Axial CT image (bone window) also shows sclerotic lesions, which are hallmark findings of this disease (blue arrows).
Figure 18a.
Erdheim-Chester disease in a 55-year-old man. (a) Axial CT image shows interlobular and intralobular smooth septal line thickening (arrows) with bilateral pleural effusions (★). (b) Sagittal reconstruction CT image (soft-tissue window) shows a rind of soft tissue encasing the heart (purple arrow) and aorta (yellow arrow). (c) Axial CT image (bone window) also shows sclerotic lesions, which are hallmark findings of this disease (blue arrows).
Figure 18b.
Erdheim-Chester disease in a 55-year-old man. (a) Axial CT image shows interlobular and intralobular smooth septal line thickening (arrows) with bilateral pleural effusions (★). (b) Sagittal reconstruction CT image (soft-tissue window) shows a rind of soft tissue encasing the heart (purple arrow) and aorta (yellow arrow). (c) Axial CT image (bone window) also shows sclerotic lesions, which are hallmark findings of this disease (blue arrows).
Figure 18c.
Erdheim-Chester disease in a 55-year-old man. (a) Axial CT image shows interlobular and intralobular smooth septal line thickening (arrows) with bilateral pleural effusions (★). (b) Sagittal reconstruction CT image (soft-tissue window) shows a rind of soft tissue encasing the heart (purple arrow) and aorta (yellow arrow). (c) Axial CT image (bone window) also shows sclerotic lesions, which are hallmark findings of this disease (blue arrows).
Biopsy-proven extranodal Rosai-Dorfman disease in a 65-year-old woman. (a–c) Axial CT images (lung window) show a patchy consolidation in the right upper lobe (arrow in a) with septal line thickening (arrow in b). Also note the tiny thin-walled cysts in the left lung (arrow in c). (d) Axial CT image (mediastinal windows) shows the axillary and mediastinal adenopathy (green arrows) and a soft-tissue chest wall mass (pink arrow). The most common finding in Rosai-Dorfman disease is lymphadenopathy. Most of these findings resolved with treatment (not shown).
Figure 19a.
Biopsy-proven extranodal Rosai-Dorfman disease in a 65-year-old woman. (a–c) Axial CT images (lung window) show a patchy consolidation in the right upper lobe (arrow in a) with septal line thickening (arrow in b). Also note the tiny thin-walled cysts in the left lung (arrow in c). (d) Axial CT image (mediastinal windows) shows the axillary and mediastinal adenopathy (green arrows) and a soft-tissue chest wall mass (pink arrow). The most common finding in Rosai-Dorfman disease is lymphadenopathy. Most of these findings resolved with treatment (not shown).
Figure 19b.
Biopsy-proven extranodal Rosai-Dorfman disease in a 65-year-old woman. (a–c) Axial CT images (lung window) show a patchy consolidation in the right upper lobe (arrow in a) with septal line thickening (arrow in b). Also note the tiny thin-walled cysts in the left lung (arrow in c). (d) Axial CT image (mediastinal windows) shows the axillary and mediastinal adenopathy (green arrows) and a soft-tissue chest wall mass (pink arrow). The most common finding in Rosai-Dorfman disease is lymphadenopathy. Most of these findings resolved with treatment (not shown).
Figure 19c.
Biopsy-proven extranodal Rosai-Dorfman disease in a 65-year-old woman. (a–c) Axial CT images (lung window) show a patchy consolidation in the right upper lobe (arrow in a) with septal line thickening (arrow in b). Also note the tiny thin-walled cysts in the left lung (arrow in c). (d) Axial CT image (mediastinal windows) shows the axillary and mediastinal adenopathy (green arrows) and a soft-tissue chest wall mass (pink arrow). The most common finding in Rosai-Dorfman disease is lymphadenopathy. Most of these findings resolved with treatment (not shown).
Figure 19d.
Biopsy-proven extranodal Rosai-Dorfman disease in a 65-year-old woman. (a–c) Axial CT images (lung window) show a patchy consolidation in the right upper lobe (arrow in a) with septal line thickening (arrow in b). Also note the tiny thin-walled cysts in the left lung (arrow in c). (d) Axial CT image (mediastinal windows) shows the axillary and mediastinal adenopathy (green arrows) and a soft-tissue chest wall mass (pink arrow). The most common finding in Rosai-Dorfman disease is lymphadenopathy. Most of these findings resolved with treatment (not shown).

References

    1. Ohshimo S, Guzman J, Costabel U, Bonella F. Differential diagnosis of granulomatous lung disease: clues and pitfalls: Number 4 in the series “Pathology for the clinician”edited by Peter Dorfmüller and Alberto Cavazza. Eur Respir Rev 2017;26(145):170012. - PMC - PubMed
    1. Rivera A, Siracusa MC, Yap GS, Gause WC. Innate cell communication kick-starts pathogen-specific immunity. Nat Immunol 2016;17(4):356–363. - PMC - PubMed
    1. Chen L, Deng H, Cui H, et al. Inflammatory responses and inflammation-associated diseases in organs. Oncotarget 2017;9(6):7204–7218. - PMC - PubMed
    1. Guirado E, Schlesinger LS, Kaplan G. Macrophages in tuberculosis: friend or foe. Semin Immunopathol 2013;35(5):563–583. - PMC - PubMed
    1. Ekkens MJ, Shedlock DJ, Jung E, et al. Th1 and Th2 cells help CD8 T-cell responses. Infect Immun 2007;75(5): 2291–2296. - PMC - PubMed