Review
. 2020 Jun 4:22:309-341.
doi: 10.1146/annurev-bioeng-062117-121105.

Integrated Biophysical Modeling and Image Analysis: Application to Neuro-Oncology

Affiliations
Review

Integrated Biophysical Modeling and Image Analysis: Application to Neuro-Oncology

Andreas Mang et al. Annu Rev Biomed Eng. .

Abstract

Central nervous system (CNS) tumors come with vastly heterogeneous histologic, molecular, and radiographic landscapes, rendering their precise characterization challenging. The rapidly growing fields of biophysical modeling and radiomics have shown promise in better characterizing the molecular, spatial, and temporal heterogeneity of tumors. Integrative analysis of CNS tumors, including clinically acquired multi-parametric magnetic resonance imaging (mpMRI) and the inverse problem of calibrating biophysical models to mpMRI data, assists in identifying macroscopic quantifiable tumor patterns of invasion and proliferation, potentially leading to improved (a) detection/segmentation of tumor subregions and (b) computer-aided diagnostic/prognostic/predictive modeling. This article presents a summary of (a) biophysical growth modeling and simulation,(b) inverse problems for model calibration, (c) these models' integration with imaging workflows, and (d) their application to clinically relevant studies. We anticipate that such quantitative integrative analysis may even be beneficial in a future revision of the World Health Organization (WHO) classification for CNS tumors, ultimately improving patient survival prospects.

Keywords: biophysical modeling; glioblastoma; image analysis; model calibration; multi-parametric imaging; radiomics; tumor growth.


Figures

Figure 1
Figure 1
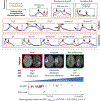
Radiomics in neuro-oncology. We seek to extract quantitative imaging indicators that predict clinical outcome. The main inputs to our framework are multi-parametric magnetic resonance imaging (mpMRI) data (top left) and (possibly) clinical features such as molecular profiling and/or histopathological data (bottom left). One possible way to identify clinical markers in imaging data is to apply feature extraction methods from image analysis (top center). These methods do not, in general, incorporate any prior knowledge about the underlying pathology. Computer simulations of biophysical models can establish such a powerful tool to integrate such information. To be clinically useful, biophysical models must be calibrated using the mpMRI information (medical images in our case; bottom left). Once calibrated, these models can be used to generate patient-specific simulations (bottom center). In a final step, these quantitative parameters are integrated with machine learning algorithms to generate tools that can assist clinical decision making (right block). Images modified from Reference 3 with permission from Springer Nature, Optimization and Engineering, copyright 2018 Springer, and from Reference 4 with permission from IEEE, IEEE Transactions on Medical Imaging, copyright 2012 IEEE.
Figure 2
Figure 2
Qualitative simulation results for different biophysical models. (a) Two single-species models, one without (left) and one with (right) mass effect. The three images on the right show results (axial slices through the brain) for different realizations of a mass effect model; we show different degrees of deformation of the healthy tissue due to tumor growth (98). (b) Simulation results for a multispecies model of tumor growth with mass effect (122). We show two time points (initial condition and final time) per tumor species (left to right: proliferating, infiltrating, and necrotic tumor cells). (c) This multispecies model allows us to account for imaging abnormalities seen in multi-parametric magnetic resonance imaging (mpMRI): (top row) patient-specific mpMRI data for a glioblastoma and (bottom row) synthetically generated mpMRI dataset using the model described in Reference 122. The model parameters were identified by manual trial and error; no inversion was performed. This figure has been modified from References 3, , and . Panel a (left) reprinted by permission from Springer Nature, Optimization and Engineering, copyright 2018 Springer. Panel a (right) reprinted by permission from the Society for Industrial and Applied Mathematics; copyright 2008, all rights reserved. Panels b and c reprinted by permission from Springer Nature, Journal of Mathematical Biology, copyright 2019 Springer.
Figure 3
Figure 3
(a) Illustration of the inverse problem of estimating patient-specific model parameters p. We seek parameters p such that the predicted state c(x, 1) (solution of the forward problem) matches some observed data cOBS. The input data to our problem are multi-parametric magnetic resonance imaging (mpMRI) data, shown at left. The image labeled “patient geometry” illustrates data we present to our solver. The image on the right shows the model output for the computed parameters. The simulations are performed in a tumor-free atlas image labeled “atlas geometry.” To compensate for anatomical differences in patient and atlas geometry, we additionally invert for a deformation map y. (b, c) Exemplary results for Glioma Image Segmentation and Registration (GLISTR) (4). We show segmentation results (b, coronal planes) and tumor probability maps (c, axial planes). (b) Each row corresponds to a different patient (bottom to top: patient 1 through patient 4). mpMRI (input data): The first three columns in panel b show the mpMRI data (input to our problem). The last three columns show the computed tumor labels ξ [enhancing tumor region (ET), light yellow; necrotic and nonenhancing tumor region (NE), dark yellow; edematous/tumor-infiltrated tissue (ED), purple; cerebrospinal fluid (CSF), red; gray matter (GM), gray; white matter (WM), white], the probability map for the tumor πTU, and the probability map of GM πG. (c) The average of the computed tumor posteriors over 122 glioma cases. The color map is the same as the one used for πTU. It can be seen that within the considered patient population, the region with the highest tumor probability is placed in the left temporal lobe of the brain. Other abbreviations: CE, contrast-enhanced; FLAIR, fluid-attenuated inversion recovery. Figure modified from References 3 and . Panel a reprinted by permission from Springer Nature, Optimization and Engineering, copyright 2018 Springer. Panels b and c reprinted by permission from IEEE, IEEE Transactions on Medical Imaging, copyright 2012 IEEE.
Figure 4
Figure 4
Example studies on predicting patient overall survival (OS). (Top) Distributions of features most predictive of OS across long-survivor (blue) and short-survivor (red) groups. The black arrows point to larger differences between the groups, per feature. The diffusion time obtained via biophysical models of tumor growth is one of the most distinctive features. Panel modified with permission from Reference 67. (Bottom) Distinction of radiographic subtypes in relation to patient OS. The shortest survival of the isocitrate dehydrogenase-1 mutant (IDH1-mut) occurred in the irregular subtype, which overall had lower OS, indicating that the radiographic subtype can potentially add predictive value within IDH1-mut patients. Panel modified with permission from Reference 70. Abbreviations: BS, brain size; CD, cell density; ED, edematous/tumor-infiltrated tissue; ET, enhancing tumor; non-ET, nonenhancing core of tumor; NV, neovascularization; PH, peak height of perfusion signal; TR, trace.
Figure 5
Figure 5
Spatial descriptive characteristics of EGFRvIII glioblastoma, following advanced computational analysis incorporating biophysical tumor growth modeling. Abbreviations: ADC, apparent diffusion coefficient; ET, enhancing tumor; rCBV, relative cerebral blood volume. Figure modified with permission from Reference 27.
Figure 6
Figure 6
Summary of computational radiographic analysis incorporating biophysical growth modeling (ae) (96) leading to the discovery of a potential molecular target, presenting an opportunity for potential therapeutic development (22, 25). The findings of the radiographic analysis were corroborated in mice implanted with tumors (f,h), the histological analysis of which (g) shows increased invasion. (i) The implanted tumor growth rate was shown to be much decreased after targeting via mAb806. Abbreviations: CSF, cerebrospinal fluid; CTE, complete tumor extent; ED, edematous/tumor-infiltrated tissue; EGFR, epidermal growth factor receptor; ET, enhancing tumor; GLISTR, Glioma Image Segmentation and Registration; GM, gray matter; MRI, magnetic resonance imaging; NE, necrotic and nonenhancing; PBS, phosphate-buffered saline; PH, peak height of perfusion signal; rCBV, relative cerebral blood volume; rCE, relative contrast enhancement; WM, white matter; WT, whole tumor. Figure modified with permission from Binder ZA, Thorne AH, Bakas S, Wileyto EP, Bilello M, et al. 2018. Epidermal growth factor receptor extracellular domain mutations in glioblastoma present opportunities for clinical imaging and therapeutic development. Cancer Cell 34:163–77.

References

    1. Collins VP. 1998. Gliomas. Cancer Surv. 32:37–51 - PubMed
    1. Holland EC. 2000. Glioblastoma multiforme: the terminator. PNAS 97:6242–44 - PMC - PubMed
    1. Mang A, Gholami A, Davatizkos C, Biros G. 2018. PDE-constrained optimization in medical image analysis. Optim. Eng 19(3):765–812
    1. Gooya A, Pohl KM, Bilello M, Cirillo L, Biros G, et al. 2013. GLISTR: glioma image segmentation and registration. IEEE Trans. Med. Imaging 31:1941–54 - PMC - PubMed
    1. Kleihues P, Burger PC, Scheithauer BW. 1993. The new WHO classification of brain tumours. Brain Pathol. 3:255–68 - PubMed

Publication types