. 2020 Jun 5;15(6):e0231169.
doi: 10.1371/journal.pone.0231169. eCollection 2020.

Quantile graphs for EEG-based diagnosis of Alzheimer's disease

Affiliations

Quantile graphs for EEG-based diagnosis of Alzheimer's disease

Aruane M Pineda et al. PLoS One. .

Abstract

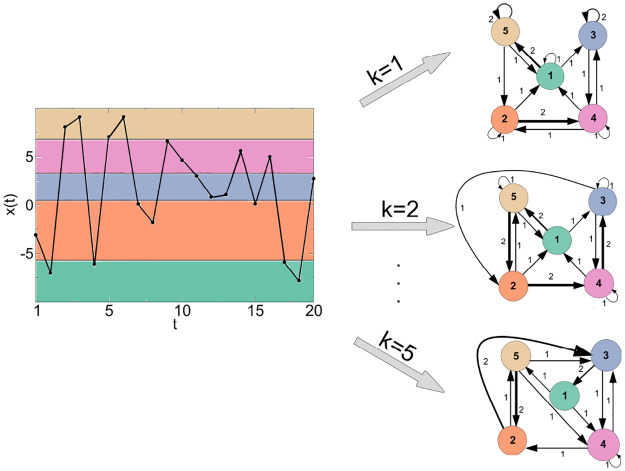
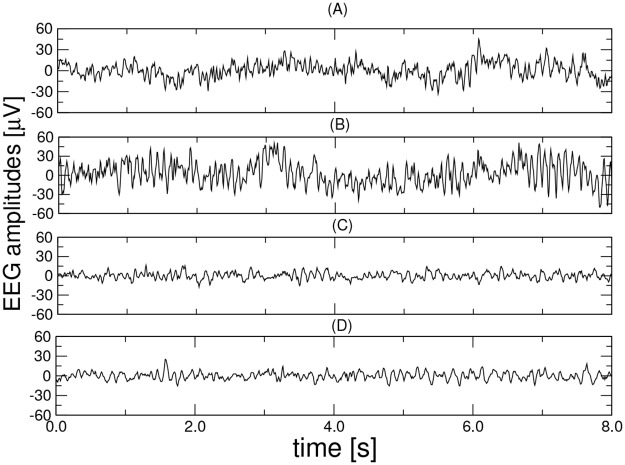
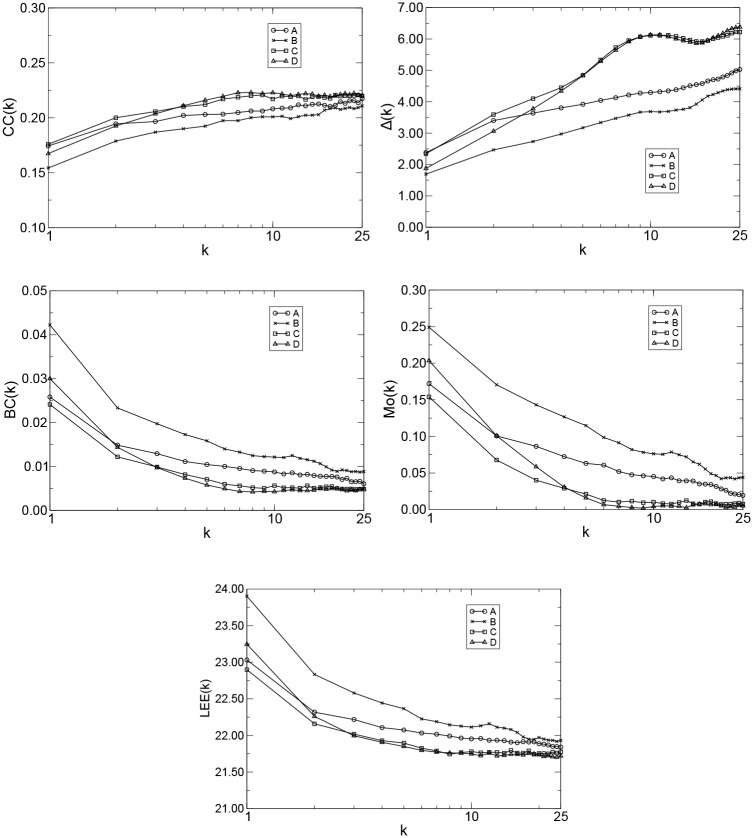
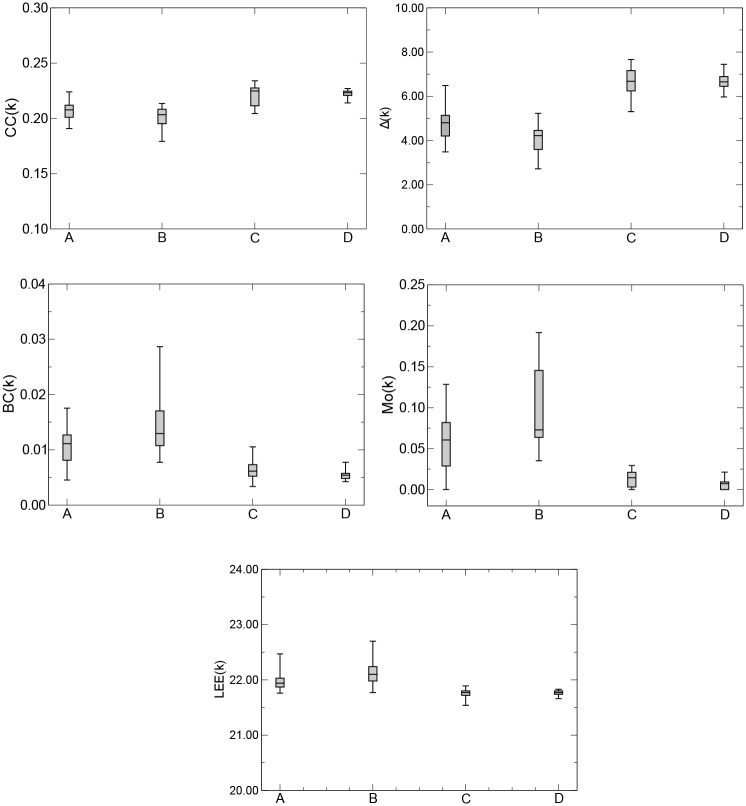
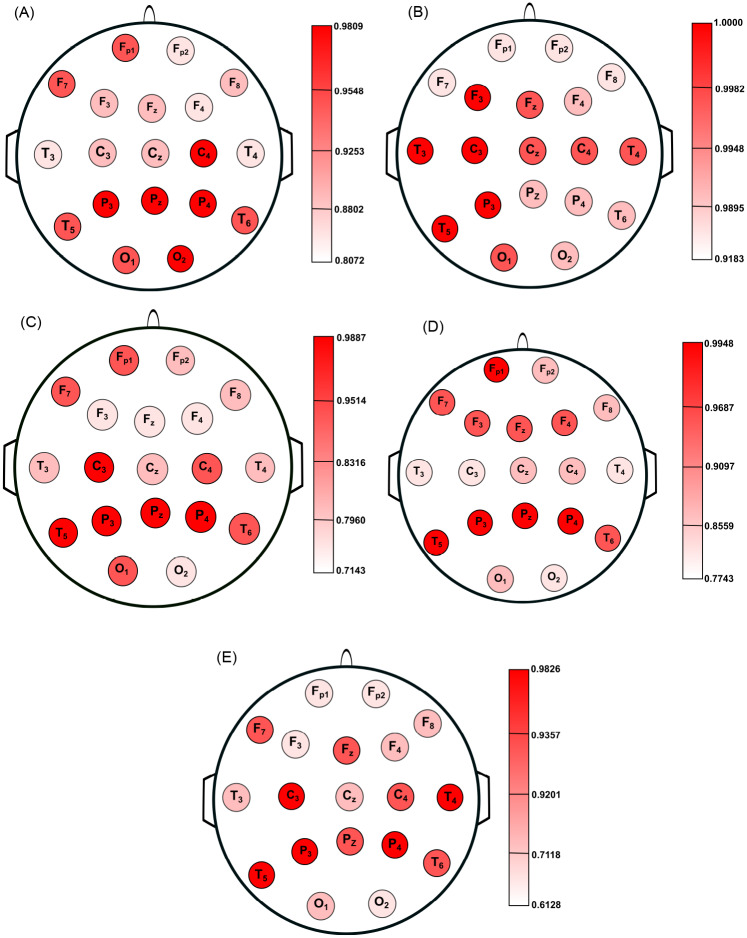
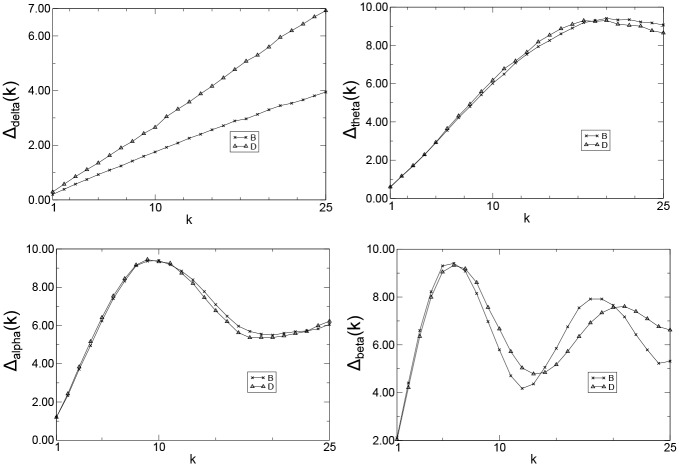
Known as a degenerative and progressive dementia, Alzheimer's disease (AD) affects about 25 million elderly people around the world. This illness results in a decrease in the productivity of people and places limits on their daily lives. Electroencephalography (EEG), in which the electrical brain activity is recorded in the form of time series and analyzed using signal processing techniques, is a well-known neurophysiological AD biomarker. EEG is noninvasive, low-cost, has a high temporal resolution, and provides valuable information about brain dynamics in AD. Here, we present an original approach based on the use of quantile graphs (QGs) for classifying EEG data. QGs map frequency, amplitude, and correlation characteristics of a time series (such as the EEG data of an AD patient) into the topological features of a network. The five topological network metrics used here-clustering coefficient, mean jump length, betweenness centrality, modularity, and Laplacian Estrada index-showed that the QG model can distinguish healthy subjects from AD patients, with open or closed eyes. The QG method also indicates which channels (corresponding to 19 different locations on the patients' scalp) provide the best discriminating power. Furthermore, the joint analysis of delta, theta, alpha, and beta wave results indicate that all AD patients under study display clear symptoms of the disease and may have it in its late stage, a diagnosis known a priori and supported by our study. Results presented here attest to the usefulness of the QG method in analyzing complex, nonlinear signals such as those generated from AD patients by EEGs.


Conflict of interest statement

The authors have declared that no competing interests exist.

Figures

Fig 1
Fig 1. Example of the QG method for a time series with T = 20, Q = 5, and k = 1, 2 and 5.
The quantile intervals for the sorted data are given by [x(0), x(4)[, [x(4), x(8)[, [x(8), x(12)[, [x(12), x(16)[, and [x(16), x(20)], i.e., [−7.783, −3.050[, [−3.050, 0.829[, [0.829, 4.657[, [4.657, 7.070[, and [7.070, 9.090]. The quantiles are mapped into three networks with N=5 nodes each and arc weights given by (1,1,1), (1,3,1), (1,5,2), (2,1,1), (2,2,1), (2,4,2), (3,3,2), (3,4,1), (4,1,1), (4,2,1), (4,3,1), (4,4,1), (5,1,1), (5,2,1), (5,5,2) for k = 1; (1,3,1), (1,5,2), (2,1,1), (2,4,2), (2,5,1), (3,2,1), (3,3,1), (3,4,1), (4,1,1), (4,3,2), (4,4,1), (5,1,1), (5,2,2), (5,5,1) for k = 2; and (1,4,1), (1,5,1), (2,3,2), (2,5,1), (3,1,2), (3,4,1), (4,2,1), (4,3,1), (4,4,1), (5,2,2), (5,3,1), (5,4,1) for k = 5.
Fig 2
Fig 2
Exemplary EEG segments (channel F7) from each of the four groups (A, B, C, and D). From top to bottom: health controls, eyes open (group A), health controls, eyes closed (group B), patient with AD, eyes open (group C) and patient with AD, eyes closed (group D).
Fig 3
Fig 3
CC(k), Δ(k), BC(k), Mo(k), and LEE(k) versus k, T = 1, 024, Q = 20, and k = 1, 2, …, 25 for the groups A (patients from health controls, eyes open), B (patients from health controls, eyes closed), C (patients with AD, eyes open), and D (patients with AD, eyes closed).
Fig 4
Fig 4
Boxplots of CC(k), Δ(k), BC(k),Mo(k), and LEE(k) for kmax = 9, kmax = 10, kmax = 6, kmax = 6, and kmax = 8, respectively, for the groups A, B, C, and D. Boxplots from patients with different health states show different means (placed at the center of each box), which are 0.2077, 0.2033, 0.2248, and 0.2232 for CC(k); 4.8010, 4.2190, 6.6790, and 6.6510 for Δ(k); 0.0111, 0.0129, 0.0061, and 0.0054 for BC(k); 0.0605, 0.0728, 0.0145, and 0.0072 for Mo(k); and 21.9400, 22.1000, 21.7700, and 21.7700 for LEE(k), respectively.
Fig 5
Fig 5
Location on scalp of the 19 EEG channels, represented by circles and colored according to the value of A^ROC for CC (A), Δ (B), BC (C), Mo (D), and LEE (E), respectively. Circles with darker colors indicate a better differentiation between aging and AD.
Fig 6
Fig 6
Δ(k) versus k (channel P3),T = 1, 024, Q = 20, and k = 1, 2, …, 25 for delta (Δdelta), theta (Δtheta), alpha (Δalpha), and beta (Δbeta) waves and patients for the groups B and D.

References

    1. Organization WH. Dementia:. Switzerland: World Health Organization; 2012.
    1. Budson A, Solomon P. Memory Loss, Alzheimer’s Disease, and Dementia. New York: Elsevier; 2015.
    1. Fjell AM, McEvoy L, Holland D, Dale AM, Walhovd KB, Initiative ADN, et al. What is normal in normal aging? Effects of aging, amyloid and Alzheimer’s disease on the cerebral cortex and the hippocampus. Progress in neurobiology. 2014;117:20–40. 10.1016/j.pneurobio.2014.02.004 - DOI - PMC - PubMed
    1. Hyman BT, Van Hoesen GW, Damasio AR, Barnes CL. Alzheimer’s disease: cell-specific pathology isolates the hippocampal formation. Science. 1984;225(4667):1168–1170. - PubMed
    1. Feldman HH, Woodward M. The staging and assessment of moderate to severe Alzheimer disease. Neurology. 2005;65 10.1212/WNL.65.6_suppl_3.S10 - DOI

Publication types