. 2020 Jun 5;15(6):e0233976.
doi: 10.1371/journal.pone.0233976. eCollection 2020.

Using machine learning models to predict the initiation of renal replacement therapy among chronic kidney disease patients

Affiliations

Using machine learning models to predict the initiation of renal replacement therapy among chronic kidney disease patients

Erik Dovgan et al. PLoS One. .

Abstract

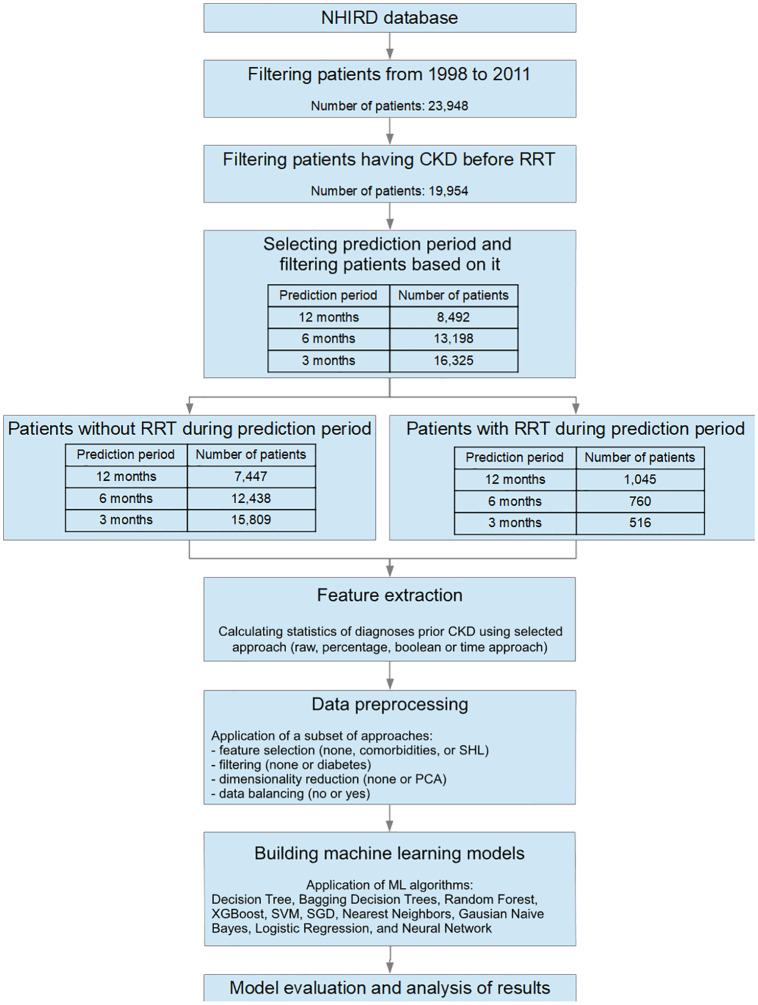
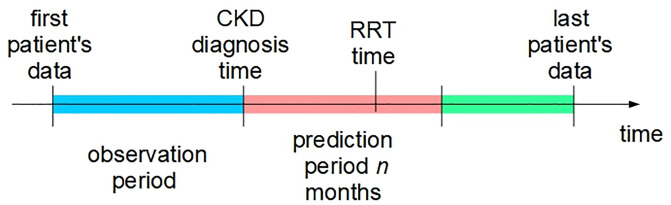
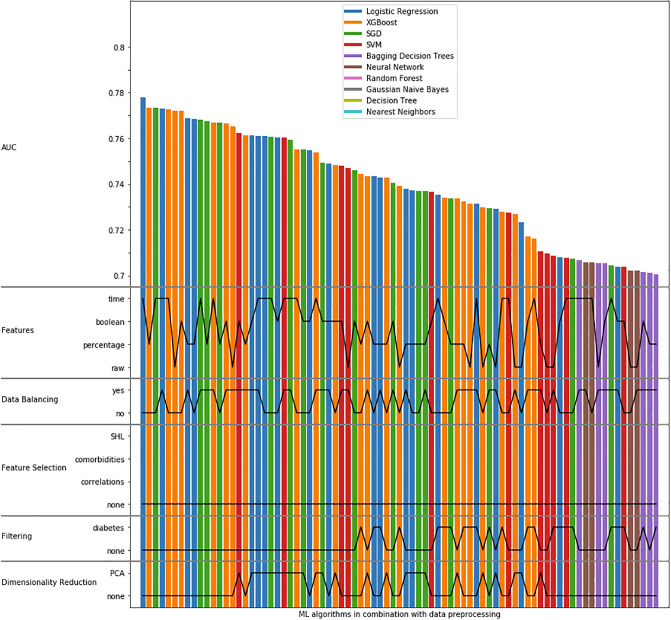
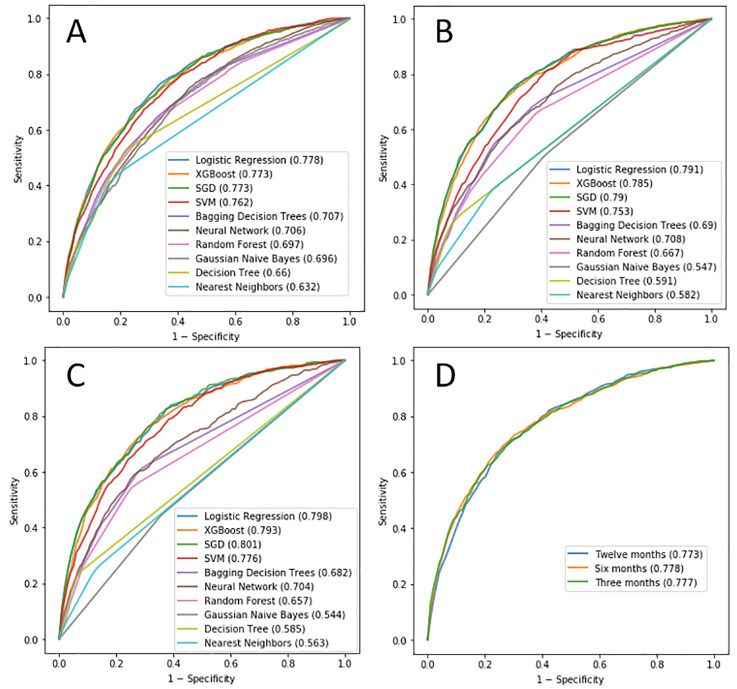
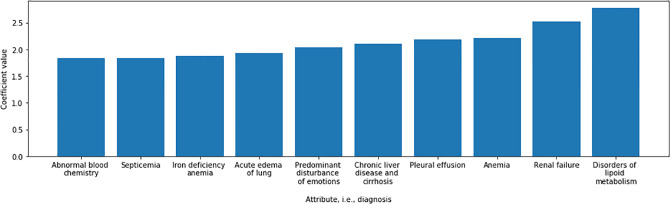
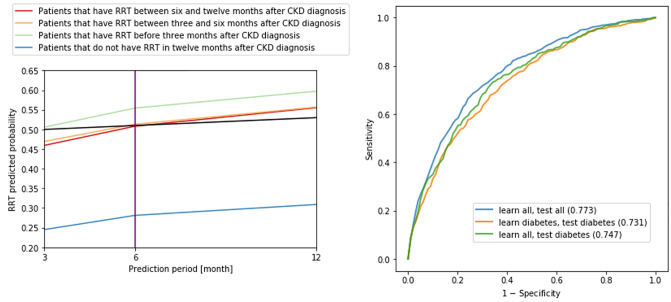
Starting renal replacement therapy (RRT) for patients with chronic kidney disease (CKD) at an optimal time, either with hemodialysis or kidney transplantation, is crucial for patient's well-being and for successful management of the condition. In this paper, we explore the possibilities of creating forecasting models to predict the onset of RRT 3, 6, and 12 months from the time of the patient's first diagnosis with CKD, using only the comorbidities data from National Health Insurance from Taiwan. The goal of this study was to see whether a limited amount of data (including comorbidities but not considering laboratory values which are expensive to obtain in low- and medium-income countries) can provide a good basis for such predictive models. On the other hand, in developed countries, such models could allow policy-makers better planning and allocation of resources for treatment. Using data from 8,492 patients, we obtained the area under the receiver operating characteristic curve (AUC) of 0.773 for predicting RRT within 12 months from the time of CKD diagnosis. The results also show that there is no additional advantage in focusing only on patients with diabetes in terms of prediction performance. Although these results are not as such suitable for adoption into clinical practice, the study provides a strong basis and a variety of approaches for future studies of forecasting models in healthcare.


Conflict of interest statement

The authors acknowledge the financial support from the Slovenian Research Agency (research core funding No. P2-0209). This work is part of the CrowdHEALTH project that has received funding from the European Union’s Horizon 2020 research and innovation program under grant agreement no. 727560 (JSI) and Ministry of Science and Technology under project no. 106-3805-018-110 (TMU). We gratefully acknowledge the support of NVIDIA Corporation with the donation of the Titan V GPU used for this research. This does not alter our adherence to PLOS ONE policies on sharing data and materials.

Figures

Fig 1
Fig 1. Data processing and model building procedure.
Fig 2
Fig 2. Relations between various time events used to define the RRT outcome.
Fig 3
Fig 3. AUCs obtained with the ML algorithms with data preprocessing details, where only AUCs > 0.7 are shown.
Fig 4
Fig 4
The best ROC curves of each ML model, obtained by testing various configurations in terms of feature extraction, data balancing, feature selection, filtering and dimensionality reduction, for A) 12 months, B) 6 months, C) 3 months. The AUC values are shown in brackets. D) AUCs obtained with Logistic Regression for various prediction periods.
Fig 5
Fig 5. Diagnoses with the highest importance, i.e., coefficients, when applying Logistic Regression for twelve-months-ahead prediction.
Fig 6
Fig 6
Left: Predicted probabilities of needing RRT, averaged at each prediction period. Blue, red, orange and green lines show the average predicted probabilities of needing RRT for 4 distinct sets of patients as described in the legend. Three prediction periods are shown (12, 6 and 3 months), where, for each period, one Logistic Regression model is used. The black line shows the ideal threshold for all three models. More precisely, using this threshold, all the models (on average) correctly predict RRT for all subsets of patients. Right: AUCs obtained with Logistic Regression for various tests. The AUC values are shown in brackets.

References

    1. Hill NR, Fatoba ST, Oke JL, Hirst JA, O’Callaghan CA, Lasserson DS, et al. Global prevalence of chronic kidney disease—A systematic review and meta-analysis. PloS one. 2016;11(7):e0158765 10.1371/journal.pone.0158765 - DOI - PMC - PubMed
    1. Tsai MH, Hsu CY, Lin MY, Yen MF, Chen HH, Chiu YH, et al. Incidence, prevalence, and duration of chronic kidney disease in Taiwan: Results from a community-based screening program of 106,094 individuals. Nephron. 2018;140(3):175–184. 10.1159/000491708 - DOI - PubMed
    1. Wu MY, Wu MS. Taiwan renal care system: A learning health-care system. Nephrology. 2018;23:112–115. 10.1111/nep.13460 - DOI - PubMed
    1. Eknoyan G, Lameire N, Barsoum R, Eckardt KU, Levin A, Levin N, et al. The burden of kidney disease: Improving global outcomes. Kidney International. 2004;66(4):1310–1314. 10.1111/j.1523-1755.2004.00894.x - DOI - PubMed
    1. Saran R, Robinson B, Abbott KC, Agodoa LY, Albertus P, Ayanian J, et al. US renal data system 2016 annual data report: Epidemiology of kidney disease in the United States. American Journal of Kidney Diseases. 2017;69(3):A7–A8. 10.1053/j.ajkd.2016.12.004 - DOI - PMC - PubMed

Publication types