. 2020 Jun 9;4(11):2489-2500.
doi: 10.1182/bloodadvances.2020001441.

Branched evolution and genomic intratumor heterogeneity in the pathogenesis of cutaneous T-cell lymphoma

Affiliations

Branched evolution and genomic intratumor heterogeneity in the pathogenesis of cutaneous T-cell lymphoma

Aishwarya Iyer et al. Blood Adv. .

Abstract

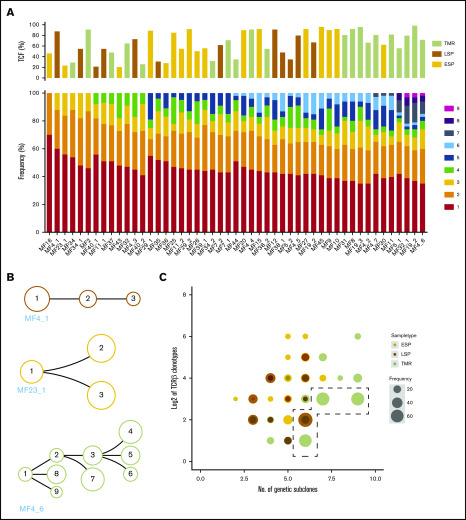
Mycosis fungoides (MF) is a slowly progressive cutaneous T-cell lymphoma (CTCL) for which there is no cure. In the early plaque stage, the disease is indolent, but development of tumors heralds an increased risk of metastasis and death. Previous research into the genomic landscape of CTCL revealed a complex pattern of >50 driver mutations implicated in more than a dozen signaling pathways. However, the genomic mechanisms governing disease progression and treatment resistance remain unknown. Building on our previous discovery of the clonotypic heterogeneity of MF, we hypothesized that this lymphoma does not progress in a linear fashion as currently thought but comprises heterogeneous mutational subclones. We sequenced exomes of 49 cases of MF and identified 28 previously unreported putative driver genes. MF exhibited extensive intratumoral heterogeneity (ITH) of a median of 6 subclones showing a branched phylogenetic relationship pattern. Stage progression was correlated with an increase in ITH and redistribution of mutations from stem to clades. The pattern of clonal driver mutations was highly variable, with no consistent mutations among patients. Similar intratumoral heterogeneity was detected in leukemic CTCL (Sézary syndrome). Based on these findings, we propose a model of MF pathogenesis comprising divergent evolution of cancer subclones and discuss how ITH affects the efficacy of targeted drug therapies and immunotherapies for CTCL.


Conflict of interest statement

Conflict-of-interest disclosure: The authors declare no competing financial interests.

Figures

None
Graphical abstract
Figure 1.
Figure 1.
Summary of experimental methods and data analysis. (A) From 31 patients with MF, 49 biopsies were obtained. In 6 patients with tumor (TMR) stage disease, paired biopsies from TMRs and late-stage plaques (LSPs) were obtained. (B) TMR cell clusters microdissected from the lesional skin and matching control tissue (peripheral blood or the epidermis; not shown) were sequenced by whole-exome sequencing (WES). (C) The genetic aberration data (single-nucleotide variants [SNVs] and CNAs) were used for the reconstruction of MF phylogenetic trees. CNA, copy-number aberration; ESP, early-stage plaque; GATK, Genome Analysis Toolkit; PCR, polymerase chain reaction; SSV, single-somatic variants; TCF, tumor cell fraction; WGS, whole-genome sequencing.
Figure 2.
Figure 2.
Mutational landscape of putative driver genes in MF. (A) Number of nonsynonymous SVs in ESP, LSP, and tumor (TMR) samples. Box-and-whisker plot showing 90th percentile, respectively. Filled square indicates 10th percentile; filled triangle indicates 90th percentile. (B) Identification of amino acid–altering mutations in 75 putative driver genes across 21 different pathways. Black gene symbols annotate the previously reported 47 driver genes in CTCL; the previously unreported 28 potential drivers identified in this study are highlighted in blue. Damaging mutations indicate frameshift mutations, short read insertion and deletion (<6 bp), stop gain, or stop loss.
Figure 3.
Figure 3.
Genomic copy-number changes in MF. (A) Heatmap showing copy-number changes for the 49 MF samples separated by type of lesion (ESP, LSP, tumor [TMR]). Red bars indicate amplifications; blue bars indicate deletions. Numbers of amplifications and deletions are presented on a log2 scale. Bar charts at the top show the difference in numbers of amplifications (+1 per sample) or deletions (−1 per sample) at each chromosome across lesion types. (B) Difference in numbers of amplifications or deletions for putative driver genes in each subgroup of MF samples.
Figure 4.
Figure 4.
Intratumoral heterogeneity in MF. Combined data from SVs and CNAs for each sample underwent phylogenetic analysis to identify genetic subclones, as in Figure 1. (A) Rainbow graph representing the number and frequency of the subclones identified in each sample. Samples are arranged by an increasing number of subclones. Top bar graph shows TCF for each sample; color of the bar indicates type of lesion (ESP, LSP, tumor [TMR]). (B) Examples of 3 major categories of phylogenetic trees: nonbranched linear sequence of subclones (upper), simple branched structure with 1 generation of subclones (middle), and complex structure with several generations of subclones (lower). All phylogenetic trees are shown in supplemental Figure 3. (C) Bubble plot showing correlation between the number of neoplastic clonotypes and number of subclones in the samples. Size of the bubble is proportional to the frequency of the first-ranked (most abundant) clonotype. Dashed line highlights the samples where the first-ranked clonotype had a relative frequency of ≥60%.
Figure 5.
Figure 5.
Distribution of mutations in the stem and clades in MF. (A) Percentage of all SNV mutations in the stem (blue) and clades (red) of the phylogenetic tree. (B) Mutational landscape of the putative driver genes in the stem and clades of the phylogenetic tree. Black square indicates a function-changing mutation (missense, frameshift, insertion, deletion, stop gain or loss, or variant in 3′ or 5′ untranslated region). Mutations of the same gene found both in the stem and clades signify different positions of the mutation. TMR, tumor.
Figure 6.
Figure 6.
Phylogenetic relationship between different lesions in the same patient: topologic heterogeneity in MF. Pairs of LSP and tumor (TMR) biopsies were collected from 6 patients and analyzed as in Figure 4. Red branches represent TMR (T), green branches symbolize evolution of the LSP (P). Blue circles represent common clones shared by TMRs and LSPs (C). Black circle represents a phylogenetic tree without an identifiable ancestor clone.
Figure 7.
Figure 7.
Proposed model of the evolution of MF. Skin lesions of MF are formed by seeding with the circulating malignant T-cell clones, which undergo further mutational evolution. (A) It is likely malignant clones originate from an immature T cell transformed before TCRB rearrangement and therefore show clonotypic heterogeneity (highlighted by different colors of the cytoplasm). (B) These circulating neoplastic T cells undergo expansion and accumulate mutations, leading to emergence of genetically different malignant subclones (different colors of the nucleus). Some of the circulating malignant cells seed into the skin (stippled gray arrows) (C), where they proliferate, accumulate additional mutations, and develop additional subclones as the disease progresses (D). (E) Some subclones may reenter the circulation and seed other skin lesions (red stippled arrow), further increasing the heterogeneity of the lesions and causing disease progression. Solid lines symbolize the phylogenetic relationship between generations of malignant cells that follow the pattern of divergent, neutral evolution. Data from this study and our previous work.,,,

References

    1. Rizvi MA, Evens AM, Tallman MS, Nelson BP, Rosen ST. T-cell non-Hodgkin lymphoma. Blood. 2006;107(4):1255-1264. - PubMed
    1. Ansell SM. Non-Hodgkin lymphoma: diagnosis and treatment. Mayo Clin Proc. 2015;90(8):1152-1163. - PubMed
    1. da Silva Almeida AC, Abate F, Khiabanian H, et al. . The mutational landscape of cutaneous T cell lymphoma and Sézary syndrome. Nat Genet. 2015;47(12):1465-1470. - PMC - PubMed
    1. Choi J, Goh G, Walradt T, et al. . Genomic landscape of cutaneous T cell lymphoma. Nat Genet. 2015;47(9):1011-1019. - PMC - PubMed
    1. Bastidas Torres AN, Cats D, Mei H, et al. . Genomic analysis reveals recurrent deletion of JAK-STAT signaling inhibitors HNRNPK and SOCS1 in mycosis fungoides. Genes Chromosomes Cancer. 2018;57(12):653-664. - PMC - PubMed

Publication types