. 2020 Jul 20;30(14):2836-2843.e3.
doi: 10.1016/j.cub.2020.05.007. Epub 2020 Jun 4.

The Evolution of Mass Cell Suicide in Bacterial Warfare

Affiliations

The Evolution of Mass Cell Suicide in Bacterial Warfare

Elisa T Granato et al. Curr Biol. .

Abstract

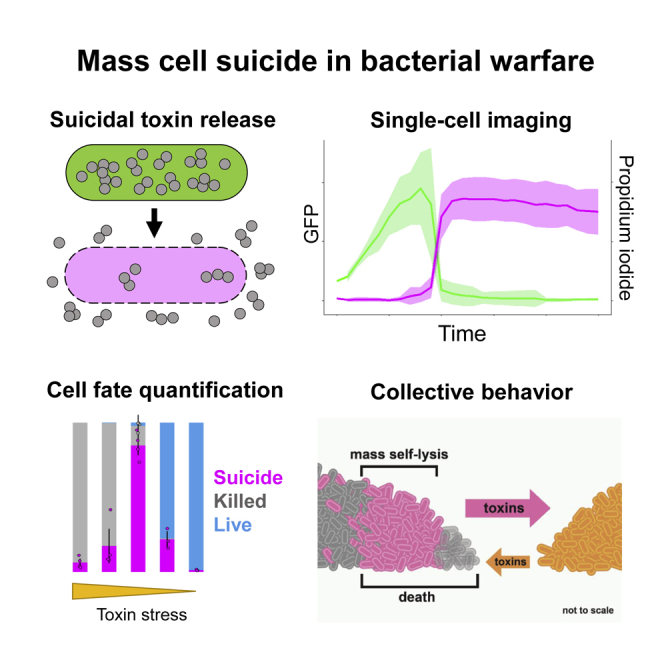
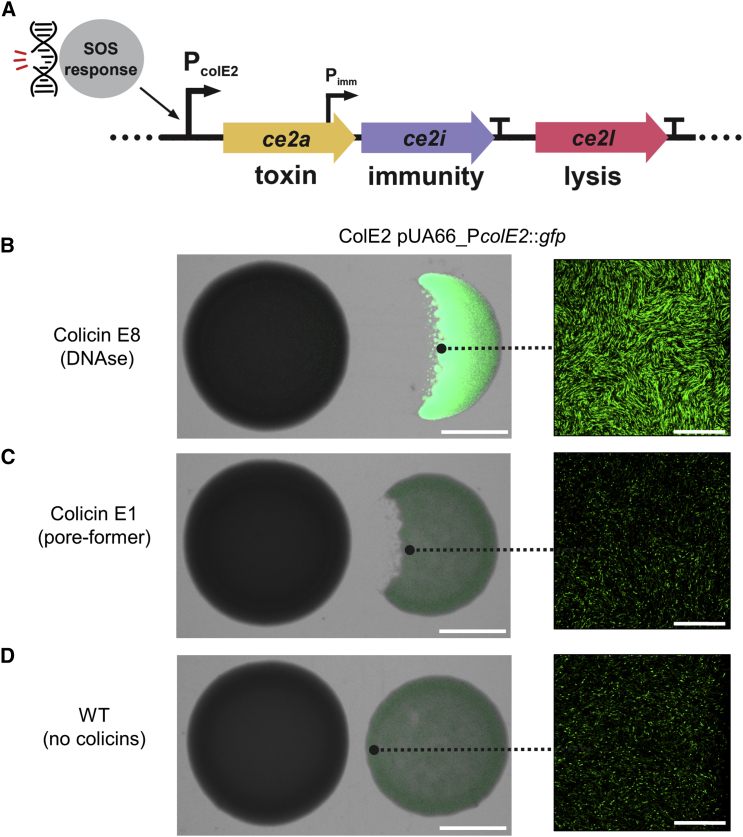
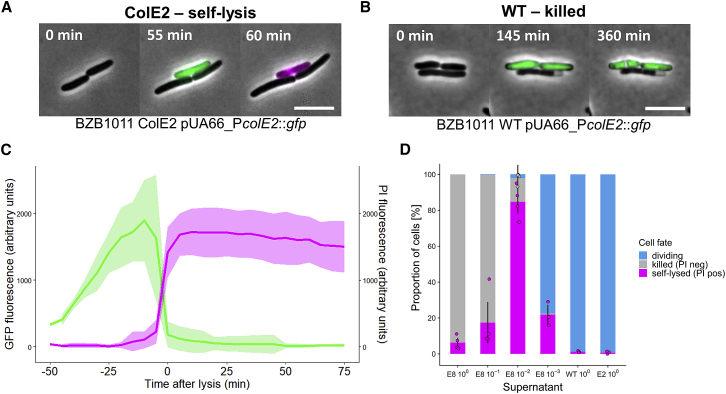
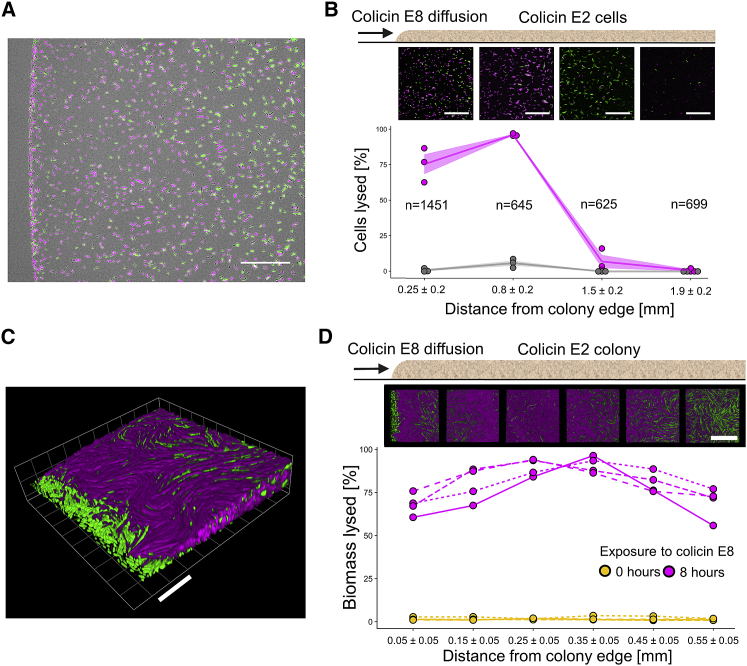
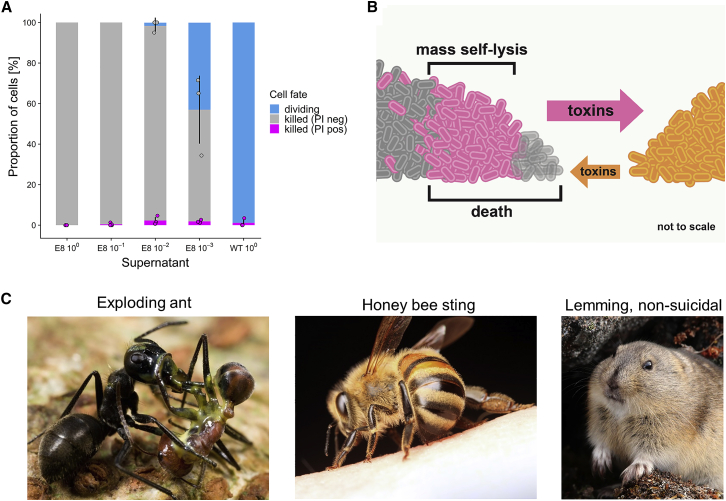
Behaviors that cause the death of an actor are typically strongly disfavored by natural selection, and yet many bacteria undergo cell lysis to release anti-competitor toxins [1-5]. This behavior is most easily explained if only a small proportion of cells die to release toxins and help their clonemates, but the frequency of cells that actually lyse during bacterial warfare is unknown. The challenge is finding a way to distinguish cells that have undergone programmed suicide from those that were simply killed by a competitor's toxin. We developed a two-color fluorescence reporter assay in Escherichia coli to overcome this problem. This revealed conditions where nearly all cells undergo programmed lysis. Specifically, adding a DNA-damaging toxin (DNase colicin) from another strain induced mass cell suicide where ∼85% of cells lysed to release their own toxins. Time-lapse 3D confocal microscopy showed that self-lysis occurs locally at even higher frequencies (∼94%) at the interface between toxin-producing colonies. By exposing E. coli that do not perform lysis to the DNase colicin, we found that mass lysis occurs when cells are going to die anyway from toxin exposure. From an evolutionary perspective, this renders the behavior cost-free as these cells have zero reproductive potential. This helps to explain how mass cell suicide can evolve, as any small benefit to surviving clonemates can lead to this retaliatory strategy being favored by natural selection. Our findings have parallels to the suicidal attacks of social insects [6-9], which are also performed by individuals with low reproductive potential.

Keywords: Escherichia coli; bacteriocins; cell suicide; colicins; collective behavior; competition; kin selection; social evolution; warfare.


Conflict of interest statement

Declaration of Interests The authors declare no competing interests.

Figures

None
Graphical abstract
Figure 1
Figure 1
E. coli Activates the Colicin Operon in Response to a Competitor Causing DNA Damage (A) Overview of the colicin operon as encoded on plasmid pColE2-P9 in E. coli. In response to DNA damage, the PcolE2 promoter is activated and the genes encoding colicin E2 (ce2a) and its cognate immunity protein (ce2i) are expressed. To ensure sufficient levels of immunity protein, ce2i is additionally transcribed from a second, constitutively active promoter (Pimm) located within the ce2a gene. A transcriptional terminator (T) after the immunity gene ce2i ensures that the downstream gene encoding the lysis protein (ce2l) is only expressed at very high levels of PcolE2 activation. Adapted from [1]. (B) The response of the E. coli colicin E2 promoter to a foreign DNase colicin (colicin E8). E. coli BZB1011 colonies producing colicin E2 were grown next to competitor colonies overnight and then imaged by stereomicroscopy (left) and confocal microscopy (right). In the colicin E2 producer, the colicin E2 promoter also drives the expression of GFP on a reporter plasmid (pUA66-PcolE2::gfp). (C) Absence of response of the E. coli colicin E2 promoter to the pore-forming colicin E1 made by E. coli BZB1011 carrying the colicin E1 plasmid. (D) Wild-type control where the left-hand strain (BZB1011) lacks any colicin plasmid and so does not produce colicins. Scale bars, 2 mm (left) and 50 μm (right).
Figure 2
Figure 2
Self-lysis Frequency in E. coli Is Modulated by Competitor Toxin Concentrations (A) Representative time-lapse micrographs of ColE2 pUA66-PcolE2::gfp cells undergoing self-lysis. Phase-contrast channel, GFP channel, and propidium iodide (PI) channel are overlaid in all images. GFP signal indicates colicin promoter activation. PI signal indicates membrane permeabilization, i.e., self-lysis. Scale bar, 5 μm. See Video S1. (B) Representative time-lapse micrographs of wild-type cells (WT pUA66-PcolE2::gfp) being killed by a foreign DNase colicin (colicin E8). Phase-contrast channel, GFP channel, and propidium iodide (PI) channel are overlaid in all images. The absence of PI signal in a non-dividing, dead cell is indicative of an intact membrane and killing by the action of the colicin. Scale bar, 5 μm. See Video S2. (C) Fluorescence signals in cells undergoing self-lysis in response to colicin E8. ColE2 pUA66-PcolE2::gfp cells were exposed to a 1% dilution of supernatant of a colicin E8-producing strain and imaged for up to 6 h. Individual cell fluorescence signals are shown for the GFP channel (green) and PI channel (magenta). Thick lines and shaded areas indicate the mean and standard deviation across n = 20 lysed cells in the same field of view. See Video S3. Figure S1C and Video S4 show a negative control where colicin E8 is added to wild-type cells that lack the colicin plasmid. (D) Cell-fate frequencies in populations of E. coli exposed to colicin E8. ColE2 pUA66-PcolE2::gfp cells were exposed to different dilutions of supernatant of a colicin E8-producing strain, a non-producing wild-type, or their own sterile supernatant. Cells were imaged for up to 6 h, and the fate of n = 7,985 cells across all treatments was categorized as either dividing, killed (non-dividing and PI-negative), or self-lysed (non-diving and PI-positive). Error bars indicate SEM across three or four biological replicates. A Kruskal-Wallis test yielded a statistically significant relationship between supernatant concentrations and self-lysis frequencies (chi-square test = 18.285, df = 5, p = 0.0003).
Figure 3
Figure 3
Colonies Facing a Competitor Exhibit Local Mass Self-lysis Self-lysis quantification in colonies exposed to colicin E8 produced by a nearby colony. (A and B) Cells of a strain either capable of producing colicin E2 and self-lysing (ColE2 pUA66-PcolE2::gfp) or a wild-type non-producer incapable of self-lysis (WT pUA66-PcolE2::gfp) were grown in monolayer colonies next to a ColE8 competitor. Cells were time-lapse imaged at different distances from the colony edge facing the competitor using fluorescence microscopy. (A) Representative image of a ColE2 pUA66-PcolE2::gfp colony edge after 2 h of exposure to the competitor. Scale bar, 100 μm. (B) Self-lysis frequencies in ColE2 pUA66-PcolE2::gfp cells (magenta) and WT pUA66-PcolE2::gfp cells (gray) tracked over 6 h (n = cells tracked over ≥4 h). Lines and shaded areas indicate mean ± SEM across three biological replicates. Representative fluorescence images of ColE2 pUA66-PcolE2::gfp cells after 4 h are shown above each distance point. Scale bar, 100 μm. Strains exhibited significantly different frequencies of propidium iodide (PI)-specific fluorescence at distances 0.25 and 0.8 mm (linear model: percent.lysis ~strain; F(1,4) = 114.1 for distance 0.25, 2,368 for distance 0.8; p < 0.001). See Video S5. (C and D) Cells producing GFP constitutively and capable of producing colicin E2 and self-lysing (ColE2 gfp) were grown in three-dimensional colonies next to a ColE8 competitor. Colonies were time-lapse imaged for 8 h at different distances from the colony edge facing the competitor using 3D confocal microscopy. (C) A 3D-rendered image of a colony edge after 8 h of exposure to colicin E8 flowing in from the bottom-left corner of the image. Scale bar, 20 μm. (D) Self-lysis relative to total biomass before and after 8 h of exposure to the competitor. Line types indicate four biological replicates. Self-lysis frequency significantly increased during exposure (linear model: percent.lysis ~time point; F(1,6) >212.2 for all distances; p < 0.001). Representative confocal images of a colony viewed from above after 8 h of observation are shown above each distance point. Scale bar, 50 μm. See Video S6. See Figure S2 for the same experiment using a wild-type, non-producing control strain.
Figure 4
Figure 4
Suicidal Behavior Is Associated with Low Reproductive Potential (A) Cell-fate frequencies in response to colicin E8 in E. coli cells unable to self-lyse. WT pUA66-PcolE2::gfp cells were exposed to different dilutions of supernatant of a colicin E8-producing strain or a non-producing wild-type. Cells were imaged for up to 6 h, and the fate of n = 3,666 cells across all treatments was categorized as either dividing, dead and PI-negative, or dead and PI-positive. Error bars indicate SEM across three or four biological replicates. A Kruskal-Wallis test did not yield a statistically significant relationship between supernatant concentrations and frequency of cells positive for PI-specific fluorescence (chi-square test = 7.8486, df = 4, p = 0.09). (B) Illustration of the mass cell suicide phenotype. In the region where the toxins (orange arrow) of the competing strain (orange) reaches lethal levels, large number of cells of the focal strain lyse (pink) and release colicins en masse (pink arrow). Cell suicide does not occur at the very edge of the colony on the left (transparent gray cells), as these cells die immediately from the competitors toxins. (C) Two examples of suicidal behaviors in social insects, and a popular misconception. Left: a minor Colobopsis cylindricus (“exploding ant”) worker has ruptured her body to release a sticky yellow substance, killing both herself and her opponent, the larger worker of another ant species (Camponotus sp.) [7, 34]. Middle: honeybee (Apis mellifera) workers sting in defense of their colony, which often results in the worker’s death as the sting gets pulled out of her body [8]. Right: a long-standing myth incorrectly holds that lemmings commit mass suicide. The example is illustrative because—unlike in the social insects and bacteria where low reproductive potential and benefits to kin can explain suicidal behaviors—there is no evolutionary rationale for such behavior in lemmings. Image sources: ants (Mark Moffett/Minden Pictures, used with permission); honeybee (Alexander Wild, used with permission); northern collared lemming (Jeremy Gatten, used with permission).

References

    1. Cascales E., Buchanan S.K., Duché D., Kleanthous C., Lloubès R., Postle K. Colicin Biology. Microbiol. Mol. Biol. Rev. 2007;71:158–229. - PMC - PubMed
    1. Pugsley A.P., Goldzahl N., Barker R.M. Colicin E2 production and release by Escherichia coli K12 and other Enterobacteriaceae. J. Gen. Microbiol. 1985;131:2673–2686. - PubMed
    1. Michel-Briand Y., Baysse C. The pyocins of Pseudomonas aeruginosa. Biochimie. 2002;84:499–510. - PubMed
    1. Šmajs D., Pilsl H., Braun V. Colicin U, a novel colicin produced by Shigella boydii. J. Bacteriol. 1997;179:4919–4928. - PMC - PubMed
    1. Riley M.A., Pinou T., Wertz J.E., Tan Y., Valletta C.M. Molecular characterization of the klebicin B plasmid of Klebsiella pneumoniae. Plasmid. 2001;45:209–221. - PubMed

Publication types

MeSH terms

LinkOut - more resources