

PunctaSpecks: A tool for automated detection, tracking, and analysis of multiple types of fluorescently labeled biomolecules
- PMID: 32502904
- PMCID: PMC7343294
- DOI: 10.1016/j.ceca.2020.102224
PunctaSpecks: A tool for automated detection, tracking, and analysis of multiple types of fluorescently labeled biomolecules
Abstract
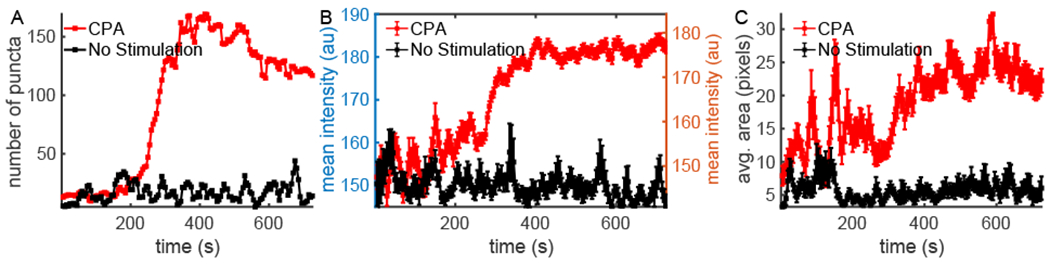
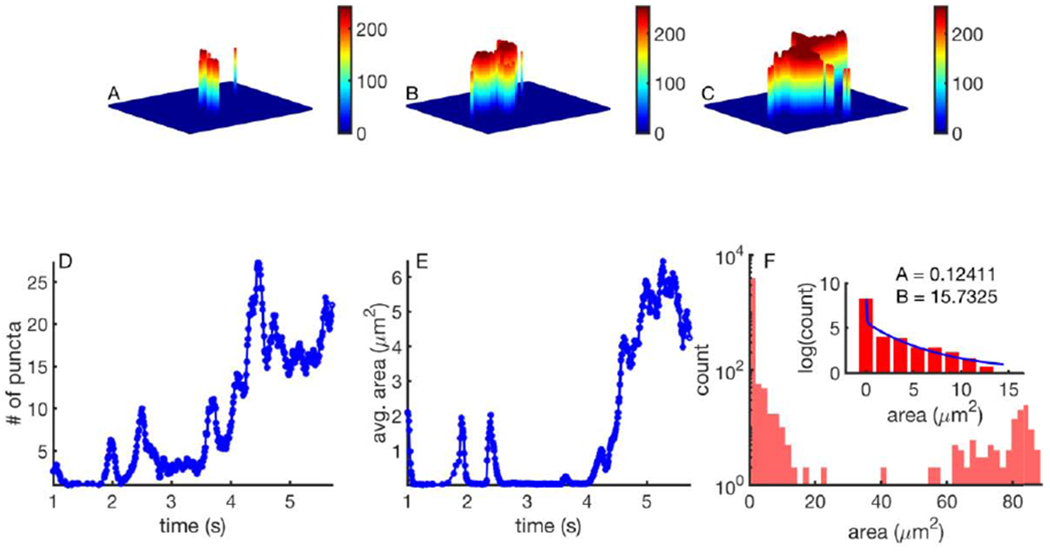
Recent advances in imaging technology and fluorescent probes have made it possible to gain information about the dynamics of subcellular processes at unprecedented spatiotemporal scales. Unfortunately, a lack of automated tools to efficiently process the resulting imaging data encoding fine details of the biological processes remains a major bottleneck in utilizing the full potential of these powerful experimental techniques. Here we present a computational tool, called PunctaSpecks, that can characterize fluorescence signals arising from a wide range of biological molecules under normal and pathological conditions. Among other things, the program can calculate the number, areas, life-times, and amplitudes of fluorescence signals arising from multiple sources, track diffusing fluorescence sources like moving mitochondria, and determine the overlap probability of two processes or organelles imaged using indicator dyes of different colors. We have tested PunctaSpecks on synthetic time-lapse movies containing mobile fluorescence objects of various sizes, mimicking the activity of biomolecules. The robustness of the software is tested by varying the level of noise along with random but known pattern of appearing, disappearing, and movement of these objects. Next, we use PunctaSpecks to characterize protein-protein interaction involved in store-operated Ca2+ entry through the formation and activation of plasma membrane-bound ORAI1 channel and endoplasmic reticulum membrane-bound stromal interaction molecule (STIM), the evolution of inositol 1,4,5-trisphosphate (IP3)-induced Ca2+ signals from sub-micrometer size local events into global waves in human cortical neurons, and the activity of Alzheimer's disease-associated β amyloid pores in the plasma membrane. The tool can also be used to study other dynamical processes imaged through fluorescence molecules. The open source algorithm allows for extending the program to analyze more than two types of biomolecules visualized using markers of different colors.
Keywords: Amyloid beta pores; Characterizing fluorescence data; Human cortical neurons; ORAI1-STIM1 interaction; PunctaSpecks; Tracking fluorescence molecules.
Copyright © 2020 Elsevier Ltd. All rights reserved.
Conflict of interest statement
Declaration of competing interest Authors declare no conflict of interest.
Figures


Similar articles
-
The store-operated Ca2+ entry complex comprises a small cluster of STIM1 associated with one Orai1 channel.Proc Natl Acad Sci U S A. 2021 Mar 9;118(10):e2010789118. doi: 10.1073/pnas.2010789118. Proc Natl Acad Sci U S A. 2021. PMID: 33649206 Free PMC article.
-
The STIM-Orai Pathway: Conformational Coupling Between STIM and Orai in the Activation of Store-Operated Ca2+ Entry.Adv Exp Med Biol. 2017;993:83-98. doi: 10.1007/978-3-319-57732-6_5. Adv Exp Med Biol. 2017. PMID: 28900910 Free PMC article. Review.
-
Differential roles for STIM1 and STIM2 in store-operated calcium entry in rat neurons.PLoS One. 2011 Apr 26;6(4):e19285. doi: 10.1371/journal.pone.0019285. PLoS One. 2011. PMID: 21541286 Free PMC article.
-
Increased Confinement and Polydispersity of STIM1 and Orai1 after Ca2+ Store Depletion.Biophys J. 2020 Jan 7;118(1):70-84. doi: 10.1016/j.bpj.2019.11.019. Epub 2019 Nov 22. Biophys J. 2020. PMID: 31818466 Free PMC article.
-
Tuning store-operated calcium entry to modulate Ca2+-dependent physiological processes.Biochim Biophys Acta Mol Cell Res. 2019 Jul;1866(7):1037-1045. doi: 10.1016/j.bbamcr.2018.11.018. Epub 2018 Dec 3. Biochim Biophys Acta Mol Cell Res. 2019. PMID: 30521873 Review.
Cited by
-
SpyDen: simplifying molecular and structural analysis across spines and dendrites.Bioinformatics. 2025 Jul 1;41(7):btaf339. doi: 10.1093/bioinformatics/btaf339. Bioinformatics. 2025. PMID: 40569855 Free PMC article.
-
An automated method to discover true events and classification of intracellular Ca2+ profiles for endothelium in situ injury assay.Front Physiol. 2023 May 11;14:1161023. doi: 10.3389/fphys.2023.1161023. eCollection 2023. Front Physiol. 2023. PMID: 37250125 Free PMC article.
-
Protocol for characterizing biomolecular condensates through live-cell imaging and analysis.STAR Protoc. 2025 Aug 6;6(3):104013. doi: 10.1016/j.xpro.2025.104013. Online ahead of print. STAR Protoc. 2025. PMID: 40779395 Free PMC article.
-
Visualizing, quantifying, and manipulating mitochondrial DNA in vivo.J Biol Chem. 2020 Dec 18;295(51):17588-17601. doi: 10.1074/jbc.REV120.015101. J Biol Chem. 2020. PMID: 33454000 Free PMC article. Review.
-
Prolonged Activity Deprivation Causes Pre- and Postsynaptic Compensatory Plasticity at Neocortical Excitatory Synapses.eNeuro. 2024 Jun 7;11(6):ENEURO.0366-23.2024. doi: 10.1523/ENEURO.0366-23.2024. Print 2024 Jun. eNeuro. 2024. PMID: 38777611 Free PMC article.
References
-
- Alvarez LAJ, Widzgowski B, Ossato G, van den Broek B, Jalink K, Kuschel L, Roberti MJ, Hecht F, SP8 FALCON: a novel concept in fluorescence lifetime imaging enabling video-rate confocal FLIM, Nat Methods, 16 (2019).
-
- Tsien RY, Imagining imaging’s future, Nat Cell Biol, (2003) Ss16–Ss21. - PubMed
-
- Stephens DJ, Allan VJ, Light microscopy techniques for live cell Imaging, Science, 300 (2003) 82–86. - PubMed
-
- Lippincott-Schwartz J, Patterson GH, Development and use of fluorescent protein markers in living cells, Science, 300 (2003) 87–91. - PubMed
Publication types
MeSH terms
Substances
Grants and funding
LinkOut - more resources
Full Text Sources
Miscellaneous
