. 2020 Jun 3;12(6):610.
doi: 10.3390/v12060610.

Differential Effects of Human Adenovirus E1A Protein Isoforms on Aerobic Glycolysis in A549 Human Lung Epithelial Cells

Affiliations

Differential Effects of Human Adenovirus E1A Protein Isoforms on Aerobic Glycolysis in A549 Human Lung Epithelial Cells

Martin A Prusinkiewicz et al. Viruses. .

Abstract

Viruses alter a multitude of host-cell processes to create a more optimal environment for viral replication. This includes altering metabolism to provide adequate substrates and energy required for replication. Typically, viral infections induce a metabolic phenotype resembling the Warburg effect, with an upregulation of glycolysis and a concurrent decrease in cellular respiration. Human adenovirus (HAdV) has been observed to induce the Warburg effect, which can be partially attributed to the adenovirus protein early region 4, open reading frame 1 (E4orf1). E4orf1 regulates a multitude of host-cell processes to benefit viral replication and can influence cellular metabolism through the transcription factor avian myelocytomatosis viral oncogene homolog (MYC). However, E4orf1 does not explain the full extent of Warburg-like HAdV metabolic reprogramming, especially the accompanying decrease in cellular respiration. The HAdV protein early region 1A (E1A) also modulates the function of the infected cell to promote viral replication. E1A can interact with a wide variety of host-cell proteins, some of which have been shown to interact with metabolic enzymes independently of an interaction with E1A. To determine if the HAdV E1A proteins are responsible for reprogramming cell metabolism, we measured the extracellular acidification rate and oxygen consumption rate of A549 human lung epithelial cells with constitutive endogenous expression of either of the two major E1A isoforms. This was followed by the characterization of transcript levels for genes involved in glycolysis and cellular respiration, and related metabolic pathways. Cells expressing the 13S encoded E1A isoform had drastically increased baseline glycolysis and lower maximal cellular respiration than cells expressing the 12S encoded E1A isoform. Cells expressing the 13S encoded E1A isoform exhibited upregulated expression of glycolysis genes and downregulated expression of cellular respiration genes. However, tricarboxylic acid cycle genes were upregulated, resembling anaplerotic metabolism employed by certain cancers. Upregulation of glycolysis and tricarboxylic acid cycle genes was also apparent in IMR-90 human primary lung fibroblast cells infected with a HAdV-5 mutant virus that expressed the 13S, but not the 12S encoded E1A isoform. In conclusion, it appears that the two major isoforms of E1A differentially influence cellular glycolysis and oxidative phosphorylation and this is at least partially due to the altered regulation of mRNA expression for the genes in these pathways.

Keywords: 12S; 13S; E1A; Warburg effect; cellular respiration; glycolysis; human adenovirus; oxidative phosphorylation; pentose phosphate pathway; tricarboxylic acid cycle.


Conflict of interest statement

The authors declare no conflict of interest. The funders had no role in the design of the study; in the collection, analyses, or interpretation of data; in the writing of the manuscript, or in the decision to publish the results.

Figures

Figure 1
Figure 1
A549-13S cells have a unique functional glycolytic and oxidative phosphorylation metabolism when compared to A549-12S and A549-EV cells. (A) Seahorse XFe24 assay of extracellular acidification rates, a readout of glycolysis. Extracellular acidification rates were highest in A549-13S cells after addition of glucose, which is a reflection of the baseline glycolytic rate after stimulation. However, A549-EV cells had the highest maximum extracellular acidification rates after addition of oligomycin, which forces maximal glycolysis by inhibition of ATP synthase. There were no differences in response after the addition of 2-deoxyglucose (2-DG) to shut down glycolysis and end the experiment. * = p < 0.05 in a comparison between A549-13S and either A549-12S or A549-EV cell lines. + = p < 0.05 in a comparison between A549-EV and either A549-12S or A549-13S cell lines. (B) Seahorse XFe24 assay of oxygen consumption rates, a readout of oxidative phosphorylation. The amount of cellular respiration dedicated to ATP production was no different between the cell lines as indicated by oligomycin treatment. Maximal oxygen consumption rates, induced by carbonyl cyanide-4-(trifluoromethoxy)phenylhydrazone (FCCP) which decouples the mitochondria, were lowest in A549-13S cells. There were also no differences between the cell lines after the addition of rotenone and antimycin A used to terminate the experiment. * = p < 0.05 in a comparison between A549-13S and either A549-12S or A549-EV cell lines. 2-DG, 2-deoxyglucose; FCCP, carbonyl cyanide-4-(trifluoromethoxy)phenylhydrazone.
Figure 2
Figure 2
Relative expression levels of mRNA for glycolytic genes in 13S and 12S expressing A549 cells. The mRNA expression for 16 genes encoding components of glycolysis were measured with qPCR (AP). A549-13S cells had higher expression of nine genes (A,E,F,H,J,L,M,N,P) and lower expression of four genes (B,D,G,O) when compared to A549 cells expressing an empty vector. A549-12S cells had higher expression of eight genes (B,E,I,J,K,M,N,P) when compared to A549-EV cells. The combination of differential mRNA expression in the A549-13S cells may contribute to their unusual glycolytic phenotype. H2AFY was used as a reference gene. Asterisks (*) indicate p < 0.05. n = 3 per group for all panels. SLC2A3, Solute carrier family 2 member 3; HK, hexokinase; GPI, Glucose-6-phosphate isomerase; PFKP, Phosphofructokinase, platelet; PFKM, Phosphofructokinase, muscle; PFKFB, 6-phosphofructo-2-kinase/fructose-2,6-biphosphatase; ALDO, Aldolase, fructose biphosphate; TPI, triosephosphate isomerase; GAPDH, Glyceraldehyde 3-phosphate dehydrogenase; PGK, Phosphoglycerate kinase; PGAM1, Phosphoglycerate mutase; ENO, enolase; PKM, Pyruvate kinase M1/2; LDH, Lactate dehydrogenase.
Figure 3
Figure 3
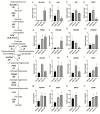
Relative expression of mRNA for pentose phosphate pathway genes in 13S and 12S expressing A549 cells. The mRNA expression for five genes encoding components of the pentose phosphate pathway were measured with qPCR (AE). The pentose phosphate pathway relies on the products of glycolysis. Only the A549-13S cells displayed differential regulation of transcripts in this pathway. Of the five pentose phosphate pathway genes measured, three were downregulated (A,D,E) and one was upregulated in the A549-13S cells (B). H2AFY was used as a reference gene. Asterisks (*) indicate p < 0.05. n = three per group for all panels. G6PD, Glucose-6-phosphate dehydrogenase; 6PGL, 6-phosphogluconolactonase; PGD, Phosphogluconate dehydrogenase; RPE, Ribulose-5-phosphate-3-epimerase; RPI, Ribose 5-phosphate isomerase; TKT, Transketolase; TALDO, Transaldolase; PFK, Phosphofructokinase.
Figure 4
Figure 4
Relative expression of mRNA for tricarboxylic acid cycle genes in 13S and 12S expressing A549 cells. (AO) The mRNA expression for 15 genes encoding components of the tricarboxylic acid (TCA) cycle were measured with qPCR. A549-13S cells displayed upregulated mRNA levels of enzymes involved in the TCA cycle. A549-13S cells had statistically significant upregulation of transcripts encoding six enzymes involved in the TCA cycle (B,G,J,K,M,N) and downregulation of two TCA cycle enzyme encoding transcripts (F,I). In contrast, A549-12S cells did not exhibit any statistically significant differences in TCA cycle transcript expression compared to the A549-EV cells. The geometric mean of two reference genes, H2AFY and ACTB was used. Asterisks (*) indicate p < 0.05. n = three per group for all panels. PDH, pyruvate dehydrogenase; PDP, Pyruvate dehydrogenase phosphatase; CS, Citrate synthase; ACO, Aconitase; IDH, Isocitrate dehydrogenase; OGDH, Oxoglutarate dehydrogenase; SUCLG1, Succinate-CoA ligase GDP/ADP-forming subunit alpha; SUCLG2, Succinate-CoA ligase GDP-forming subunit beta; SDH, Succinate dehydrogenase; FH, Fumarate hydratase; MDH, Malate dehydrogenase.
Figure 5
Figure 5
Relative expression of mRNA for cellular respiration genes in 13S and 12S expressing A549 cells. The mRNA expression for two genes encoding components of the TCA cycle were measured with qPCR. A549-13S cells exhibit downregulated expression of genes encoding components of cellular respiration complex IV. Both (A) COX16 and (B) COX17 mRNA expression was significantly lower in A549-13S cells compared to A549-EV cells. A549-12S cells did not show statistically significant expression differences when compared to A549-12S cells. The geometric mean of two reference genes, H2AFY and ACTB was used. Asterisks (*) indicate p < 0.05. n = three per group for all panels. COX16; Cytochrome C oxidase assembly factor COX16; COX17, Cytochrome C oxidase copper chaperone COX17.
Figure 6
Figure 6
RNAseq analysis of metabolic genes from IMR-90 lung fibroblasts infected with either dl520, pm975 or an E1A-deleted HAdV-5 control virus. (A) RNA expression of glycolytic enzyme-encoding transcripts was often greater in pm975 infected cells than dl520 infected cells. However, dl520 infected cells also expressed glycolytic genes at consistently higher levels than in an E1A-deleted control HAdV-5 infection. (B) RNA expression of transcripts encoding TCA cycle enzymes, more highly up- or downregulated in pm975 infected cells when compared to dl520 infected cells. (C) Transcripts encoding pentose phosphate pathway intermediates in the non-oxidative pentose phosphate pathway branch are more highly upregulated in pm975 infected cells than in dl520 infected cells. (D) Both COX16 and COX17 transcripts, which encode components of the TCA cycle, are upregulated in both pm975 and dl520 infected cells, although to a lesser extent in the pm975 infection. Asterisks (*) indicate an adjusted p-value < 0.05. n = two per group for all panels. Gene names are defined in Figure 2, Figure 3, Figure 4 and Figure 5.

References

    1. Goodwin C.M., Xu S., Munger J. Stealing the keys to the kitchen: Viral manipulation of the host cell metabolic network. Trends Microbiol. 2015;23:789–798. doi: 10.1016/j.tim.2015.08.007. - DOI - PMC - PubMed
    1. Warburg O. The metabolism of carcinoma cells. J. Cancer Res. 1925;9:148–163. doi: 10.1158/jcr.1925.148. - DOI
    1. Sanchez E.L., Lagunoff M. Viral activation of cellular metabolism. Virology. 2015;479–480:609–618. doi: 10.1016/j.virol.2015.02.038. - DOI - PMC - PubMed
    1. Thaker S.K., Ch’ng J., Christofk H.R. Viral hijacking of cellular metabolism. BMC Biol. 2019;17:59. doi: 10.1186/s12915-019-0678-9. - DOI - PMC - PubMed
    1. Prusinkiewicz M.A., Mymryk J.S. Metabolic reprogramming of the host cell by human adenovirus infection. Viruses. 2019;11:141. doi: 10.3390/v11020141. - DOI - PMC - PubMed

Publication types

MeSH terms

Grants and funding

LinkOut - more resources