. 2020 Jun 3;20(11):3169.
doi: 10.3390/s20113169.

Exploration of User's Mental State Changes during Performing Brain-Computer Interface

Affiliations

Exploration of User's Mental State Changes during Performing Brain-Computer Interface

Li-Wei Ko et al. Sensors (Basel). .

Abstract

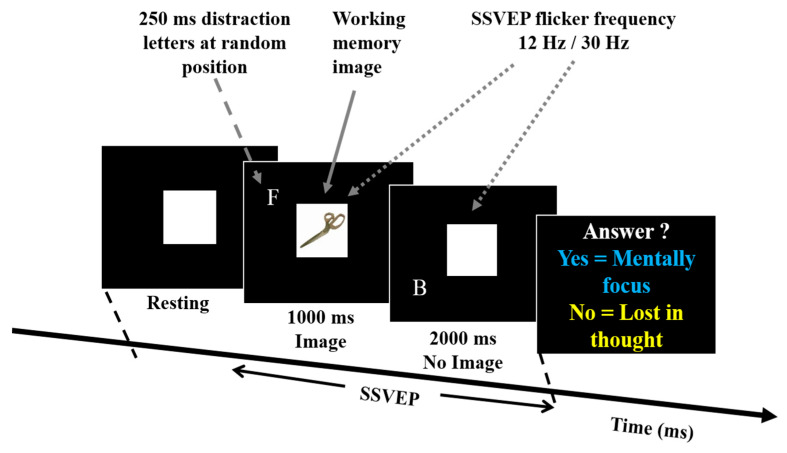
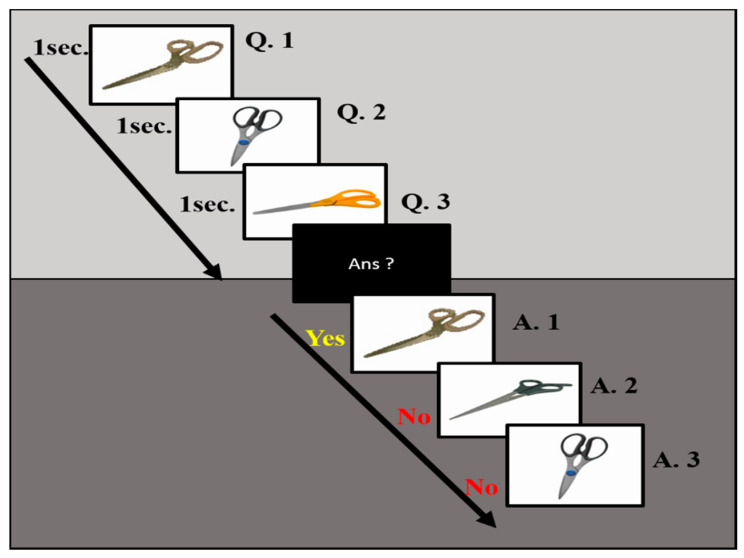
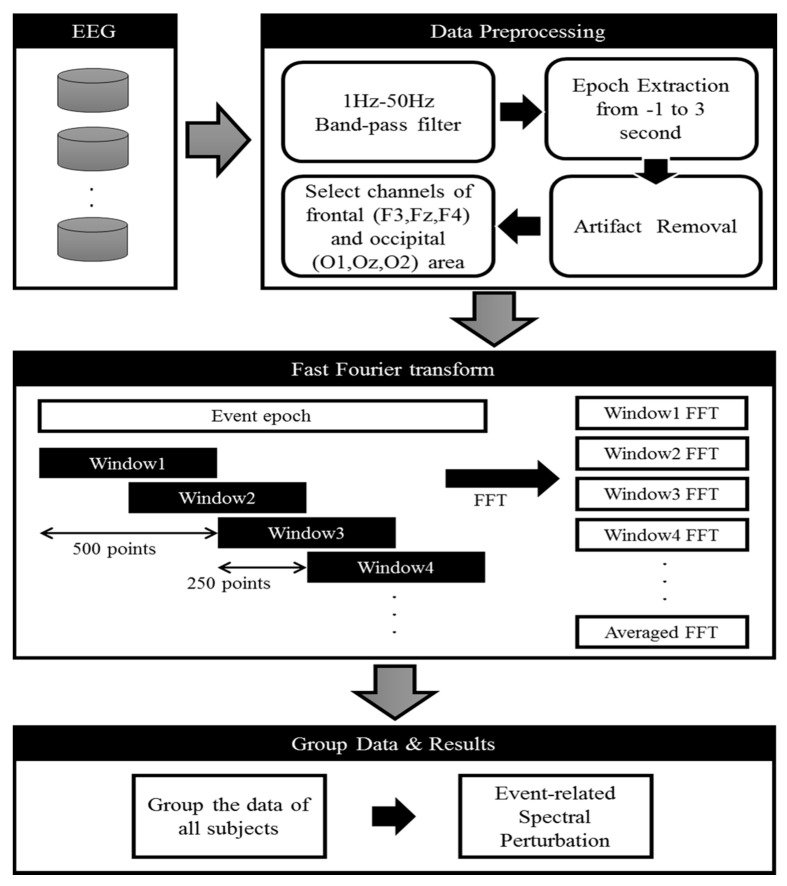
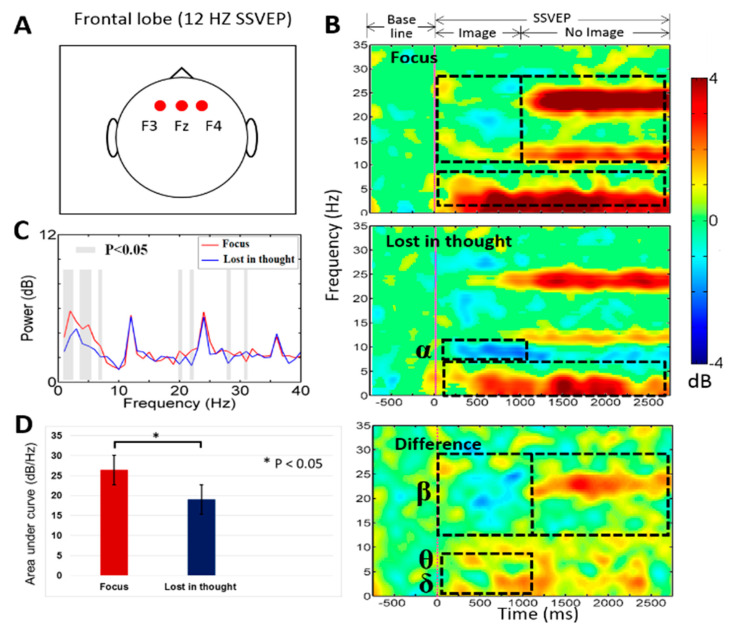
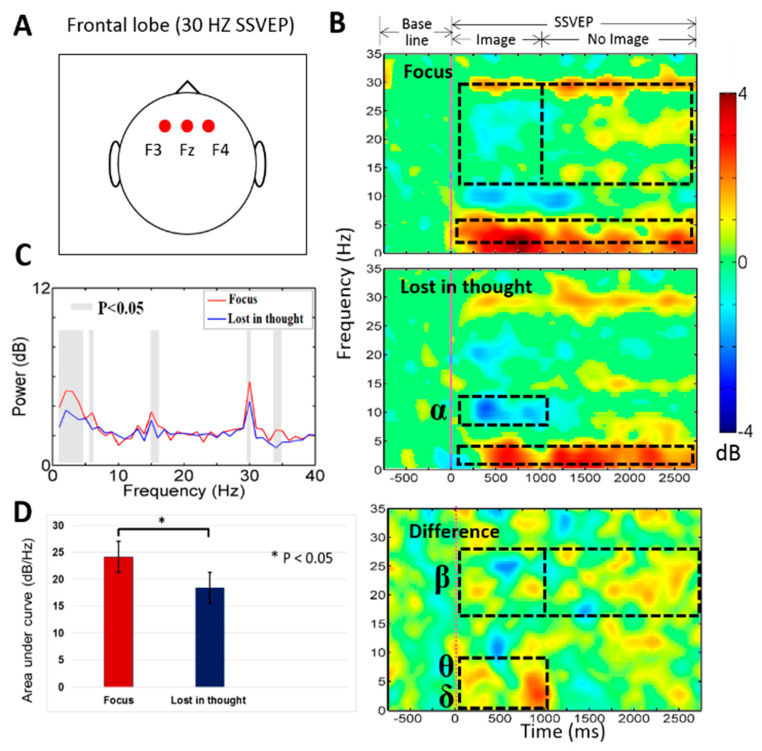
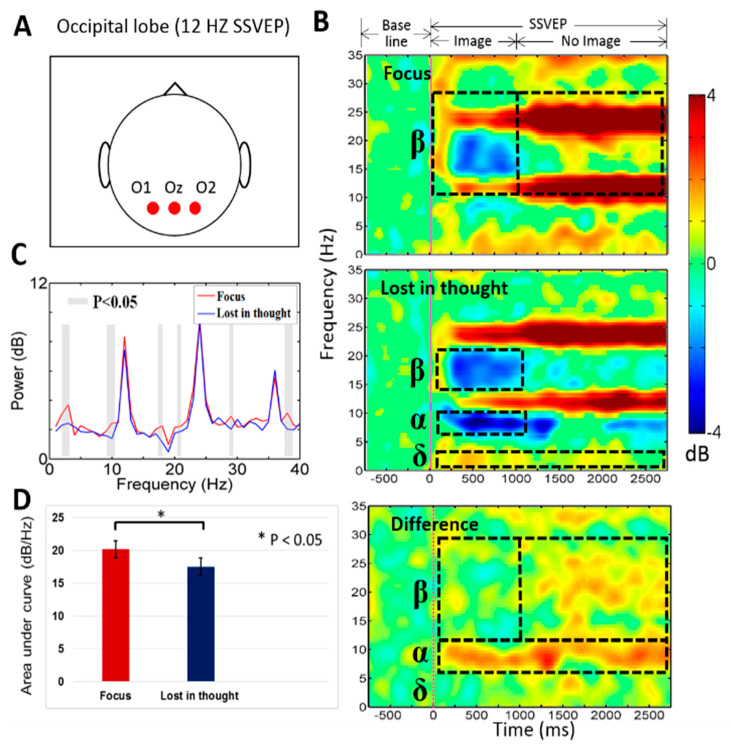
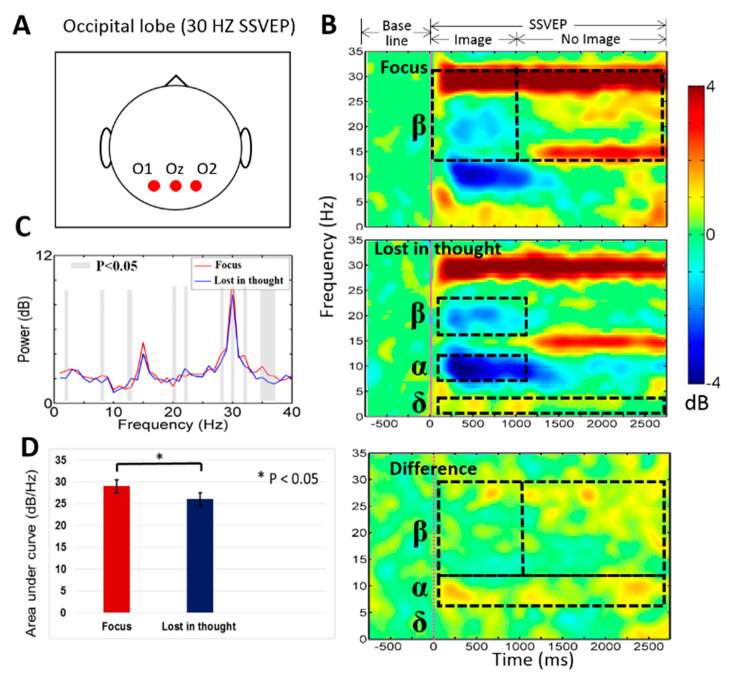
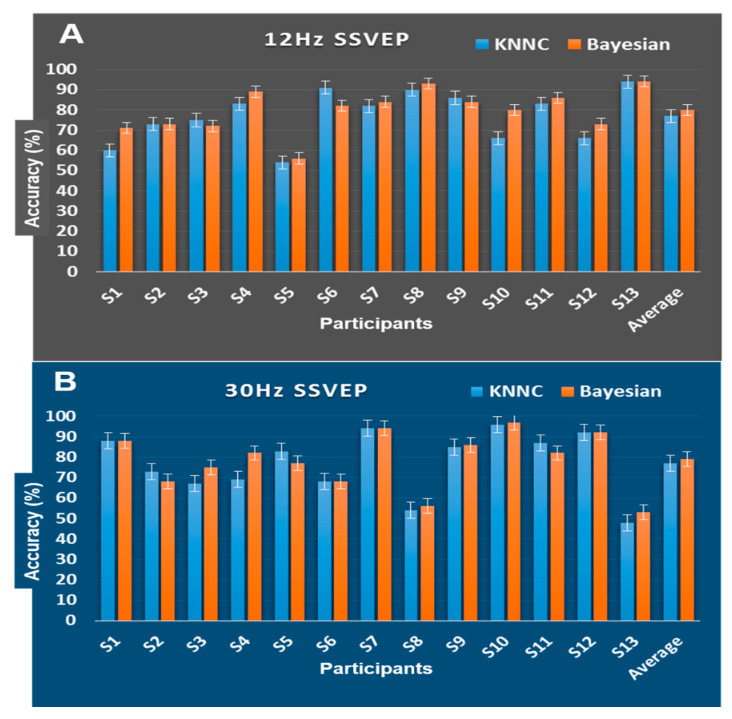
Substantial developments have been established in the past few years for enhancing the performance of brain-computer interface (BCI) based on steady-state visual evoked potential (SSVEP). The past SSVEP-BCI studies utilized different target frequencies with flashing stimuli in many different applications. However, it is not easy to recognize user's mental state changes when performing the SSVEP-BCI task. What we could observe was the increasing EEG power of the target frequency from the user's visual area. BCI user's cognitive state changes, especially in mental focus state or lost-in-thought state, will affect the BCI performance in sustained usage of SSVEP. Therefore, how to differentiate BCI users' physiological state through exploring their neural activities changes while performing SSVEP is a key technology for enhancing the BCI performance. In this study, we designed a new BCI experiment which combined working memory task into the flashing targets of SSVEP task using 12 Hz or 30 Hz frequencies. Through exploring the EEG activity changes corresponding to the working memory and SSVEP task performance, we can recognize if the user's cognitive state is in mental focus or lost-in-thought. Experiment results show that the delta (1-4 Hz), theta (4-7 Hz), and beta (13-30 Hz) EEG activities increased more in mental focus than in lost-in-thought state at the frontal lobe. In addition, the powers of the delta (1-4 Hz), alpha (8-12 Hz), and beta (13-30 Hz) bands increased more in mental focus in comparison with the lost-in-thought state at the occipital lobe. In addition, the average classification performance across subjects for the KNN and the Bayesian network classifiers were observed as 77% to 80%. These results show how mental state changes affect the performance of BCI users. In this work, we developed a new scenario to recognize the user's cognitive state during performing BCI tasks. These findings can be used as the novel neural markers in future BCI developments.

Keywords: brain–computer interface (BCI); electroencephalography (EEG); lost-in-thought state; mental focus state; steady-state visual evoked potential (SSVEP); working memory.


Conflict of interest statement

The authors declare no conflict of interest.

Figures

Figure 1
Figure 1
Experimental setup used for steady-state visual evoked potential (SSVEP), working memory, and distraction tasks. In this experiment working memory images, SSVEP flashing frequencies at 12 Hz and 30 Hz, and distraction letters were used as stimuli. In this scenario, all participants were instructed to look at the center of the screen and perform SSVEP-BCI task. This experiment was designed to recognize the brain dynamics of mental focus and lost-in-thought states.
Figure 2
Figure 2
The demonstration of working memory images was used to recognize the state of human mental focus. In the working memory task, a sequence of images was presented one by one on a computer screen. The duration of each image appeared was 1 s. Each subject was instructed to memorize images in the correct order. The three images were presented as question memory images, three other images were used as the response image. This sequence was presented repeatedly. All participants were instructed to identify the correct image in the work memory task.
Figure 3
Figure 3
Flowchart of EEG analysis during mental focus and lost-in-thought states.
Figure 4
Figure 4
(A) Displays electrodes (F3, Fz, F4) location in frontal lobe. (B) The event-related spectral perturbation (ERSP) was observed during mental focus and lost-in-thought states at 12 Hz SSVEP flicker frequency. The pink vertical line shows the stimulus onset. Statistic at p < 0.05. Color bar indicate the scale of significant ERSP in decibel (dB). (C) The power spectral density (PSD) for the mental focus state (red line) and lost-in-thought state (blue line). The grey areas represents statistically pairwise significant difference (p < 0.05) in t-test between mental focus and lost-in-thought states. (D) The area under curve (AUC) was measured in mental focus and lost-in-thought states (* p < 0.05).
Figure 5
Figure 5
(A) Presents F3, Fz, F4 electrodes location in frontal lobe. (B) The ERSP was observed during focus and lost-in-thought states at 30 Hz SSVEP. The pink vertical line display the stimulus onset. Statistic at p < 0.05. Color bar indicate the scale of significant ERSP in decibel (dB). (C) The PSD for the mental focus state (red line) and lost-in-thought state (blue line). The grey areas represents the statistically pairwise significant difference (p < 0.05) in t-tests between focus and lost-in-thought states. (D) The AUC was investigated in mental focus and lost-in-thought states (* p < 0.05).
Figure 6
Figure 6
(A) Shows O1, Oz, O2 electrodes location in occipital lobe. (B) The ERSP was investigated during mental focus and lost-in-thought states at 12 Hz SSVEP. The pink vertical line display the stimulus onset. Statistically significant at p < 0.05. Color bar indicate the scale of significant ERSP in decibel (dB). (C) The PSD for the mental focus state (red line) and lost-in-thought state (blue line). The grey areas presents statistically pairwise significant difference (p < 0.05) in t-tests between the mental focus and lost-in-thought states. (D) The AUC was measured in mental focus and lost-in-thought states (* p < 0.05).
Figure 7
Figure 7
(A) Shows O1, Oz, O2 electrodes positions in occipital lobe. (B) The ERSP was investigated in mental focus and lost-in-thought states at 30 Hz SSVEP. The pink vertical line show the stimulus onset. Statistically significant at p < 0.05. Color bar indicate the scale of significant ERSP in decibel (dB). (C) The PSD for the mental focus state (red line) and lost-in-thought state (blue line). The grey areas represent statistically pairwise significant difference (p < 0.05) in t-tests between the mental focus and lost-in-thought states. (D) The AUC was measured in mental focus and lost-in-thought states (* p < 0.05).
Figure 8
Figure 8
The classification outcomes of the Bayesian network and KNN classifier with SSVEP of 12 Hz and 30 Hz at O1 and O2 (occipital lobe). (A) The accuracy (%) of the Bayesian network and KNN classifier using SSVEP of 12 Hz at O1 and O2. (B) The accuracy (%) of the Bayesian network and KNN classifier with SSVEP of 30 Hz at O1 and O2.

Similar articles

Cited by

References

    1. Sarah N.A., Ayman A., Mostafa-Sami M.M. Brain computer interfacing: Applications and challenges. Egypt. Inf. J. 2015;16:213–230.
    1. Tong J., Lin Q., Xiao R., Ding L. Combining multiple features for error detection and its application in brain-computer interface. Biomed. Eng. Online. 2016:15–17. doi: 10.1186/s12938-016-0134-9. - DOI - PMC - PubMed
    1. Galloway N.R. Human brain electrophysiology: Evoked-potentials and evoked magnetic-fields in science and medicine. Br. J. Ophthalmol. 1990;74:255. doi: 10.1136/bjo.74.4.255-a. - DOI
    1. Regan D. Steady-state evoked potentials. J. Opt. Soc. Am. 1977;67:1475–1489. doi: 10.1364/JOSA.67.001475. - DOI - PubMed
    1. Richard B.S., Mark A.S., Andrew P., Joseph C., Stephen R.W., David G.S. Steady-state visually evoked potential topography associated with a visual vigilance task. Brain Topogr. 1990;3:337–347. - PubMed

LinkOut - more resources