

Nevirapine Biotransformation Insights: An Integrated In Vitro Approach Unveils the Biocompetence and Glutathiolomic Profile of a Human Hepatocyte-Like Cell 3D Model
- PMID: 32503263
- PMCID: PMC7312429
- DOI: 10.3390/ijms21113998
Nevirapine Biotransformation Insights: An Integrated In Vitro Approach Unveils the Biocompetence and Glutathiolomic Profile of a Human Hepatocyte-Like Cell 3D Model
Abstract
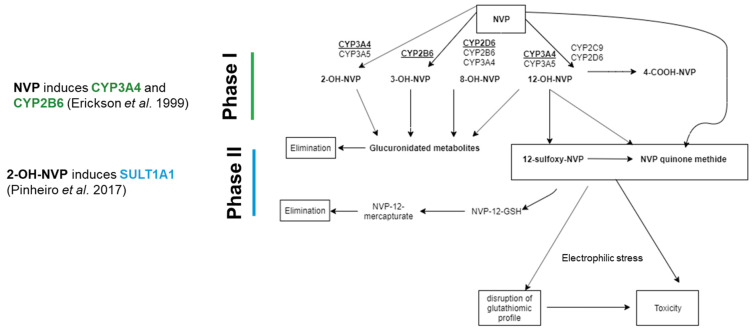
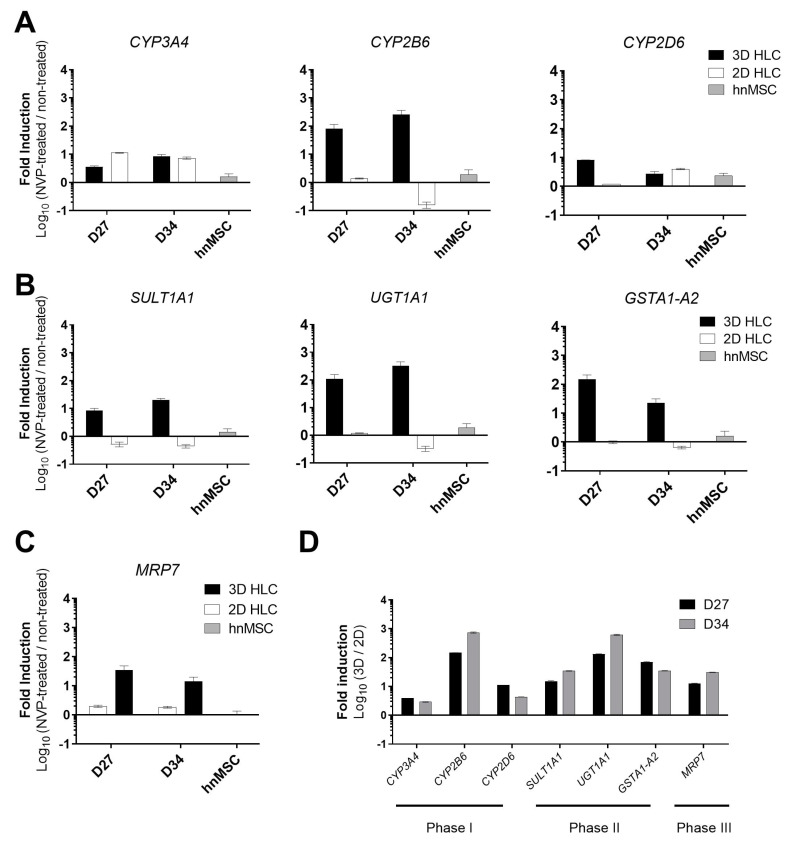
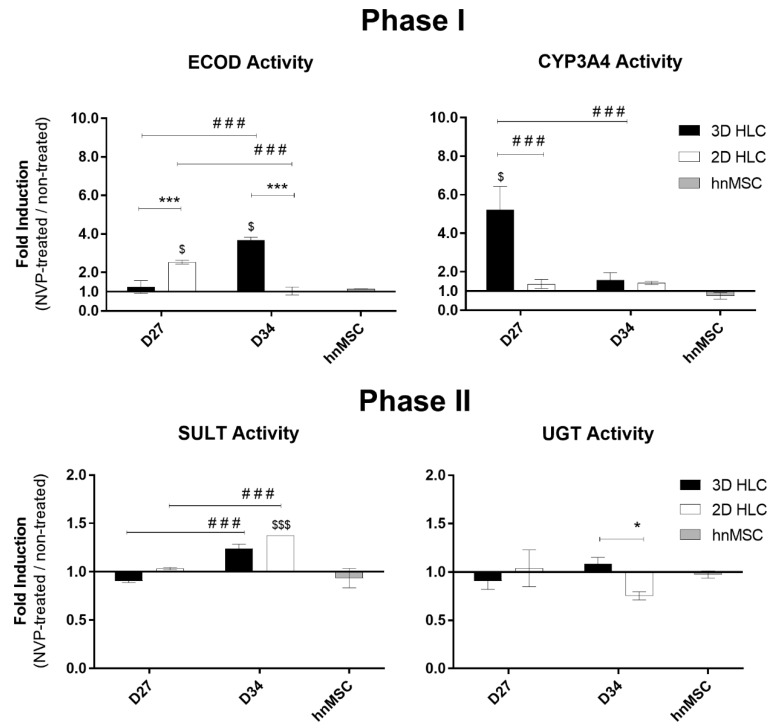
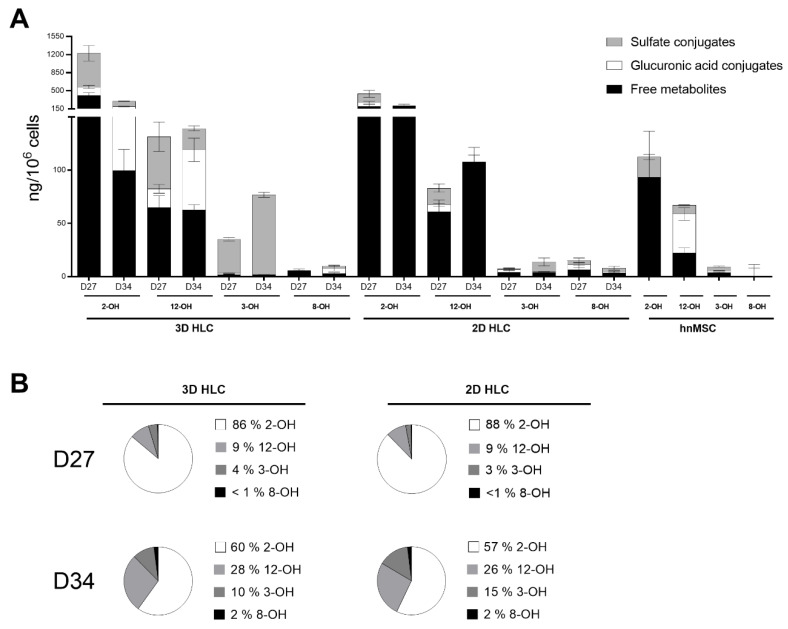
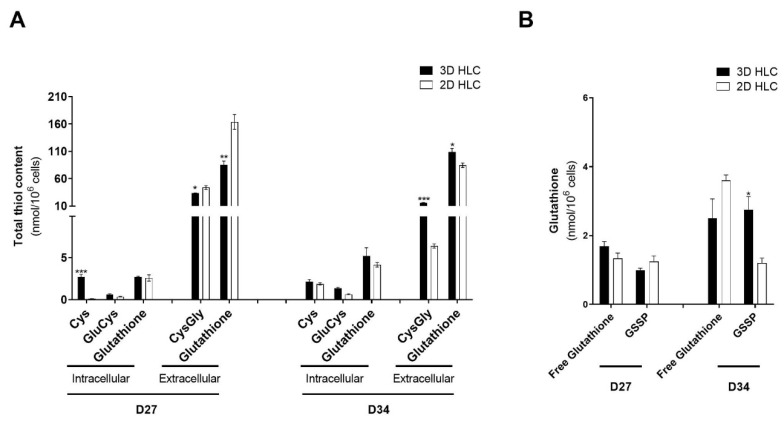
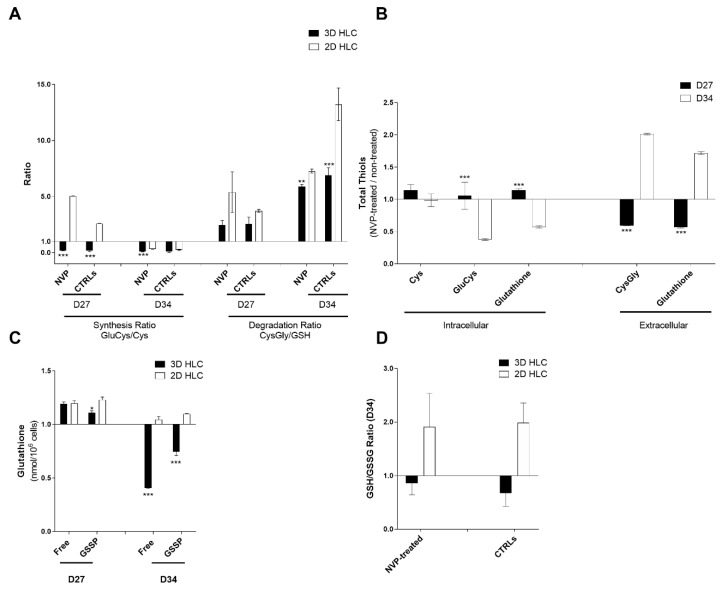
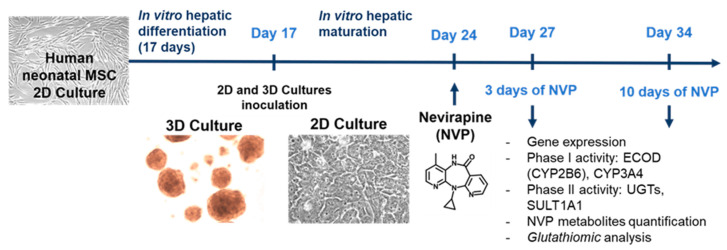
The need for competent in vitro liver models for toxicological assessment persists. The differentiation of stem cells into hepatocyte-like cells (HLC) has been adopted due to its human origin and availability. Our aim was to study the usefulness of an in vitro 3D model of mesenchymal stem cell-derived HLCs. 3D spheroids (3D-HLC) or monolayer (2D-HLC) cultures of HLCs were treated with the hepatotoxic drug nevirapine (NVP) for 3 and 10 days followed by analyses of Phase I and II metabolites, biotransformation enzymes and drug transporters involved in NVP disposition. To ascertain the toxic effects of NVP and its major metabolites, the changes in the glutathione net flux were also investigated. Phase I enzymes were induced in both systems yielding all known correspondent NVP metabolites. However, 3D-HLCs showed higher biocompetence in producing Phase II NVP metabolites and upregulating Phase II enzymes and MRP7. Accordingly, NVP-exposure led to decreased glutathione availability and alterations in the intracellular dynamics disfavoring free reduced glutathione and glutathionylated protein pools. Overall, these results demonstrate the adequacy of the 3D-HLC model for studying the bioactivation/metabolism of NVP representing a further step to unveil toxicity mechanisms associated with glutathione net flux changes.
Keywords: 3D culture; glutathione; hepatocytes; metabolism; nevirapine; stem cells.
Conflict of interest statement
The authors declare no conflict of interest. The funders had no role in the design of the study; in the collection, analyses, or interpretation of data; in the writing of the manuscript, or in the decision to publish the results.
Figures
References
-
- Godoy P., Hewitt N.J., Albrecht U., Andersen M.E., Ansari N., Bhattacharya S., Bode J.G., Bolleyn J., Borner C., Böttger J., et al. Recent advances in 2D and 3D in vitro systems using primary hepatocytes, alternative hepatocyte sources and non-parenchymal liver cells and their use in investigating mechanisms of hepatotoxicity, cell signaling and ADME. Arch. Toxicol. 2013;87:1315–1530. doi: 10.1007/s00204-013-1078-5. - DOI - PMC - PubMed
-
- Zuang V., Dura A., Bofill D.A., Barroso J.F.V., Leite S.B., Belz S., Berggren E., Bernasconi C., Bopp S., Bouhfid M., et al. EURL ECVAM Status Report on the Development, Validation and Regulatory Acceptance of Alternative Methods and Approaches (2018) Publications Office of the EU; Luxembourg: 2019.
-
- Cipriano M., Correia J.C., Camões S.P., Oliveira N.G., Cruz P., Cruz H., Castro M., Ruas J.L., Santos J.M., Miranda J.P. The role of epigenetic modifiers in extended cultures of functional hepatocyte-like cells derived from human neonatal mesenchymal stem cells. Arch. Toxicol. 2017;91:2469–2489. doi: 10.1007/s00204-016-1901-x. - DOI - PubMed
-
- Cipriano M., Freyer N., Knöspel F., Oliveira N.G., Barcia R., Cruz P.E., Cruz H., Castro M., Santos J.M., Zeilinger K., et al. Self-assembled 3D spheroids and hollow-fibre bioreactors improve MSC-derived hepatocyte-like cell maturation in vitro. Arch. Toxicol. 2017;91:1815–1832. doi: 10.1007/s00204-016-1838-0. - DOI - PubMed
MeSH terms
Substances
Grants and funding
LinkOut - more resources
Full Text Sources
