A Machine Vision-Based Method for Monitoring Broiler Chicken Floor Distribution
- PMID: 32503296
- PMCID: PMC7309057
- DOI: 10.3390/s20113179
A Machine Vision-Based Method for Monitoring Broiler Chicken Floor Distribution
Abstract
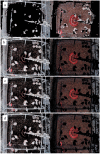
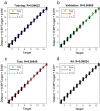
The proper spatial distribution of chickens is an indication of a healthy flock. Routine inspections of broiler chicken floor distribution are done manually in commercial grow-out houses every day, which is labor intensive and time consuming. This task requires an efficient and automatic system that can monitor the chicken's floor distributions. In the current study, a machine vision-based method was developed and tested in an experimental broiler house. For the new method to recognize bird distribution in the images, the pen floor was virtually defined/divided into drinking, feeding, and rest/exercise zones. As broiler chickens grew, the images collected each day were analyzed separately to avoid biases caused by changes of body weight/size over time. About 7000 chicken areas/profiles were extracted from images collected from 18 to 35 days of age to build a BP neural network model for floor distribution analysis, and another 200 images were used to validate the model. The results showed that the identification accuracies of bird distribution in the drinking and feeding zones were 0.9419 and 0.9544, respectively. The correlation coefficient (R), mean square error (MSE), and mean absolute error (MAE) of the BP model were 0.996, 0.038, and 0.178, respectively, in our analysis of broiler distribution. Missed detections were mainly caused by interference with the equipment (e.g., the feeder hanging chain and water line); studies are ongoing to address these issues. This study provides the basis for devising a real-time evaluation tool to detect broiler chicken floor distribution and behavior in commercial facilities.
Keywords: animal behaviors; broiler chicken; health and welfare; precision farming.
Conflict of interest statement
The authors declare that they have no conflicts of interest.
Figures


Similar articles
-
A Machine Vision-Based Method Optimized for Restoring Broiler Chicken Images Occluded by Feeding and Drinking Equipment.Animals (Basel). 2021 Jan 8;11(1):123. doi: 10.3390/ani11010123. Animals (Basel). 2021. PMID: 33429972 Free PMC article.
-
Tracking floor eggs with machine vision in cage-free hen houses.Poult Sci. 2023 Jun;102(6):102637. doi: 10.1016/j.psj.2023.102637. Epub 2023 Mar 9. Poult Sci. 2023. PMID: 37011469 Free PMC article.
-
Sound analysis to model weight of broiler chickens.Poult Sci. 2017 Sep 1;96(11):3938-3943. doi: 10.3382/ps/pex215. Poult Sci. 2017. PMID: 29050436
-
Effects of two different broiler flooring systems on production performances, welfare, and environment under commercial production conditions.Poult Sci. 2017 May 1;96(5):1108-1119. doi: 10.3382/ps/pew440. Poult Sci. 2017. PMID: 28339976
-
Broiler weight estimation based on machine vision and artificial neural network.Br Poult Sci. 2017 Apr;58(2):200-205. doi: 10.1080/00071668.2016.1259530. Epub 2017 Mar 9. Br Poult Sci. 2017. PMID: 27845565
Cited by
-
A Video Mosaicing-Based Sensing Method for Chicken Behavior Recognition on Edge Computing Devices.Sensors (Basel). 2024 May 25;24(11):3409. doi: 10.3390/s24113409. Sensors (Basel). 2024. PMID: 38894200 Free PMC article.
-
A Machine Vision-Based Method Optimized for Restoring Broiler Chicken Images Occluded by Feeding and Drinking Equipment.Animals (Basel). 2021 Jan 8;11(1):123. doi: 10.3390/ani11010123. Animals (Basel). 2021. PMID: 33429972 Free PMC article.
-
Precision Landing Test and Simulation of the Agricultural UAV on Apron.Sensors (Basel). 2020 Jun 14;20(12):3369. doi: 10.3390/s20123369. Sensors (Basel). 2020. PMID: 32545886 Free PMC article.
-
Thermal Image Scanning for the Early Detection of Fever Induced by Highly Pathogenic Avian Influenza Virus Infection in Chickens and Ducks and Its Application in Farms.Front Vet Sci. 2021 May 25;8:616755. doi: 10.3389/fvets.2021.616755. eCollection 2021. Front Vet Sci. 2021. PMID: 34113668 Free PMC article.
-
Automatic analysis of high, medium, and low activities of broilers with heat stress operations via image processing and machine learning.Poult Sci. 2025 Apr;104(4):104954. doi: 10.1016/j.psj.2025.104954. Epub 2025 Feb 27. Poult Sci. 2025. PMID: 40054116 Free PMC article.
References
-
- Wang K.Y., Zhao X.Y., He Y. Review on noninvasive monitoring technology of poultry behavior and physiological information. Trans. Chin. Soc. Agr. Eng. 2017;33:197–209.
-
- Aydin A., Cangar O., Ozcan S.E., Bahr C., Berckmans D. Application of a fully automatic analysis tool to assess the activity of broiler chickens with different gait scores. Comput. Electron. Agr. 2010;73:194–199. doi: 10.1016/j.compag.2010.05.004. - DOI
-
- Porto S.M., Arcidiacono C., Anguzza U., Cascone G. The automatic detection of dairy cow feeding and standing behaviours in free-stall barns by a computer vision-based system. Biosyst. Eng. 2015;133:46–55. doi: 10.1016/j.biosystemseng.2015.02.012. - DOI
MeSH terms
LinkOut - more resources
Full Text Sources
Research Materials

