PS4DR: a multimodal workflow for identification and prioritization of drugs based on pathway signatures
- PMID: 32503412
- PMCID: PMC7275349
- DOI: 10.1186/s12859-020-03568-5
PS4DR: a multimodal workflow for identification and prioritization of drugs based on pathway signatures
Abstract
Background: During the last decade, there has been a surge towards computational drug repositioning owing to constantly increasing -omics data in the biomedical research field. While numerous existing methods focus on the integration of heterogeneous data to propose candidate drugs, it is still challenging to substantiate their results with mechanistic insights of these candidate drugs. Therefore, there is a need for more innovative and efficient methods which can enable better integration of data and knowledge for drug repositioning.
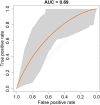
Results: Here, we present a customizable workflow (PS4DR) which not only integrates high-throughput data such as genome-wide association study (GWAS) data and gene expression signatures from disease and drug perturbations but also takes pathway knowledge into consideration to predict drug candidates for repositioning. We have collected and integrated publicly available GWAS data and gene expression signatures for several diseases and hundreds of FDA-approved drugs or those under clinical trial in this study. Additionally, different pathway databases were used for mechanistic knowledge integration in the workflow. Using this systematic consolidation of data and knowledge, the workflow computes pathway signatures that assist in the prediction of new indications for approved and investigational drugs.
Conclusion: We showcase PS4DR with applications demonstrating how this tool can be used for repositioning and identifying new drugs as well as proposing drugs that can simulate disease dysregulations. We were able to validate our workflow by demonstrating its capability to predict FDA-approved drugs for their known indications for several diseases. Further, PS4DR returned many potential drug candidates for repositioning that were backed up by epidemiological evidence extracted from scientific literature. Source code is freely available at https://github.com/ps4dr/ps4dr.
Keywords: Bioinformatics; Drug discovery; Drug repositioning; Multi-omics; Pathways; Software.
Conflict of interest statement
The authors declare that they have no competing interests.
Figures


Similar articles
-
A Systematic Framework for Drug Repositioning from Integrated Omics and Drug Phenotype Profiles Using Pathway-Drug Network.Biomed Res Int. 2016;2016:7147039. doi: 10.1155/2016/7147039. Epub 2016 Dec 26. Biomed Res Int. 2016. PMID: 28127549 Free PMC article.
-
Cogena, a novel tool for co-expressed gene-set enrichment analysis, applied to drug repositioning and drug mode of action discovery.BMC Genomics. 2016 May 27;17:414. doi: 10.1186/s12864-016-2737-8. BMC Genomics. 2016. PMID: 27234029 Free PMC article.
-
Transcriptomic Data Mining and Repurposing for Computational Drug Discovery.Methods Mol Biol. 2019;1903:73-95. doi: 10.1007/978-1-4939-8955-3_5. Methods Mol Biol. 2019. PMID: 30547437
-
In silico drug repositioning: from large-scale transcriptome data to therapeutics.Arch Pharm Res. 2019 Oct;42(10):879-889. doi: 10.1007/s12272-019-01176-3. Epub 2019 Sep 3. Arch Pharm Res. 2019. PMID: 31482491 Review.
-
A Review of Drug Repositioning Based Chemical-induced Cell Line Expression Data.Curr Med Chem. 2020;27(32):5340-5350. doi: 10.2174/0929867325666181101115801. Curr Med Chem. 2020. PMID: 30381060 Review.
Cited by
-
Causal reasoning over knowledge graphs leveraging drug-perturbed and disease-specific transcriptomic signatures for drug discovery.PLoS Comput Biol. 2022 Feb 25;18(2):e1009909. doi: 10.1371/journal.pcbi.1009909. eCollection 2022 Feb. PLoS Comput Biol. 2022. PMID: 35213534 Free PMC article.
-
A data-driven methodology towards evaluating the potential of drug repurposing hypotheses.Comput Struct Biotechnol J. 2021 Aug 9;19:4559-4573. doi: 10.1016/j.csbj.2021.08.003. eCollection 2021. Comput Struct Biotechnol J. 2021. PMID: 34471499 Free PMC article.
-
A Systems Biology Approach for Hypothesizing the Effect of Genetic Variants on Neuroimaging Features in Alzheimer's Disease.J Alzheimers Dis. 2021;80(2):831-840. doi: 10.3233/JAD-201397. J Alzheimers Dis. 2021. PMID: 33554913 Free PMC article.
-
Gene, cell type, and drug prioritization analysis suggest genetic basis for the utility of diuretics in treating Alzheimer disease.HGG Adv. 2023 May 5;4(3):100203. doi: 10.1016/j.xhgg.2023.100203. eCollection 2023 Jul 13. HGG Adv. 2023. PMID: 37250495 Free PMC article.
-
Drug mechanism enrichment analysis improves prioritization of therapeutics for repurposing.BMC Bioinformatics. 2023 May 24;24(1):215. doi: 10.1186/s12859-023-05343-8. BMC Bioinformatics. 2023. PMID: 37226094 Free PMC article.
References
MeSH terms
Substances
Grants and funding
LinkOut - more resources
Full Text Sources
Other Literature Sources
Medical

