

Evolutionary significance of amino acid permease transporters in 17 plants from Chlorophyta to Angiospermae
- PMID: 32503414
- PMCID: PMC7275304
- DOI: 10.1186/s12864-020-6729-3
Evolutionary significance of amino acid permease transporters in 17 plants from Chlorophyta to Angiospermae
Abstract
Background: Nitrogen is an indispensable nutrient for plant growth. It is used and transported in the form of amino acids in living organisms. Transporting amino acids to various parts of plants requires relevant transport proteins, such as amino acid permeases (AAPs), which were our focus in this study.
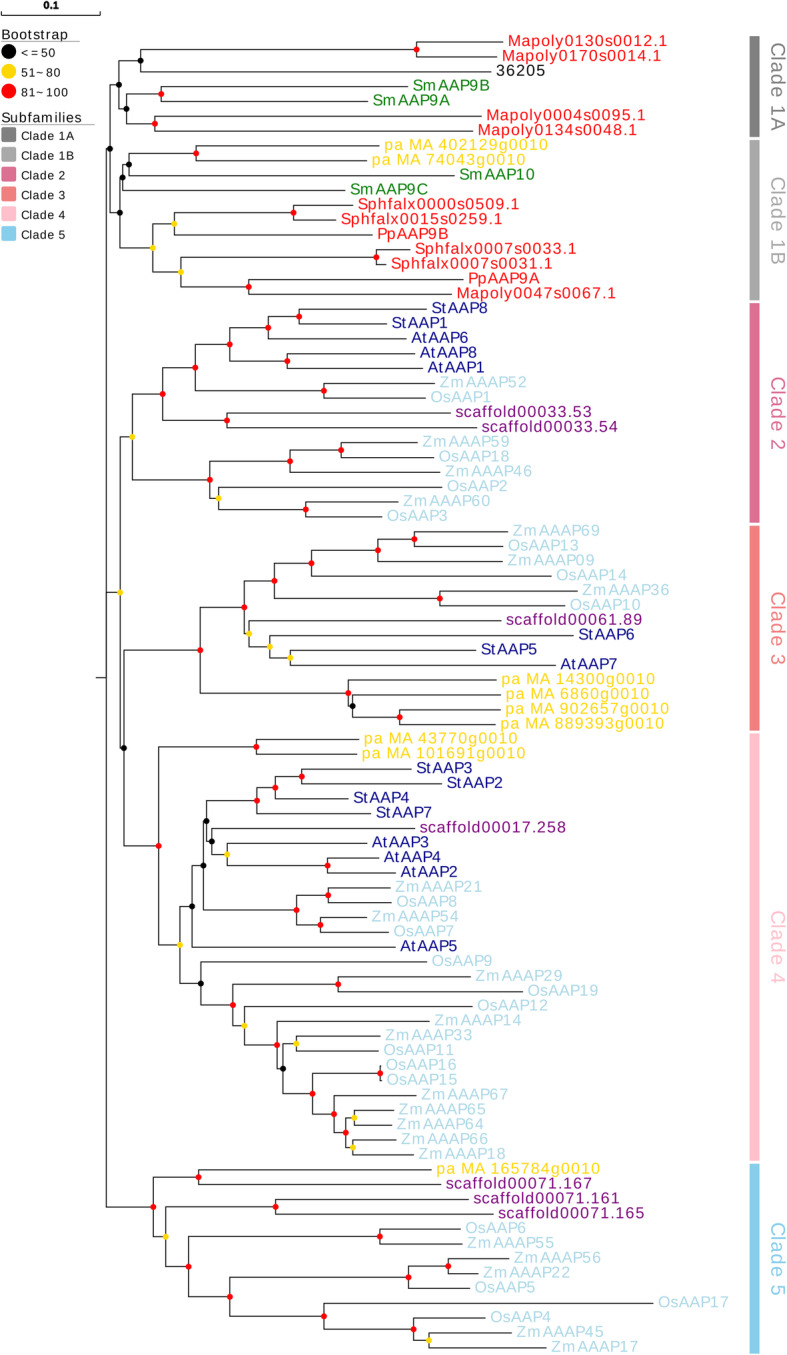
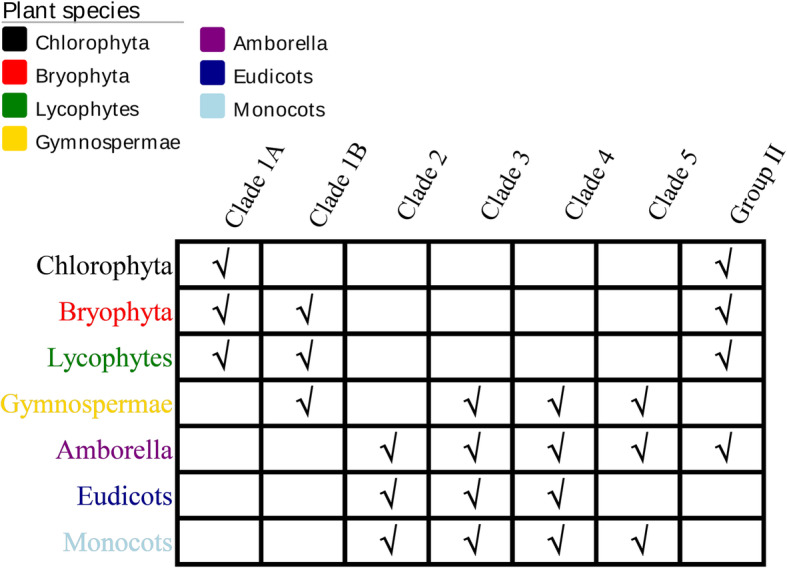
Results: We found that 5 AAP genes were present in Chlorophyte species and more AAP genes were predicted in Bryophyta and Lycophytes. Two main groups were defined and group I comprised 5 clades. Our phylogenetic analysis indicated that the origin of clades 2, 3, and 4 is Gymnospermae and that these clades are closely related. The members of clade 1 included Chlorophyta to Gymnospermae. Group II, as a new branch consisting of non-seed plants, is first proposed in our research. Our results also indicated that the AAP family was already present in Chlorophyta and then expanded accompanying the development of vasculature. Concurrently, the AAP family experienced multiple duplication events that promoted the generation of new functions and differentiation of sub-functions.
Conclusions: Our findings suggest that the AAP gene originated in Chlorophyta, and some non-seed AAP genes clustered in one group. A second group, which contained plants of all evolutionary stages, indicated the evolution of AAPs. These new findings can be used to guide future research.
Keywords: AAP family; Duplication events; Evolution; Phylogenetic analysis; Sequencing plants.
Conflict of interest statement
The authors declare that they have no competing interests.
Figures


Similar articles
-
Evolutionary History of the Glycoside Hydrolase 3 (GH3) Family Based on the Sequenced Genomes of 48 Plants and Identification of Jasmonic Acid-Related GH3 Proteins in Solanum tuberosum.Int J Mol Sci. 2018 Jun 23;19(7):1850. doi: 10.3390/ijms19071850. Int J Mol Sci. 2018. PMID: 29937487 Free PMC article.
-
New insights into the evolution and function of the UMAMIT (USUALLY MULTIPLE ACIDS MOVE IN AND OUT TRANSPORTER) gene family.J Plant Res. 2025 Jan;138(1):3-17. doi: 10.1007/s10265-024-01596-3. Epub 2024 Nov 12. J Plant Res. 2025. PMID: 39531163
-
Genome-wide identification, characterization and expression analysis of the amino acid permease gene family in tea plants (Camellia sinensis).Genomics. 2020 Jul;112(4):2866-2874. doi: 10.1016/j.ygeno.2020.03.026. Epub 2020 Apr 8. Genomics. 2020. PMID: 32276039
-
Comprehensive Review on Plant Cytochrome P450 Evolution: Copy Number, Diversity, and Motif Analysis From Chlorophyta to Dicotyledoneae.Genome Biol Evol. 2024 Nov 1;16(11):evae240. doi: 10.1093/gbe/evae240. Genome Biol Evol. 2024. PMID: 39506518 Free PMC article. Review.
-
The major clades of MADS-box genes and their role in the development and evolution of flowering plants.Mol Phylogenet Evol. 2003 Dec;29(3):464-89. doi: 10.1016/s1055-7903(03)00207-0. Mol Phylogenet Evol. 2003. PMID: 14615187 Review.
Cited by
-
AAAP gene family evolution and transcriptional regulation in Eucalyptus grandis under nitrogen, phosphate and boron deficiencies.BMC Plant Biol. 2025 Jul 4;25(1):879. doi: 10.1186/s12870-025-06907-x. BMC Plant Biol. 2025. PMID: 40615974 Free PMC article.
-
Genome-Wide Identification and Functional Analysis of Lysine Histidine Transporter (LHT) Gene Families in Maize.Genet Res (Camb). 2022 Apr 26;2022:2673748. doi: 10.1155/2022/2673748. eCollection 2022. Genet Res (Camb). 2022. PMID: 35528221 Free PMC article.
-
Evolutionary history of the heat shock protein 90 (Hsp90) family of 43 plants and characterization of Hsp90s in Solanum tuberosum.Mol Biol Rep. 2020 Sep;47(9):6679-6691. doi: 10.1007/s11033-020-05722-x. Epub 2020 Aug 11. Mol Biol Rep. 2020. PMID: 32780253
-
Mapping of quantitative trait loci for the nutritional value of fresh market tomato.Funct Integr Genomics. 2023 Apr 11;23(2):121. doi: 10.1007/s10142-023-01045-9. Funct Integr Genomics. 2023. PMID: 37039853
-
The History of Lentil (Lens culinaris subsp. culinaris) Domestication and Spread as Revealed by Genotyping-by-Sequencing of Wild and Landrace Accessions.Front Plant Sci. 2021 Mar 25;12:628439. doi: 10.3389/fpls.2021.628439. eCollection 2021. Front Plant Sci. 2021. PMID: 33841458 Free PMC article.
References
MeSH terms
Substances
Grants and funding
LinkOut - more resources
Full Text Sources
Miscellaneous
