. 2020 Jun 5;20(1):171.
doi: 10.1186/s12876-020-01288-x.

Identification of novel alternative splicing isoform biomarkers and their association with overall survival in colorectal cancer

Affiliations

Identification of novel alternative splicing isoform biomarkers and their association with overall survival in colorectal cancer

Haifeng Lian et al. BMC Gastroenterol. .

Abstract

Background: Alternative splicing (AS) is an important mechanism of regulating eukaryotic gene expression. Understanding the most common AS events in colorectal cancer (CRC) will help developing diagnostic, prognostic or therapeutic tools in CRC.

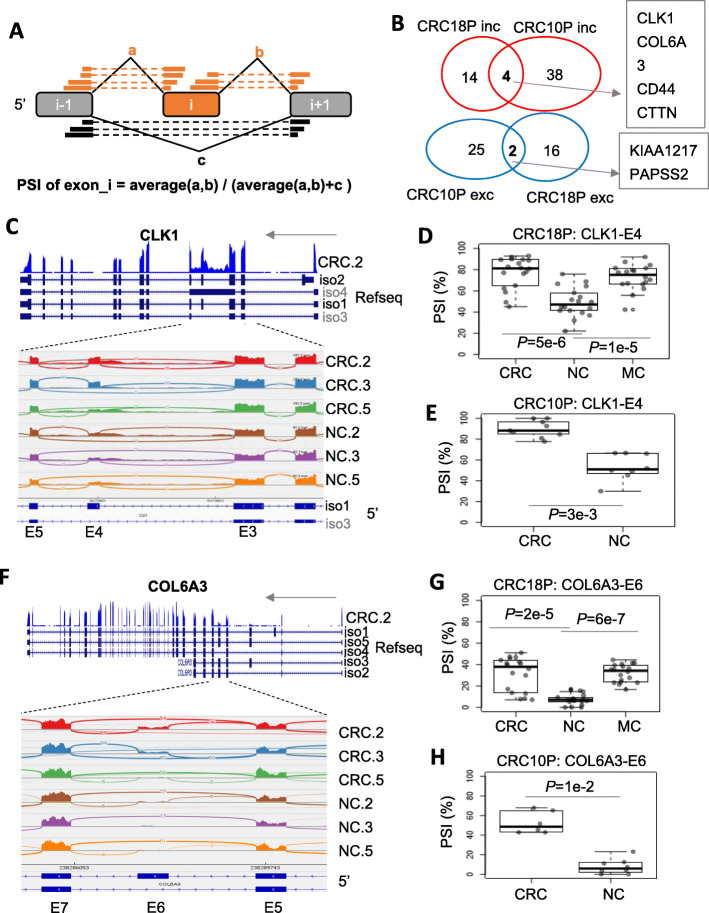
Methods: Publicly available RNA-seq data of 28 pairs of CRC and normal tissues and 18 pairs of metastatic and normal tissues were used to identify AS events using PSI and DEXSeq methods.

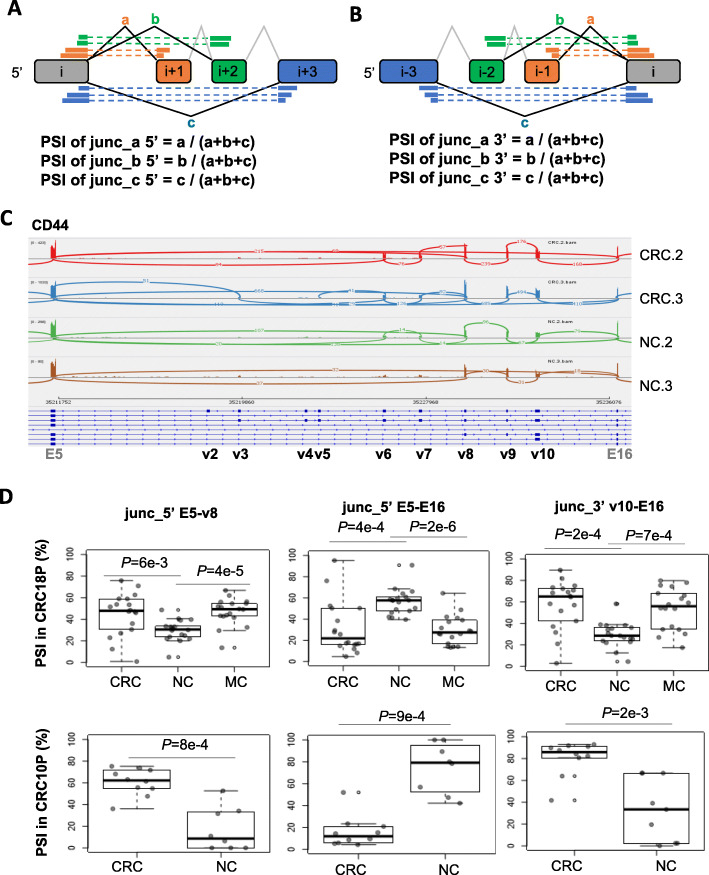
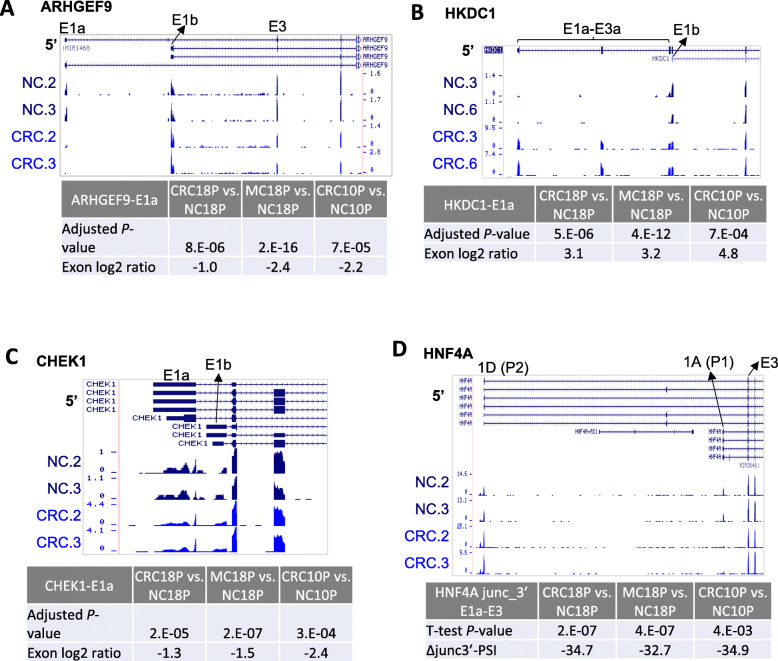
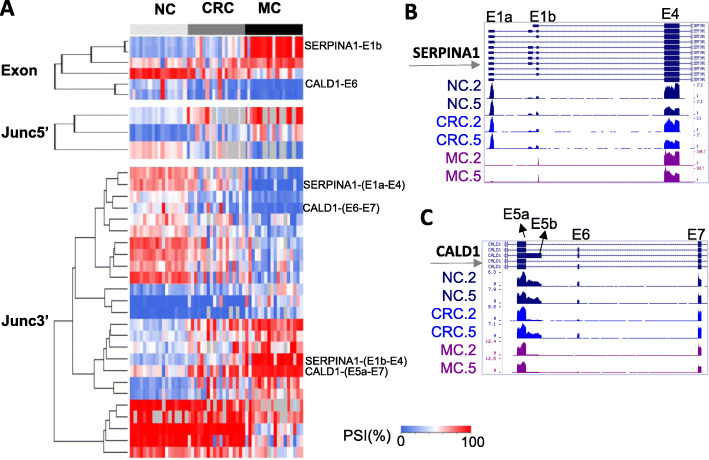
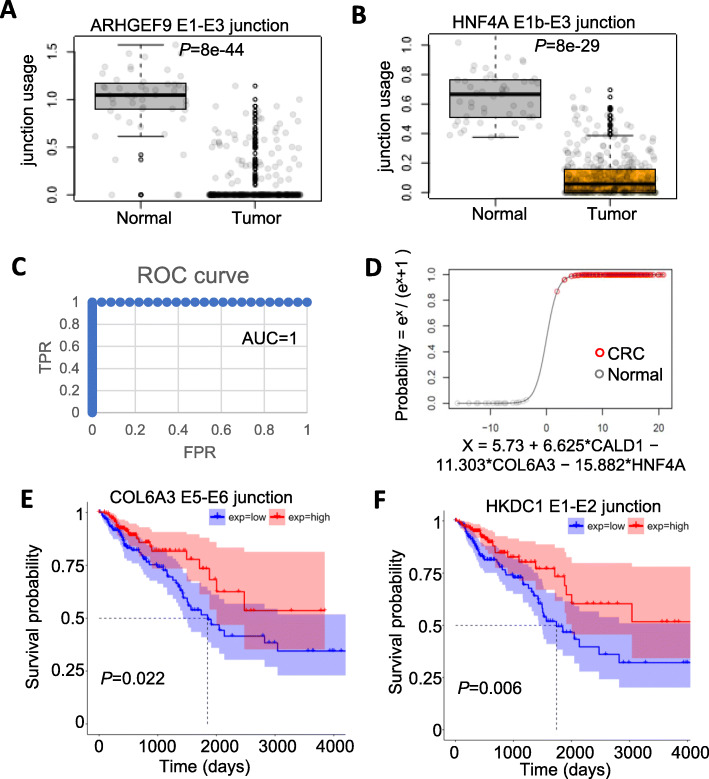
Result: The highly significant splicing events were used to search a database of The Cancer Genome Atlas (TCGA). We identified AS events in 9 genes in CRC (more inclusion of CLK1-E4, COL6A3-E6, CD44v8-10, alternative first exon regulation of ARHGEF9, CHEK1, HKDC1 and HNF4A) or metastasis (decrease of SERPINA1-E1a, CALD-E5b, E6). Except for CHEK1, all other 8 splicing events were confirmed by TCGA data with 382 CRC tumors and 51 normal controls. The combination of three splicing events was used to build a logistic regression model that can predict sample type (CRC or normal) with near perfect performance (AUC = 1). Two splicing events (COL6A3 and HKDC1) were found to be significantly associated with patient overall survival. The AS features of the 9 genes are highly consistent with previous reports and/or relevant to cancer biology.

Conclusions: The significant association of higher expression of the COL6A3 E5-E6 junction and HKDC1 E1-E2 with better overall survival was firstly reported. This study might be of significant value in the future biomarker, prognosis marker and therapeutics development of CRC.

Keywords: Alternative splicing (AS); Colorectal cancer (CRC); Metastasis; RNA-seq; TCGA.


Conflict of interest statement

The authors declare that they have no competing interests.

Figures

Fig. 1
Fig. 1
Cassette exon regulation in CRC. a Diagram of the method to calculate the PSI of an exon. The orange boxes and gray boxes are the alternative exons and neighboring exons. Thick bars connected by a dotted line represent a read cover two exons (junction read). a, b and c are read counts for the three junctions. b Venn diagram showing the overlap of exon splicing events between CRC and NC in CRC18P and CRC10P datasets. P-value of Wilcoxon rank-sum test< 0.05 and |ΔPSI| > 20% were used as cutoffs to select significant events. Inc., exon inclusion in CRC; Exc, exon exclusion in CRC. c CLK1 gene structure (top) and read coverage (Sashimi Plot) for exon 3 to exon 5 region. d Boxplot of PSI of CLK1 exon4 in the CRC18P dataset. Dots in the boxplot represent individual patient data. P-value is based on Wilcoxon rank-sum test. e Similar to (d) except that the CRC10P dataset was shown. f COL6A3 gene structure (top) and read coverage (Sashimi Plot) for exon 5 to exon 7 regions. g Boxplot of PSI of COL6A3 exon6 in the CRC18P dataset. Dots in the boxplot represent individual patient data. P-value is based on Wilcoxon rank-sum test. h Similar to (g) except that the CRC10P dataset was shown
Fig. 2
Fig. 2
CD44v8–10 showed up-regulation in CRC at the expense of other CD44 splicing variants. a Diagram of the method to calculate PSI_junc5’, which represents the usage of a junction among all junctions sharing the same 5’ splice site. The boxes are exons. Thick bars connected by a dotted line represent a read cover two exons (junction read). a, b and c are read counts for the three junctions. b Similar to (a) except that diagram of PSI_junc3’ was shown, which represents the usage of a junction among all junctions sharing the same 3’ splice site. c CD44 gene structure (bottom) and read coverage (Sashimi Plot) for exon 5 to exon 16 regions. d Boxplot of PSI of CD44 junc_5’ E5-v8 (top row), junc_5’ E5-E16 (middle row) and junc_3’ v10-E16 (bottom row) in CRC18P (left column) and CRC10P (right column) datasets. Dots in the boxplot represent individual patient data. P-value is based on Wilcoxon rank-sum test
Fig. 3
Fig. 3
Alternative first exon regulation in CRC. a Read coverage of ARHGEF9 alternative first exons E1a and E1b. The height of the RNA-seq tracks represents the Read Per Million (RPM) values of the read coverage at each genomic location. The adjusted P-value and the log2 ratio (based on DEXSeq) of E1a were shown. b Similar to (a) except that gene HKDC1 was shown. c Similar to (a) except that gene CHEK1 was shown. d Similar to (a) except that gene HNF4A was shown and Wilcoxon rank-sum test P-value and ΔPSI of junc_3’ E1a-E3 was shown
Fig. 4
Fig. 4
Metastasis-related splicing events. a Heat map showing the PSI exon, PSI_junc5’ and PSI_junc3’ values for metastasis-related splicing events. Several exons or junctions were labeled on the right. b-c Read coverage for SERPINA1 alternative first exons (b) and CALD1 E5 to E7 (c)
Fig. 5
Fig. 5
Splicing events validated by TCGA data and potential value in cancer diagnosis and overall survival (OS). a-b Boxplots of junction usage of ARHGEF9 E1-E3 junction (a) and HNF4A E1b-E3 junction (b) in 51 normal tissue and 382 CRC or metastatic tissue (tumor). P-values are based on Wilcoxon rank-sum test adjusted using Bonferroni correction. Dots in the boxplot represent the individual patient in TCGA. c Receiver operating characteristic (ROC) curve of a logistic regression model using junction usages from three genes (CALD1, COL6A3, HNF4A) as predictors and sample type (normal, value = 0 or CRC, value = 1) as the dependent variable. Area Under Curve (AUC) is shown. d Logistic regression curve of the model as shown in C. X axis is the logit (log odds) function. Y axis is the predicted probability of the sample type. Only the testing data (not used in the training process) were used in the plot. The actual sample types were shown as red and gray circles for CRC and normal respectively. e-f Survival curves of 357 patients with overall survival data equally separated into two groups (low and high) based on junction usage of COL6A3 E5-E6 (e) and HKDC1 E1-E2 (f). P-value is based on the log-rank test. Confidence intervals were shown as shaded areas

Similar articles

Cited by

References

    1. Torre LA, Bray F, Siegel RL, Ferlay J, Lortettieulent J, Jemal A. Global cancer statistics, 2012. Ca A Cancer Journal for Clinicians. 2015;65(2):87–108. - PubMed
    1. Wang ET, Sandberg R, Luo S, Khrebtukova I, Zhang L, Mayr C, Kingsmore SF, Schroth GP, Burge CB. Alternative isoform regulation in human tissue transcriptomes. Nature. 2008;456(7221):470–476. - PMC - PubMed
    1. Kim HK, Pham M, Ko KS, Rhee BD, Han J. Alternative splicing isoforms in health and disease. Pflugers Arch. 2018:1–22. - PubMed
    1. Su CH, Dhananjaya D, ., Tarn WY: Alternative splicing in neurogenesis and brain development. Front Mol Biosci 2018, 5. - PMC - PubMed
    1. Urbanski LM, Leclair N, Anczukã3 WO. Alternative-splicing defects in cancer: splicing regulators and their downstream targets, guiding the way to novel cancer therapeutics. Wiley Interdiscip Rev Rna. 2018;9(4):e1476. - PMC - PubMed