

Effects of short- and long-term glucocorticoid-induced osteoporosis on plasma metabolome and lipidome of ovariectomized sheep
- PMID: 32503480
- PMCID: PMC7275480
- DOI: 10.1186/s12891-020-03362-7
Effects of short- and long-term glucocorticoid-induced osteoporosis on plasma metabolome and lipidome of ovariectomized sheep
Erratum in
-
Correction to: Effects of short- and long-term glucocorticoid-induced osteoporosis on plasma metabolome and lipidome of ovariectomized sheep.BMC Musculoskelet Disord. 2020 Jul 29;21(1):501. doi: 10.1186/s12891-020-03485-x. BMC Musculoskelet Disord. 2020. PMID: 32727440 Free PMC article.
Abstract
Background: Understanding the metabolic and lipidomic changes that accompany bone loss in osteoporosis might provide insights about the mechanisms behind molecular changes and facilitate developing new drugs or nutritional strategies for osteoporosis prevention. This study aimed to examine the effects of short- or long-term glucocorticoid-induced osteoporosis on plasma metabolites and lipids of ovariectomized (OVX) sheep.
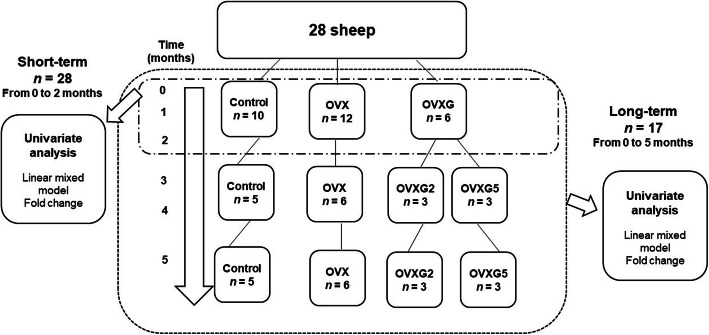
Methods: Twenty-eight aged ewes were divided randomly into four groups: an OVX group, OVX in combination with glucocorticoids for two months (OVXG2), and OVX in combination with five doses of glucocorticoids (OVXG5) to induce bone loss, and a control group. Liquid chromatography-mass spectrometry untargeted metabolomic analysis was applied to monthly plasma samples to follow the progression of osteoporosis over five months.
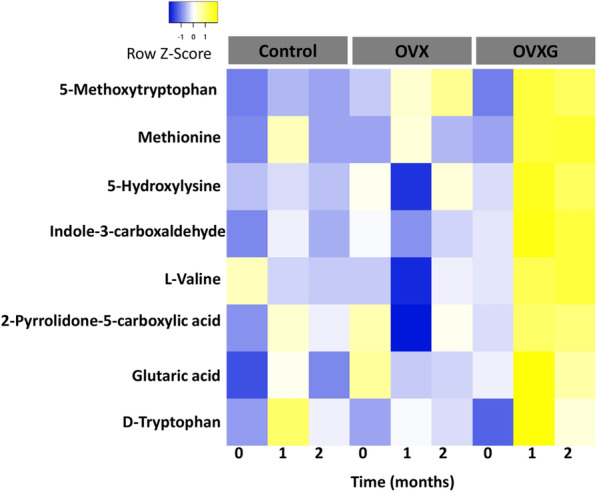
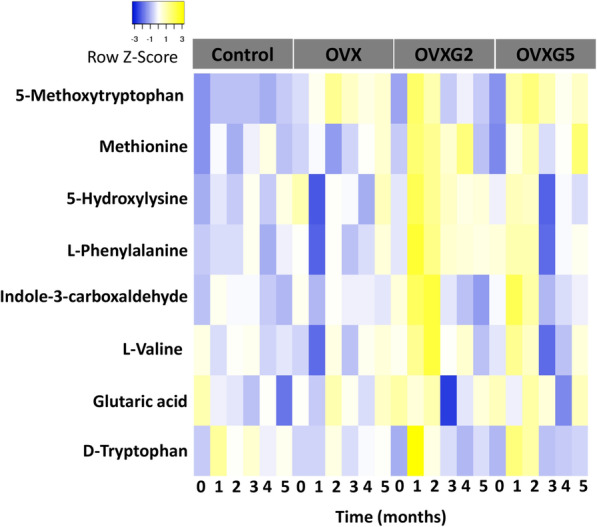
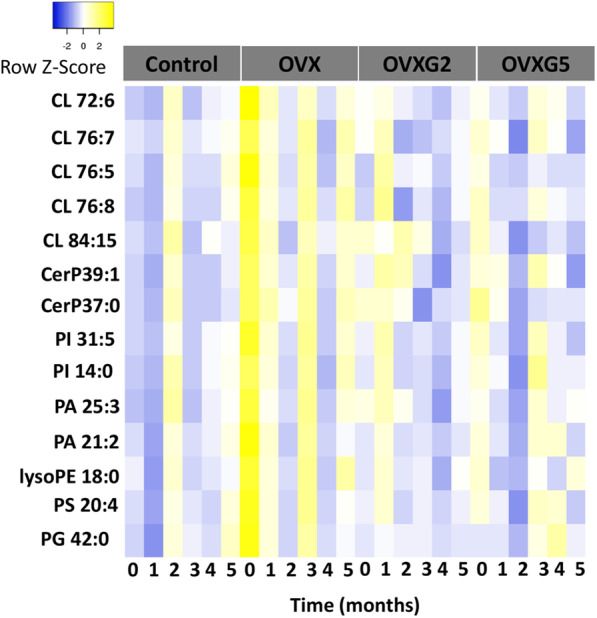
Results: The metabolite profiles revealed significant differences in the plasma metabolome of OVX sheep and OVXG when compared with the control group by univariate analysis. Nine metabolites were altered, namely 5-methoxytryptophan, valine, methionine, tryptophan, glutaric acid, 2-pyrrolidone-5-carboxylic acid, indole-3-carboxaldehyde, 5-hydroxylysine and malic acid. Similarly, fifteen lipids were perturbed from multiple lipid classes such as lysophoslipids, phospholipids and ceramides.
Conclusion: This study showed that OVX and glucocorticoid interventions altered the metabolite and lipid profiles of sheep, suggesting that amino acid and lipid metabolisms are potentially the main perturbed metabolic pathways regulating bone loss in OVX sheep.
Keywords: Lipidome; Metabolome; OVX sheep; Osteoporosis.
Conflict of interest statement
The authors declare that they have no competing interest.
Figures

Similar articles
-
Glucocorticoids affect bone mineral density and bone remodelling in OVX sheep: A pilot study.Bone Rep. 2018 Nov 15;9:173-180. doi: 10.1016/j.bonr.2018.11.001. eCollection 2018 Dec. Bone Rep. 2018. PMID: 30480061 Free PMC article.
-
Glucocorticoid treatment of ovariectomized sheep affects mineral density, structure, and mechanical properties of cancellous bone.J Bone Miner Res. 2003 Nov;18(11):2010-5. doi: 10.1359/jbmr.2003.18.11.2010. J Bone Miner Res. 2003. PMID: 14606514
-
Short-term glucocorticoid treatment causes spinal osteoporosis in ovariectomized rats.Eur Spine J. 2014 Nov;23(11):2437-48. doi: 10.1007/s00586-014-3463-z. Epub 2014 Jul 31. Eur Spine J. 2014. PMID: 25077942
-
In search of an animal model for postmenopausal diseases.Front Biosci. 1998 Apr 16;3:c17-26. doi: 10.2741/a260. Front Biosci. 1998. PMID: 9545440 Review.
-
Glucocorticoid-induced osteoporosis: a review on pathophysiology and treatment options.Minerva Med. 2008 Feb;99(1):23-43. Minerva Med. 2008. PMID: 18299694 Review.
Cited by
-
Application of metabolomics in osteoporosis research.Front Endocrinol (Lausanne). 2022 Nov 14;13:993253. doi: 10.3389/fendo.2022.993253. eCollection 2022. Front Endocrinol (Lausanne). 2022. PMID: 36452325 Free PMC article. Review.
-
Evaluation of trabecular bone microstructure and cortical morphology using cone-beam and micro-CT images: impact of tube voltage setting.BMC Oral Health. 2025 Apr 29;25(1):664. doi: 10.1186/s12903-025-05855-0. BMC Oral Health. 2025. PMID: 40301841 Free PMC article.
-
Adaptation of the infant gut microbiome during the complementary feeding transition.PLoS One. 2022 Jul 14;17(7):e0270213. doi: 10.1371/journal.pone.0270213. eCollection 2022. PLoS One. 2022. PMID: 35834499 Free PMC article.
-
The association between metabolite profiles and impaired bone microstructure in adult growth hormone deficient rats.BMC Musculoskelet Disord. 2024 Nov 6;25(1):883. doi: 10.1186/s12891-024-08010-y. BMC Musculoskelet Disord. 2024. PMID: 39508246 Free PMC article.
-
Linking the relation between gut microbiota and glucocorticoid-induced osteoporosis.J Bone Miner Metab. 2023 Mar;41(2):145-162. doi: 10.1007/s00774-023-01415-0. Epub 2023 Mar 13. J Bone Miner Metab. 2023. PMID: 36912997 Free PMC article. Review.
References
MeSH terms
Substances
Grants and funding
LinkOut - more resources
Full Text Sources
Medical
