. 2020 Jun 5;5(48):eabb1817.
doi: 10.1126/sciimmunol.abb1817.

T cell engagement of cross-presenting microglia protects the brain from a nasal virus infection

Affiliations

T cell engagement of cross-presenting microglia protects the brain from a nasal virus infection

E Ashley Moseman et al. Sci Immunol. .

Abstract

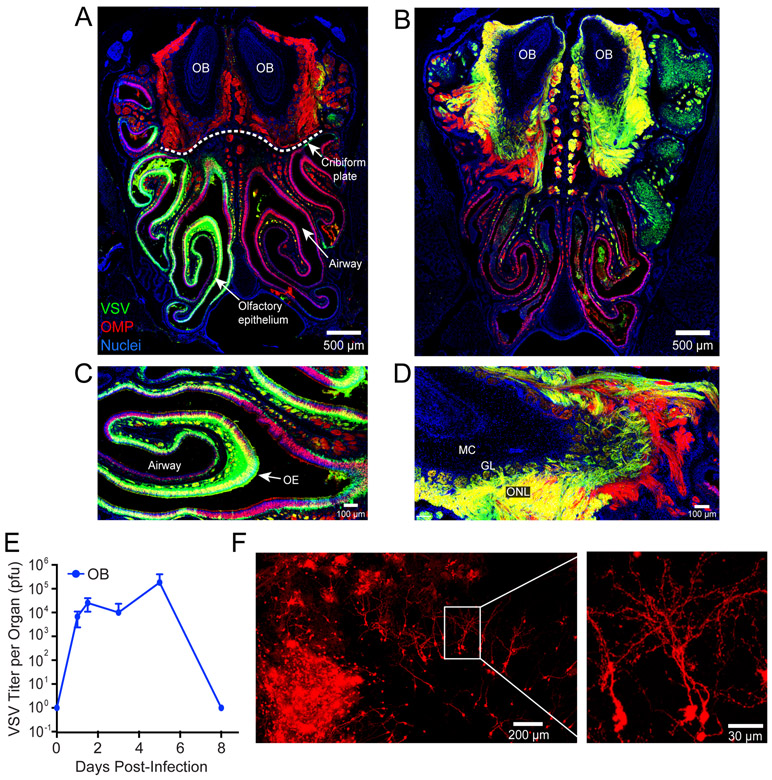
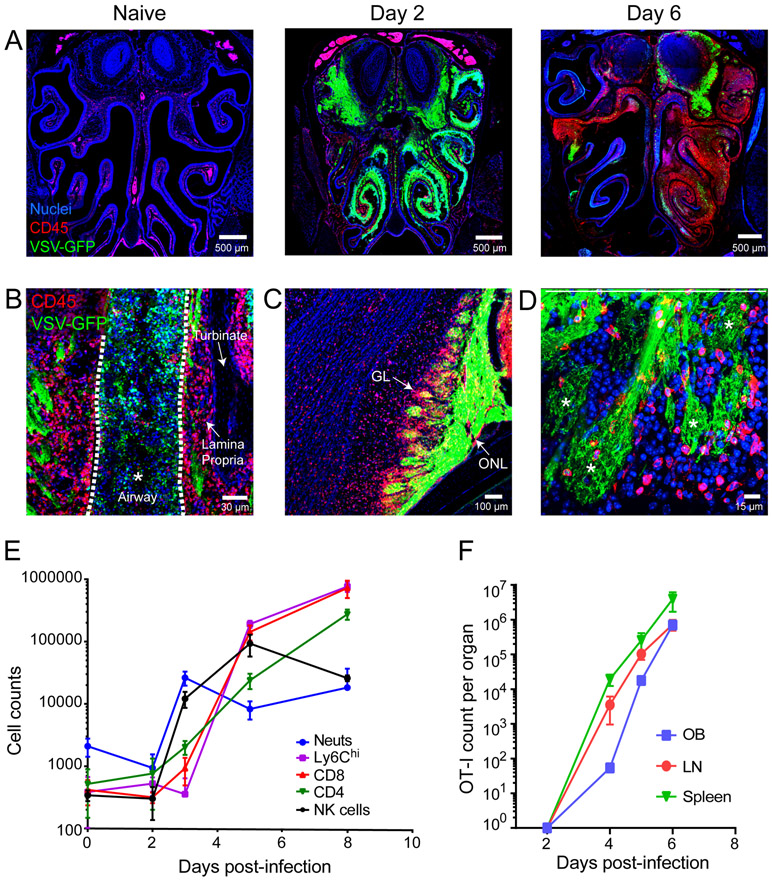
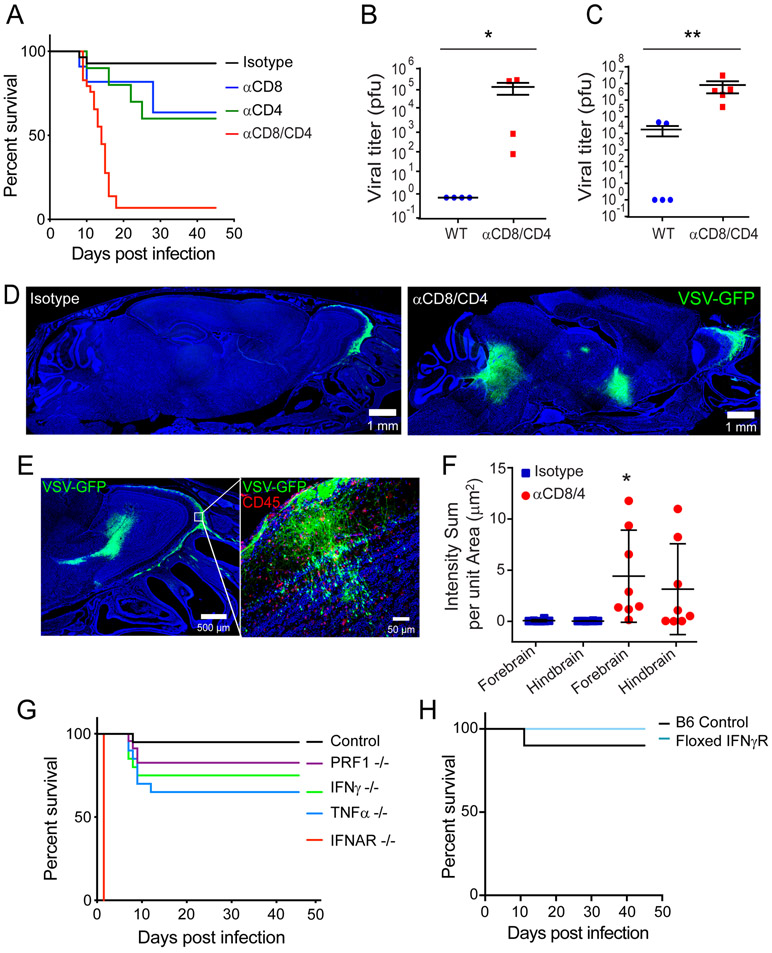
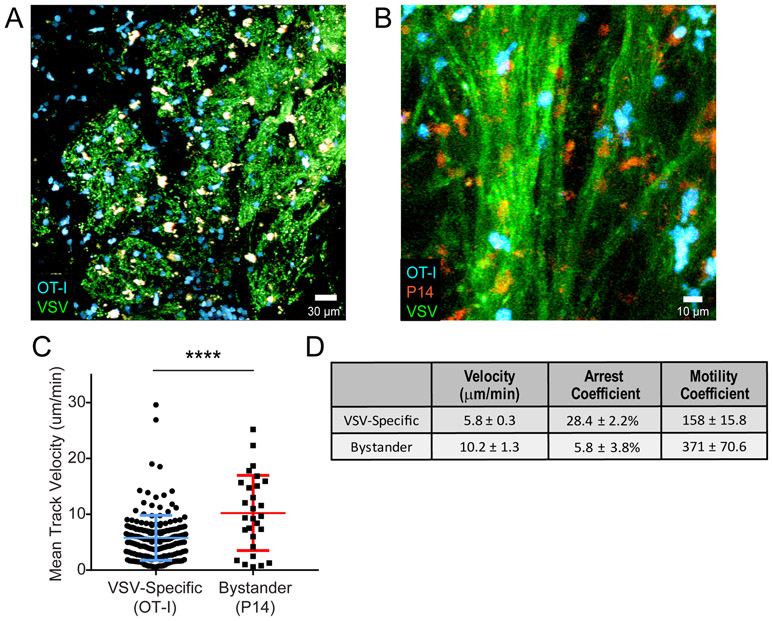
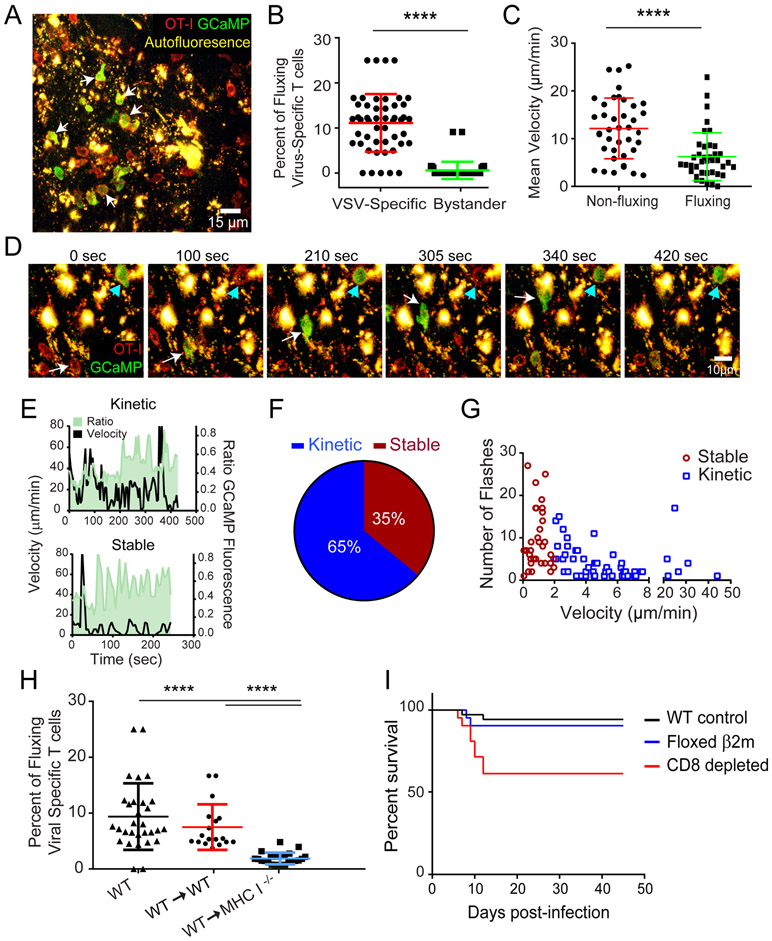
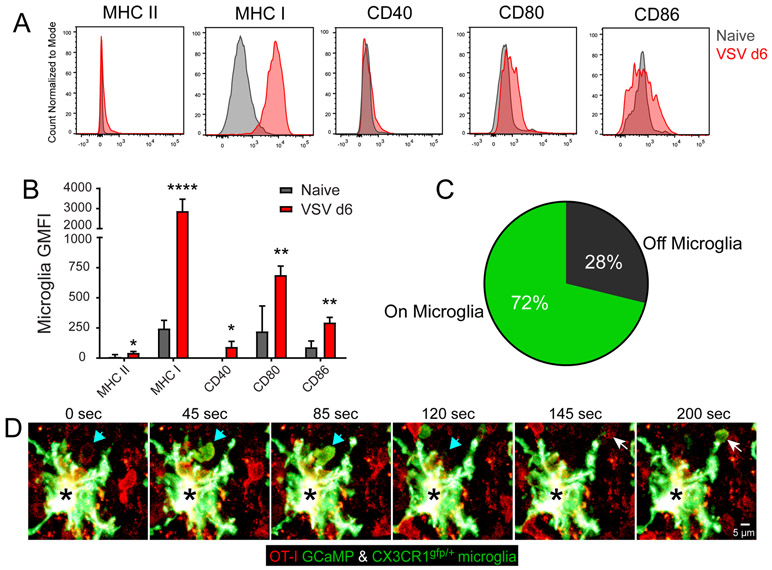
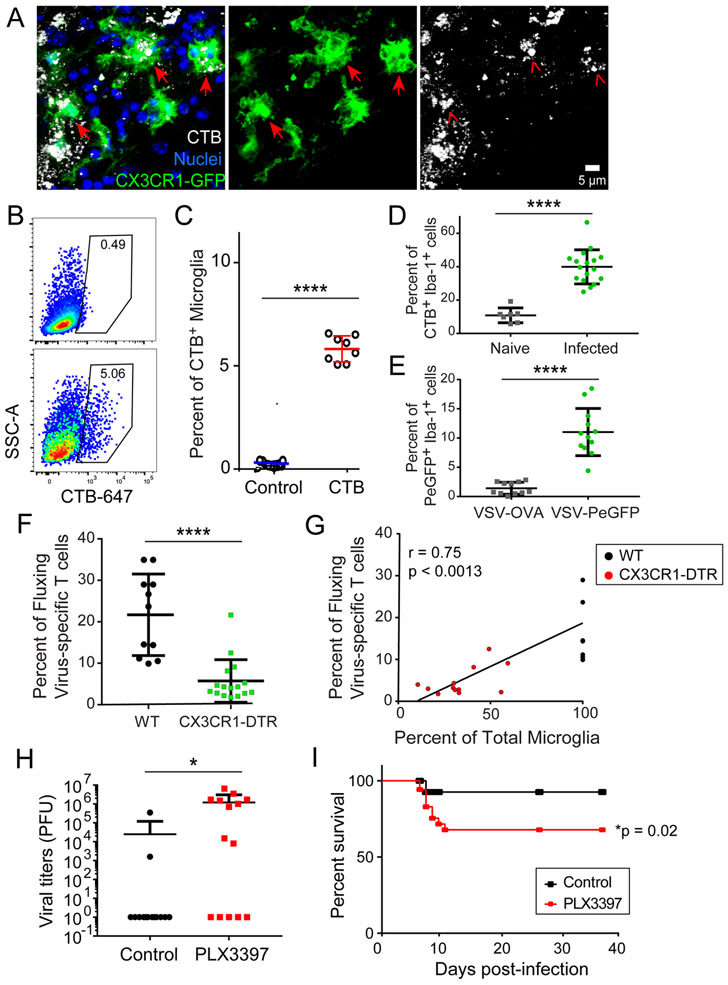
The neuroepithelium is a nasal barrier surface populated by olfactory sensory neurons that detect odorants in the airway and convey this information directly to the brain via axon fibers. This barrier surface is especially vulnerable to infection, yet respiratory infections rarely cause fatal encephalitis, suggesting a highly evolved immunological defense. Here, using a mouse model, we sought to understand the mechanism by which innate and adaptive immune cells thwart neuroinvasion by vesicular stomatitis virus (VSV), a potentially lethal virus that uses olfactory sensory neurons to enter the brain after nasal infection. Fate-mapping studies demonstrated that infected central nervous system (CNS) neurons were cleared noncytolytically, yet specific deletion of major histocompatibility complex class I (MHC I) from these neurons unexpectedly had no effect on viral control. Intravital imaging studies of calcium signaling in virus-specific CD8+ T cells revealed instead that brain-resident microglia were the relevant source of viral peptide-MHC I complexes. Microglia were not infected by the virus but were found to cross-present antigen after acquisition from adjacent neurons. Microglia depletion interfered with T cell calcium signaling and antiviral control in the brain after nasal infection. Collectively, these data demonstrate that microglia provide a front-line defense against a neuroinvasive nasal infection by cross-presenting antigen to antiviral T cells that noncytolytically cleanse neurons. Disruptions in this innate defense likely render the brain susceptible to neurotropic viruses like VSV that attempt to enter the CNS via the nose.


Conflict of interest statement

COMPETING INTERESTS: The authors have no competing interests.

Figures

Figure 1.
Figure 1.. VSV rapidly travels from the nasal turbinates into the OB where it is controlled noncytolytically.
A,B) Representative confocal micrographs of coronal head sections (see Figure S1) show the nasal airway, olfactory epithelium (OE), cribriform plate (dotted white line), and olfactory bulbs (OB) from OMP-GFP mice on days 1 (A) and 6 (B) post-intranasal VSV-DsRed (green) infection (OMP-GFP in red, nuclei shown in blue). C,D) Higher magnification images show the virus invading the OE at day 1 (C) and OB via the outer nerve layer at day 6 (D). Anatomical structures such as the airway, OE, olfactory nerve layer (ONL), glomerular layer (GL), and mitral cell layer (ML) are annotated in these images. E) Time course of viral titers represented as plaque forming units (pfu) per OB following intranasal VSV infection (mean±SD; n=4-5 mice per timepoint; data representative of 3 independent experiments). F) Confocal micrographs of a cleared olfactory bulb from a VSV-iCre infected Stopfl/fl tdTomato reporter mouse 50 days post-intranasal infection.
Figure 2.
Figure 2.. Intranasal VSV infection drives massive immune cell infiltration into the OE and OB.
A) Representative confocal images of coronal head sections (see Figure S1) show the distribution of CD45+ leukocytes (red) in OE / OB uninfected mice relative to day 2 and day 6 post-intranasal VSV-GFP (green) infection. Cell nuclei are shown in blue. B) Confocal micrograph depicting CD45+ infiltration into the VSV-eGFP infected olfactory turbinates 6 days post-infection. Note that the airway space denoted with white asterisk and dotted white lines is filled with cells and virus. C) A confocal micrograph from a day 6 infected OB shows VSV-GFP in the glomerular layer (GL) and outer nerve layer (ONL). D) Confocal micrograph of day6 VSV-eGFP infected OSN terminals. Asterisks denote individual glomeruli within the OB. E) Graph depicts the kinetics of inflammatory cell infiltration into the VSV infected OB. The following markers were used to identify the different immune subsets after first gating on LIVE, CD45+ cells: neutrophils (Ly6Cint, Ly6Ghi, CD11b+), monocytes (Ly6Chi, CD11bhi); NK cells (NK1.1+, TCRβneg), CD4 T cells (TCRβ+, CD4+, CD8), and CD8 T cells (TCRβ+, CD4+, CD8) (mean±SD; n=4-5 mice timepoint; data representative of 3 independent experiments). F) Kinetics of adoptively transferred antigen specific CD8+ OT-I T cell expansion in the OB, draining mandibular and superficial cervical LNs, and spleen after intranasal VSV infection. OT-I cells were defined as LIVE, CD45.1+, CD8+, mTomato+ (mean±SD; n=4-5 mice/timepoint; 2 independent experiments).
Figure 3.
Figure 3.. T cells prevent fatal VSV neuroinvasion after intranasal infection.
A) Survival curves of isotype control, αCD4, αCD8, or αCD8 / αCD4 treated mice following intranasal VSV infection (n=28 mice for isotype; n=10 for αCD4 depleted, p=0.0183; n=11 for αCD8 depleted, p=0.0263; n=31 mice for αCD8/4 depleted, p<0.0001; 2 independent experiments). B, C) Viral titers from the olfactory bulb (B) and remaining cerebrum (C) of isotype control or T cell depleted mice 8 days after intranasal VSV infection (n=4 mice per group; 2 independent experiments; *p=0.0286, **p=0.008). Black lines denote mean±SD. D) Representative confocal micrographs of sagittal brain sections (see Figure S1B) from an isotype control (left panel) or T cell depleted mouse (right panel) 8 days after intranasal VSV-eGFP infection. E) Representative confocal micrographs of viral escape from the glomerular layer within T cell depleted OBs after VSV-eGFP infection. F) Quantification of VSV-eGFP signal in the forebrain and hindbrains of isotype control or T cell depleted animals (n=8 per group; 3 independent experiments; *p=0.02). Black lines denote mean±SD. G) Survival curves for VSV-OVA infected control, antibody treated mice and genetically deficient mouse strains (n=40 mice for control; n=20 for TNFα−/−, p<0.0021; n=9 for IFNAR−/−, p<0.0001; n=20 for IFNγ−/−, p=0.02; n=23 for PRF1−/−; p=0.1039; data are pooled from 6 independent experiments). H) Survival curves for control and floxed IFNγR mice infected intranasally with VSV-iCre (n=10 mice for control; n=9 mice for floxed IFNγR; p=0.3657; 2 independent experiments).
Figure 4.
Figure 4.. Antiviral CTLs exhibit decreased motility within the virally infected OB.
A) Representative image from an intravital imaging experiment depicting adoptively transferred virus-specific OT-I T cells (cyan) within the VSV-GFP (green) infected OB glomerular layer at day 7 post-infection. B) Representative image from a two-photon imaging experiment showing VSV-specific OT-I T cells (blue) and LCMV-specific P14 T-cells (red) traveling along VSV-eGFP (green) infected nerve fibers in the OB outer nerve layer. Mice were co-infected with VSV-eGFP and VSV-OVA for this experiment. C) Mean track velocity of VSV-specific OT-I T cells and LCMV-specific P14 T cells in day 7 VSV-infected OB (n=4 mice; 305 OT-I T cells and 57 P14 T cells; ****p<0.0001). Colored horizontal lines denote mean±SD. D) Motility analysis comparing average track velocities, arrest coefficients and motility coefficients for VSV specific OT-I T cells relative to bystander LCMV-specific P14 T cells within the infected OB at day 7 (from the same experiments as above; n=4 mice; average velocity p<0.0001, arrest coefficient p=0.003, motility coefficient p<0.0001).
Figure 5.
Figure 5.. Antiviral CTL engage antigen on an uninfected CNS resident cell type.
A) A representative image from a two-photon imaging experiment shows OT-I mTomato+ GCaMP6s+ T cells in day 6 VSV-OVA infected OB. B) Calcium flux frequency of VSV-specific OT-I mTomato+ GCaMP6s+ Tcells compared with calcium flux frequency in bystander LCMV-specific P14 mTomato+ GCaMP6s+ T cells within VSV-OVA infected OB (n=4 mice; 6 time periods sampled per mouse; 24 OT-I T cells, 20 P14 T cells; ****p<0.0001). Colored horizontal lines denote mean±SD. C) Mean velocities of calcium fluxing vs. non fluxing OT-I mTomato+ GCaMP6s+ T cells within VSV-OVA infected OB (n=3 mice; 39 OT-I T cells; ****p<0.0001). Colored horizontal lines denote mean±SD. D) A representative time lapse from an intravital imaging experiment shows two different OT-I+ mTomato+ GCaMP6s+ T cells fluxing calcium (green) upon interaction with autofluorescent cells (yellow) within the VSV-OVA infected OB at day 6. The white arrow denotes a T cell engaged in a kinetic fluxing behavior, whereas the cyan arrowhead denotes a stably arrested T cell fluxing calcium. E) Calcium and motility profiles for representative OT-I kinetic (upper panel, velocity of >2μm/min) and stable (lower panel, <2μm/min) interactions. F) Frequency of kinetic and stable calcium flux events in virus-specific OT-I T cells within the OB 6 days after VSV-OVA infection [(n=4 mice; 99 OT-I T cells total: 64 kinetic (>2μm/min) and 35 stable (<2μm/min)]. G) Number of calcium flux events as a function of velocity during kinetic and stable virus-specific OT-I T cells interactions in OB at day 6 (n=4 mice; 99 OT-I T cells total, same as above; p=0.001). H) Calcium flux frequency of OT-I mTomato+ GCaMP6s+ T cells within wild type (WT) non-chimeric, control bone marrow chimeric, and MHC class I deficient bone marrow chimeric mice (n=4 mice; 6 timepoints sampled per movie; ****p<0.0001). Horizontal lines denote mean±SD. I) Survival curves for WT (n=33 mice), floxed β2M (n=19 mice), and αCD8 depleted WT mice (n=13 mice) intranasally infected with VSV-iCre (p=0.0016 for WT vs αCD8, p=0.2825 for WT vs β2M, p=0.0347 floxed β2M vs. αCD8)
Figure 6.
Figure 6.. Microglia elicit antigen specific calcium flux from antiviral CTL.
A) Representative flow cytometric histograms of OB microglia show surface molecule expression 6 days after VSV infection (red) compared with naïve OB microglia (gray). Microglia were defined as Thy1.2- CD11b+ Ly6C- Ly6G- CD45int. B) Quantification of surface molecule geometric mean fluorescent intensity (GMFI) on OB microglia 6 days after VSV infection vs. naïve OB microglia. GFMI data for each surface marker are plotted as the mean±SD after subtracting the isotype control antibody GMFI (n=4 mice per group; 2 independent experiments; *p<0.05, **p<0.01, ****p<0.0001). C) Pie chart representing the frequency of all VSV-specific OT-I T cell calcium flux events observed by two-photon microscopy in contact or not in contact with CX3CR1gfp/+ OB microglia in day 6 post-VSV-OVA infected bone marrow chimeric mice (i.e., CX3CR1gfp/+ mice with C57BL/6J bone marrow) (n=5 mice; 9 movies; 61 time points; 4 independent experiments: p<0.0001). D) A representative time lapse from a two-photon imaging experiment shows an OT-I mTomato+ GCaMP6s+ T cells in a day 6 VSA-OVA infected CX3CR1gfp/+ bone marrow chimera. Arrows (white and cyan) denote two virus-specific OT-I T cells fluxing calcium upon engagement of a single CX3CR1gfp/+ microglia (black asterisk) in the infected OB.
Figure 7.
Figure 7.. Microglia acquire and present antigen from virus-infected neurons to drive protective antiviral CTL responses.
A) Representative confocal micrographs of OB microglia (green) containing fragments of OSNs labeled with cholera toxin B (CTB, white) 10 hours prior to VSV infection. Images were captured at day 6 post-infection. B) Representative FACS plots of microglia (Thy1.2−, Cd11b+, Ly6C/G−, CD45int) from CTB-treated control (top) or day 6 VSV-infected mice (bottom). C) Quantification of CTB containing microglia frequencies. Values are normalized to VSV-infected mice without CTB to control for autofluorescence (7 mice per group; 2 independent experiments; ****p<0.001). Horizontal lines denote mean±SD. D) Frequency of microglia containing CTB within the OB glomerular layer of day 6 VSV infected mice as determined by quantification of confocal images. Values are normalized to VSV-infected mice without CTB to control for autofluorescence (n=4 mice per group; n= 17 fields for day 6, 7 fields for naïve; ****p<0.001). Horizontal lines denote mean±SD. E) Frequency of GFP+ microglia within the OB glomerular layer 6 days after VSV-PeGFP infection as determined by quantification of confocal images. Non-fluorescent VSV-OVA was used as a control (n=3 mice per group; n=12 fields for VSV-PeGFP, n=11 fields for VSV-OVA; ****p<0.0001). Horizontal lines denote mean±SD. F) Intravitally imaged calcium flux frequency of VSV-specific OT-I mTomato+ GCaMP6s+ T cells in wild type (WT) control vs. CX3CR1-CreER x ROSA Stopfl/fl DTR microglia depleted mice on day 6 post-VSV-OVA infection (n=6 control mice per group, 11 movies; n=7 mice microglia depleted mice per group, 16 movies; ****p=<0.001). Horizontal lines denote mean±SD. G) Calcium flux frequency of VSV-specific OT-I mTomato+ GCaMP6s+ T cells in control or CX3CR1-CreER x ROSA Stopfl/fl DTR microglia depleted animals as a function of microglia depletion efficiency (Pearson’s r=0.753, p<0.0013). H) Viral titers in the brains of control vs. PLX3397 treated animals on day 7 post-VSV infection (14 mice per group from 3 pooled independent experiments; *p=0.0265). Horizontal lines denote mean±SD. I) Survival curve for control vs. PLX3397-treated VSV-infected mice (n=36 mice for control; n=35 mice for PLX3397; p=0.0201).

Similar articles

Cited by

References

    1. Swanson PA 2nd, McGavern DB, Viral diseases of the central nervous system. Curr Opin Virol 11, 44–54 (2015). - PMC - PubMed
    1. Tyler KL, Acute Viral Encephalitis. N Engl J Med 379, 557–566 (2018). - PubMed
    1. Forrester JV, McMenamin PG, Dando SJ, CNS infection and immune privilege. Nat Rev Neurosci 19, 655–671 (2018). - PubMed
    1. McGavern DB, Kang SS, Illuminating viral infections in the nervous system. Nat Rev Immunol 11, 318–329 (2011). - PMC - PubMed
    1. Barrios AW, Nunez G, Sanchez Quinteiro P, Salazar I, Anatomy, histochemistry, and immunohistochemistry of the olfactory subsystems in mice. Front Neuroanat 8, 63 (2014). - PMC - PubMed

Publication types