. 2020 Jul 1;40(27):5247-5263.
doi: 10.1523/JNEUROSCI.2238-19.2020. Epub 2020 Jun 5.

Paradoxically Sparse Chemosensory Tuning in Broadly Integrating External Granule Cells in the Mouse Accessory Olfactory Bulb

Affiliations

Paradoxically Sparse Chemosensory Tuning in Broadly Integrating External Granule Cells in the Mouse Accessory Olfactory Bulb

Xingjian Zhang et al. J Neurosci. .

Abstract

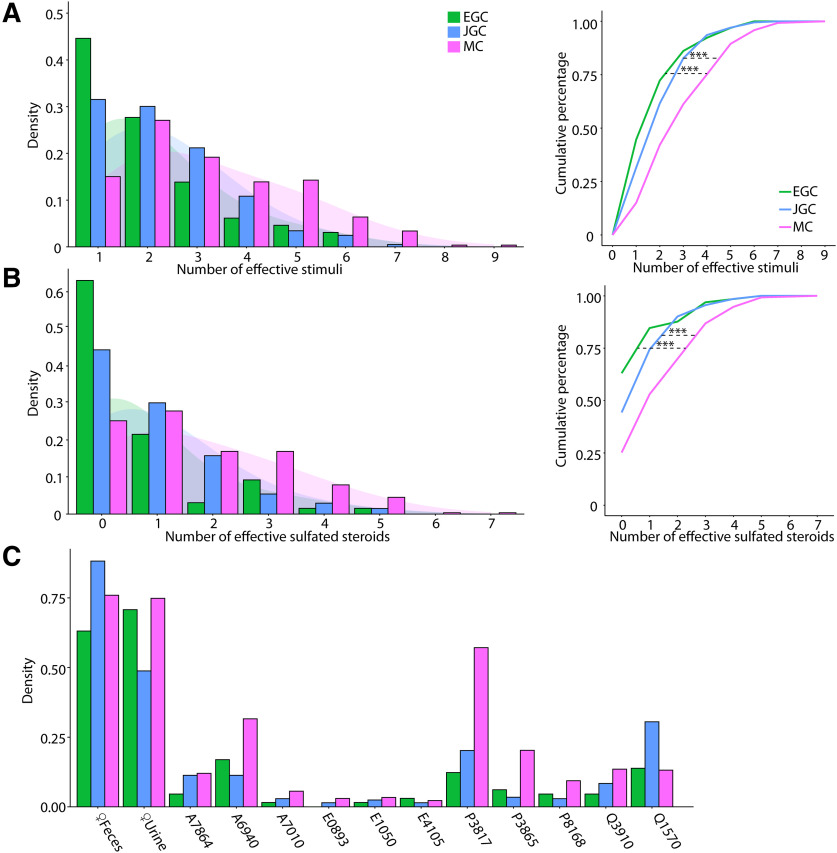
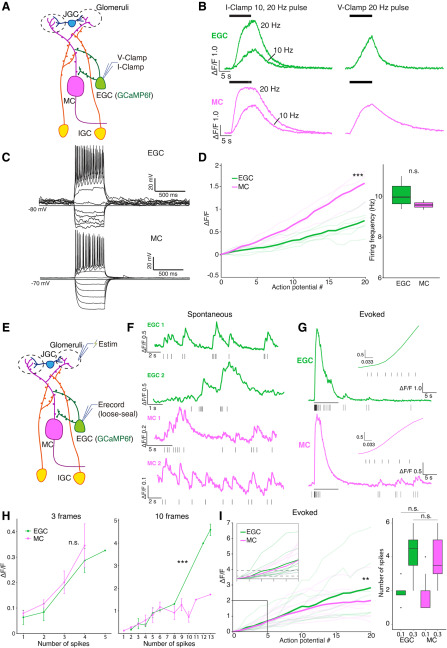
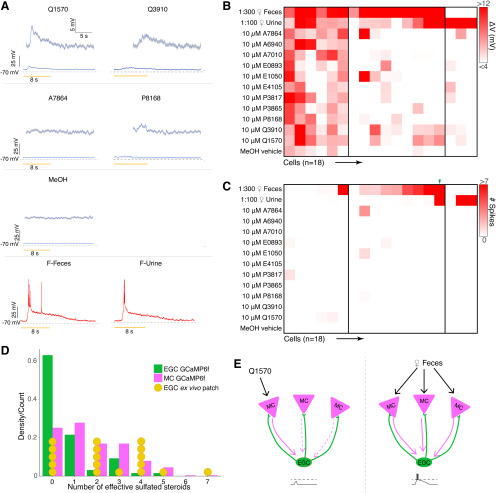
The accessory olfactory bulb (AOB), the first neural circuit in the mouse accessory olfactory system, is critical for interpreting social chemosignals. Despite its importance, AOB information processing is poorly understood compared with the main olfactory bulb (MOB). Here, we sought to fill gaps in the understanding of AOB interneuron function. We used 2-photon GCaMP6f Ca2+ imaging in an ex vivo preparation to study chemosensory tuning in AOB external granule cells (EGCs), interneurons hypothesized to broadly inhibit activity in excitatory mitral cells (MCs). In ex vivo preparations from mice of both sexes, we measured MC and EGC tuning to natural chemosignal blends and monomolecular ligands, finding that EGC tuning was sparser, not broader, than upstream MCs. Simultaneous electrophysiological recording and Ca2+ imaging showed no differences in GCaMP6f-to-spiking relationships in these cell types during simulated sensory stimulation, suggesting that measured EGC sparseness was not due to cell type-dependent variability in GCaMP6f performance. Ex vivo patch-clamp recordings revealed that EGC subthreshold responsivity was far broader than indicated by GCaMP6f Ca2+ imaging, and that monomolecular ligands rarely elicited EGC spiking. These results indicate that EGCs are selectively engaged by chemosensory blends, suggesting different roles for EGCs than analogous interneurons in the MOB.SIGNIFICANCE STATEMENT The mouse accessory olfactory system (AOS) interprets social chemosignals, but we poorly understand AOS information processing. Here, we investigate the functional properties of external granule cells (EGCs), a major class of interneurons in the accessory olfactory bulb (AOB). We hypothesized that EGCs, which are densely innervated by excitatory mitral cells (MCs), would show broad chemosensory tuning, suggesting a role in divisive normalization. Using ex vivo GCaMP6f imaging, we found that EGCs were instead more sparsely tuned than MCs. This was not due to weaker GCaMP6f signaling in EGCs than in MCs. Instead, we found that many MC-activating chemosignals caused only subthreshold EGC responses. This indicates a different role for AOB EGCs compared with analogous cells in the main olfactory bulb.

Keywords: accessory olfactory system; chemical senses; interneuron; olfaction; sensory processing; vomeronasal system.


Figures

Figure 1.
Figure 1.
A, Overview of ex vivo Ca2+ imaging. Left, The stimulus panel delivered to the VNO to drive activity in the AOB. Included are natural ligand blends (1:100 diluted BALB/c mouse urine and 1:300 diluted mouse feces) and 11 monomolecular sulfated steroids at 10 μm. Right, Diagram of AOB circuit. B, Raw images of GCaMP6f fluorescence during ex vivo Ca2+ imaging experiments on AOB MCs. MCs expressed GCaMP6f via the infusion of Cre-dependent AAVs into the AOBs of Pcdh21-Cre transgenic mice ≥3 weeks before the recordings. Numbered regions of interest denote three highlighted MCs with different tuning preferences. Scale bar, 50 μm. C, ΔF/F measurements from the three cells highlighted in B across two randomized repeats. Numbers above the gray vertical bars indicate the stimulus being applied, with colors matched to the stimulus panel in A.
Figure 2.
Figure 2.
Chemosensory tuning of MCs. A, Averaged response traces from an example MC. Traces were smoothed by local polynomial regression fitting. The shaded regions represent 95% confidence intervals. B, Top, Heat map plot of normalized ΔF/F for 266 MCs. Bottom, Binary heat map plot of MC responsiveness; red tiles indicate a stimulus response that passed statistical criteria. C, Left, Histogram showing the number of effective stimuli per cell. Recorded cells are classified into three color-coded groups based on their responsivity. Right, Pie chart showing the composition of recorded MC populations.
Figure 3.
Figure 3.
A, Example GCaMP6f images of the AOB Gad2+ JGCs under chemostimulation. Activated glomeruli are circumscribed by dashed lines. Scale bar, 50 μm. B, Averaged ΔF/F traces for three example JGCs. Traces were smoothed by local polynomial regression fitting. The shaded regions indicate 95% confidence intervals. Colored asterisks indicate the identities of cells in C. C, Top, Heat map of normalized ΔF/F for 203 JGCs. Bottom, Heat map of JGC stimulus responsiveness. Colored arrowheads indicate the recordings presented in B. D, Left, Histogram showing the number of effective stimuli per cell. Recorded cells were classified into three color-coded groups by their selectiveness. Right, Pie chart showing the composition of recorded JGC responsivities.
Figure 4.
Figure 4.
A, AOB Sagittal section from a Cort-T2A-Cre transgenic mouse mated to a Cre-dependent tdTomato reporter line. Scale bar, 200 μm. B, Raw GCaMP6f images from three example EGCs. Scale bar, 10 μm. C, Averaged ΔF/F traces of the three cells shown in B. Traces were smoothed by local polynomial regression fitting. Shaded regions represent 95% confidence intervals. Colored asterisks indicate the identities of cells in D. D, Top, Heat map of normalized ΔF/F for 65 recorded EGCs. Bottom, Binary heat map of EGC stimulus responsiveness; red tiles represent the pairs that passed the statistical criteria. Colored arrowheads indicate the cells and recordings presented in B, C. E, Left, Histogram of EGC responsivity, with tuning classified into three color-coded subgroups. Right, Pie chart of EGC response classes.
Figure 5.
Figure 5.
A, Left, Histograms of the number of effective stimuli for EGCs, JGCs, and MCs. The shaded regions indicate Gaussian kernel densities. Right, Triple asterisks indicate statistically significant differences between groups (EGC vs MC, p = 1.5e-4; EGC vs JGC, p = 0.37; MC vs JGC, p = 4.9e-5, K-S test) B, Same as in A, with dilute urine and feces stimuli excluded. Triple asterisks indicate statistically significant differences between groups (EGC vs MC, p = 6.1e-7; JGC vs MC, p =3.3e-5; EGC vs JGC, p = 0.063, K-S test). C, Percentage of EGCs, JGCs, and MCs that responded to each stimulus in the panel.
Figure 6.
Figure 6.
A, Diagram of the whole-cell patch-clamp setup. B, Example GCaMP6f fluorescence response to artificial current injection in current clamp (I-Clamp, left) and voltage clamp (V-Clamp, right). C, Example responses of EGCs and MCs in response to current injection steps. D, Left, The ΔF/F-number-of-spikes relationship under ∼10 Hz firing. Triple asterisks indicate statistical significance (p = 5.06e-36, main effect of cell type; two-way ANOVA). Right, Firing rate of EGC and MC. n.s.: not statistically significant (Student's t test, p = 0.35). E, Diagram of loose-seal cell-attached recording and glomerular layer stimulation. Estim, Theta glass stimulating electrode; Erecord, loose-seal recording electrode. F, Example loose-seal cell-attached recording traces from two EGCs and two MCs show clear fluorescence increases following single spontaneous spikes. G, Example evoked fluorescence traces of an EGC and an MC. The black bar indicates the stimulation window. The insets are enlarged views of the first ∼0.25 s after stimulation onset. H, ΔF/F at the 3 and 10 frames immediately after the onset of spike 1, plotted against the number of spikes that occurred in this time window. Triple asterisks indicate statistical significance; n.s. indicates lack of statistical significance(3 frames, p = 0.65; 10 frames, p = 2.04e-6, main effect of cell type, two-way ANOVA). I, Left, The ΔF/F-to-spiking relationship measured by loose-seal cell-attached recording. Double asterisk indicates statistical significance (p = 4.1e-3, main effect of cell type, two-way ANOVA). Right, The number of action potentials required to pass ΔF/F = 0.1 (Student's t test, p = 0.91) and ΔF/F = 0.3 (Student's t test, p = 0.66). n.s indicates lack of statistical significance.
Figure 7.
Figure 7.
A, Average voltage traces of an example EGC in the ex vivo preparation during VNO stimulation. Subthreshold responses activities are enlarged in the insets. Q1570, Q3910, and P8168 reliably elicit subthreshold EPSPs. Urine and fecal extracts cause action potentials. B, Heatmap of average voltage changes of 18 recorded EGCs. C, Heatmap of the spiking responses of the same 18 EGCs. D, Comparison between responsiveness measured via Ca2+ imaging and patch clamp. E, Threshold integration model of MC–EGC connectivity.

Similar articles

Cited by

References

    1. Araneda RC, Firestein S (2006) Adrenergic enhancement of inhibitory transmission in the accessory olfactory bulb. J Neurosci 26:3292–3298. 10.1523/JNEUROSCI.4768-05.2006 - DOI - PMC - PubMed
    1. Ben-Shaul Y, Katz LC, Mooney R, Dulac C (2010) In vivo vomeronasal stimulation reveals sensory encoding of conspecific and allospecific cues by the mouse accessory olfactory bulb. Proc Natl Acad Sci U S A 107:5172–5177. 10.1073/pnas.0915147107 - DOI - PMC - PubMed
    1. Bhandawat V, Olsen SR, Gouwens NW, Schlief ML, Wilson RI (2007) Sensory processing in the Drosophila antennal lobe increases reliability and separability of ensemble odor representations. Nat Neurosci 10:1474–1482. 10.1038/nn1976 - DOI - PMC - PubMed
    1. Braganza O, Beck H (2018) The circuit motif as a conceptual tool for multilevel neuroscience. Trends Neurosci 41:128–136. 10.1016/j.tins.2018.01.002 - DOI - PubMed
    1. Brennan PA. (2001) The vomeronasal system. Cell Mol Life Sci 58:546–555. 10.1007/PL00000880 - DOI - PMC - PubMed

Publication types

LinkOut - more resources