. 2020 Jul 15;205(2):502-510.
doi: 10.4049/jimmunol.2000037. Epub 2020 Jun 5.

Depletion of NK Cells Improves Cognitive Function in the Alzheimer Disease Mouse Model

Affiliations

Depletion of NK Cells Improves Cognitive Function in the Alzheimer Disease Mouse Model

Yuanyue Zhang et al. J Immunol. .

Abstract

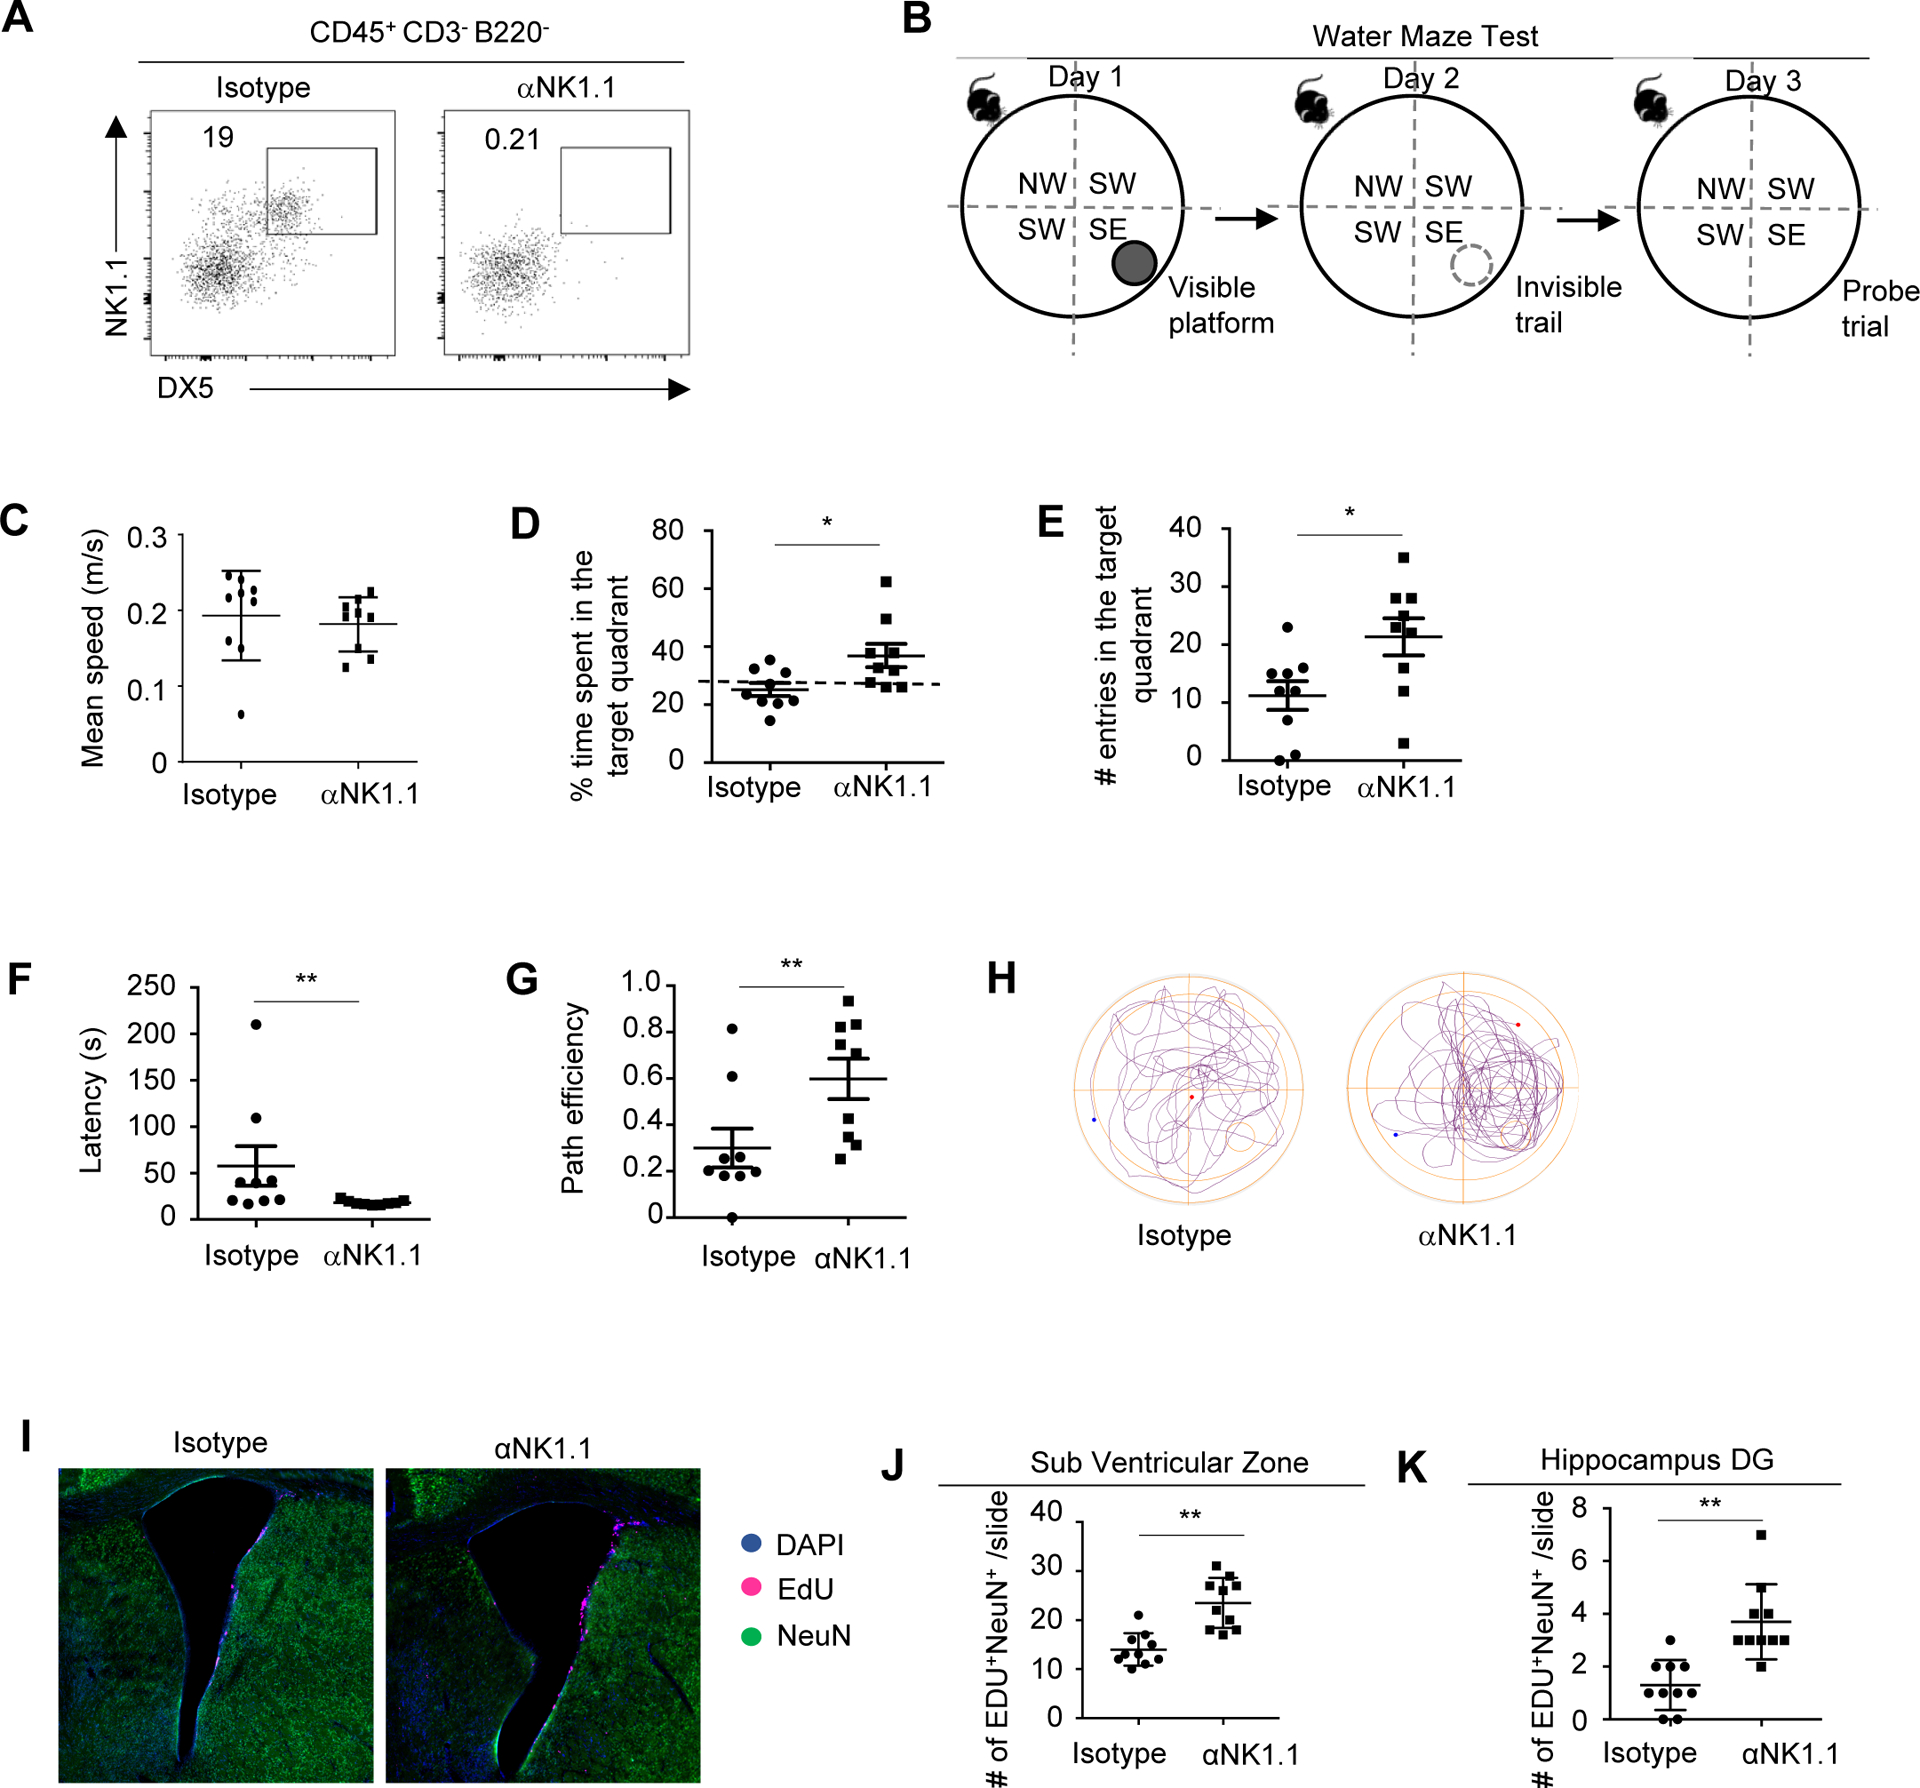
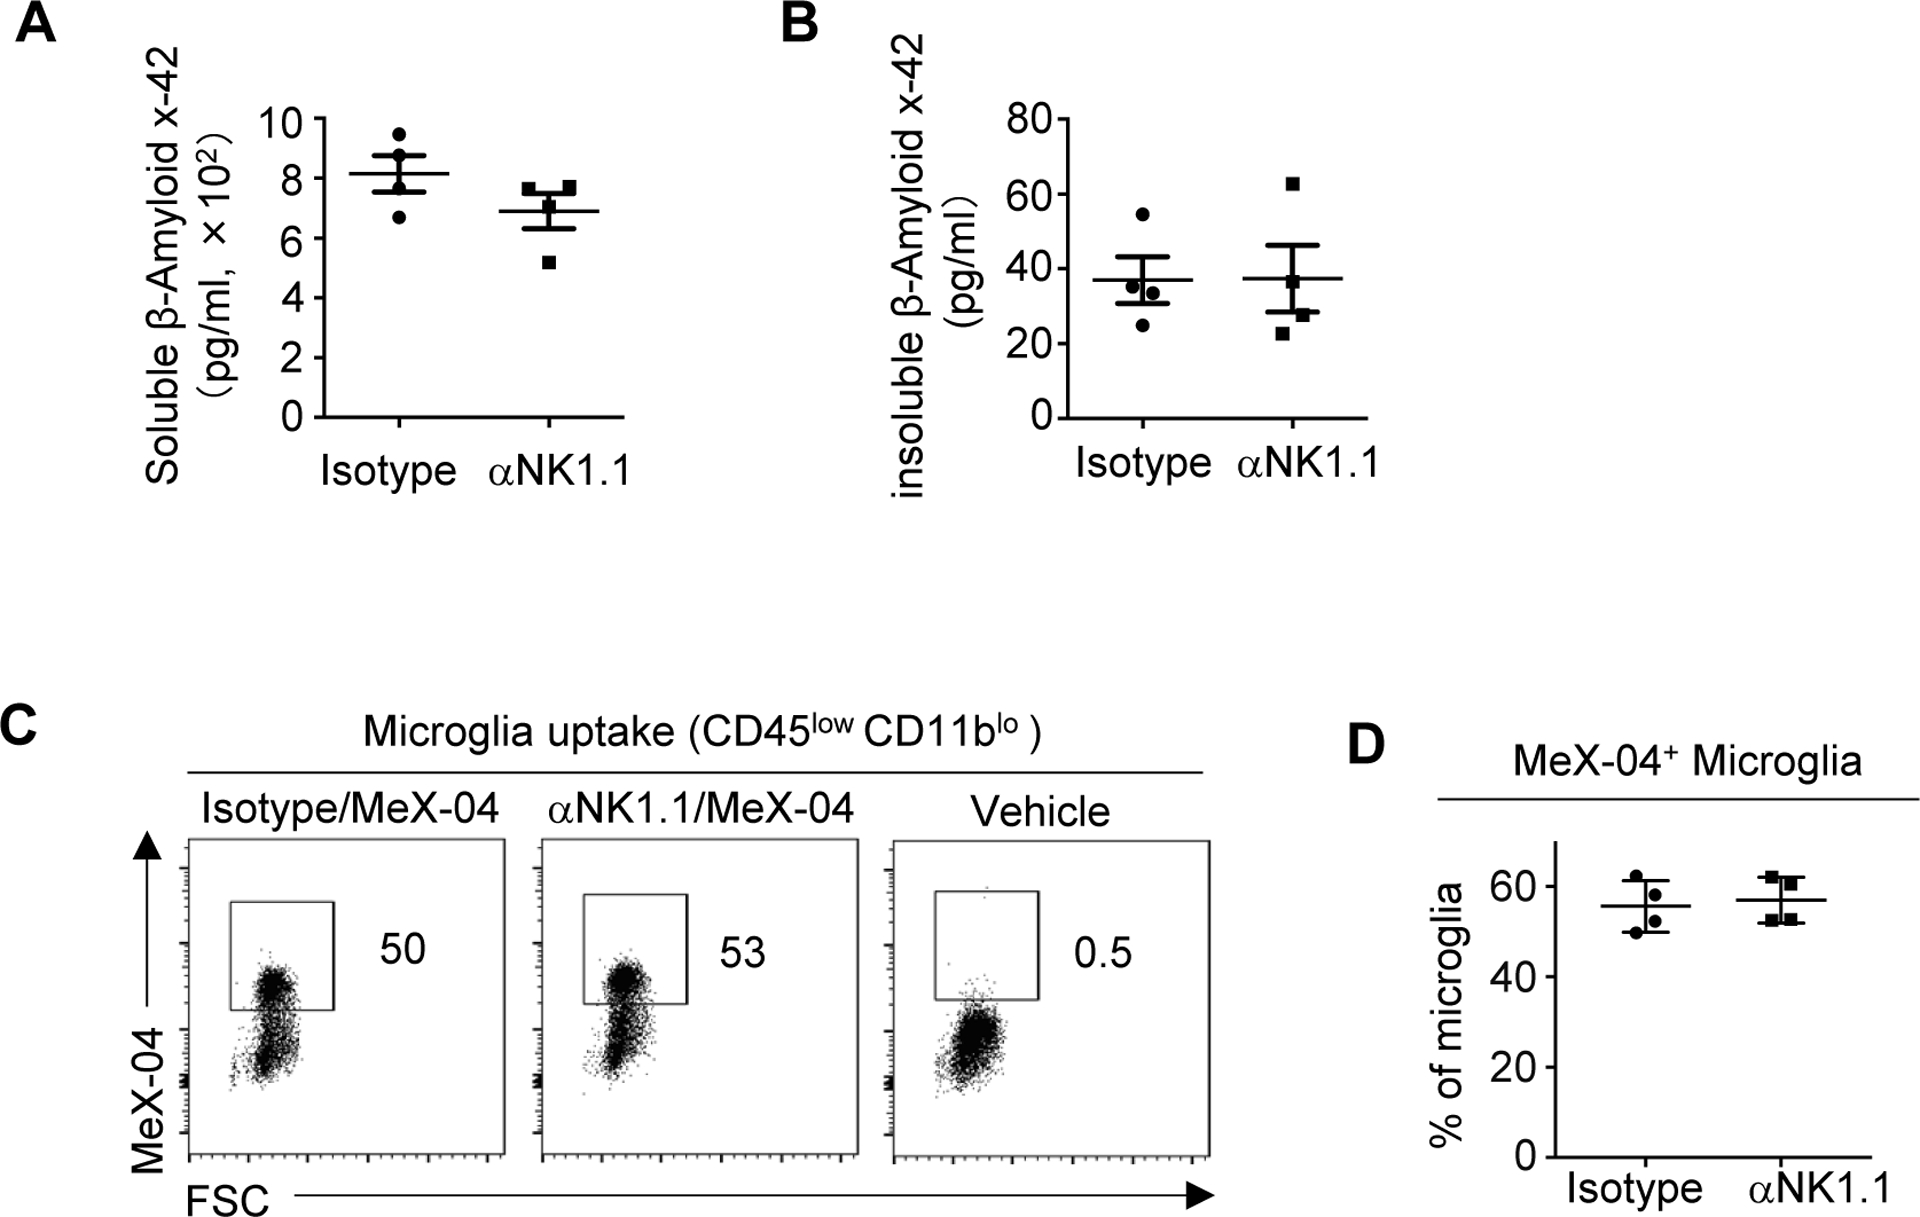
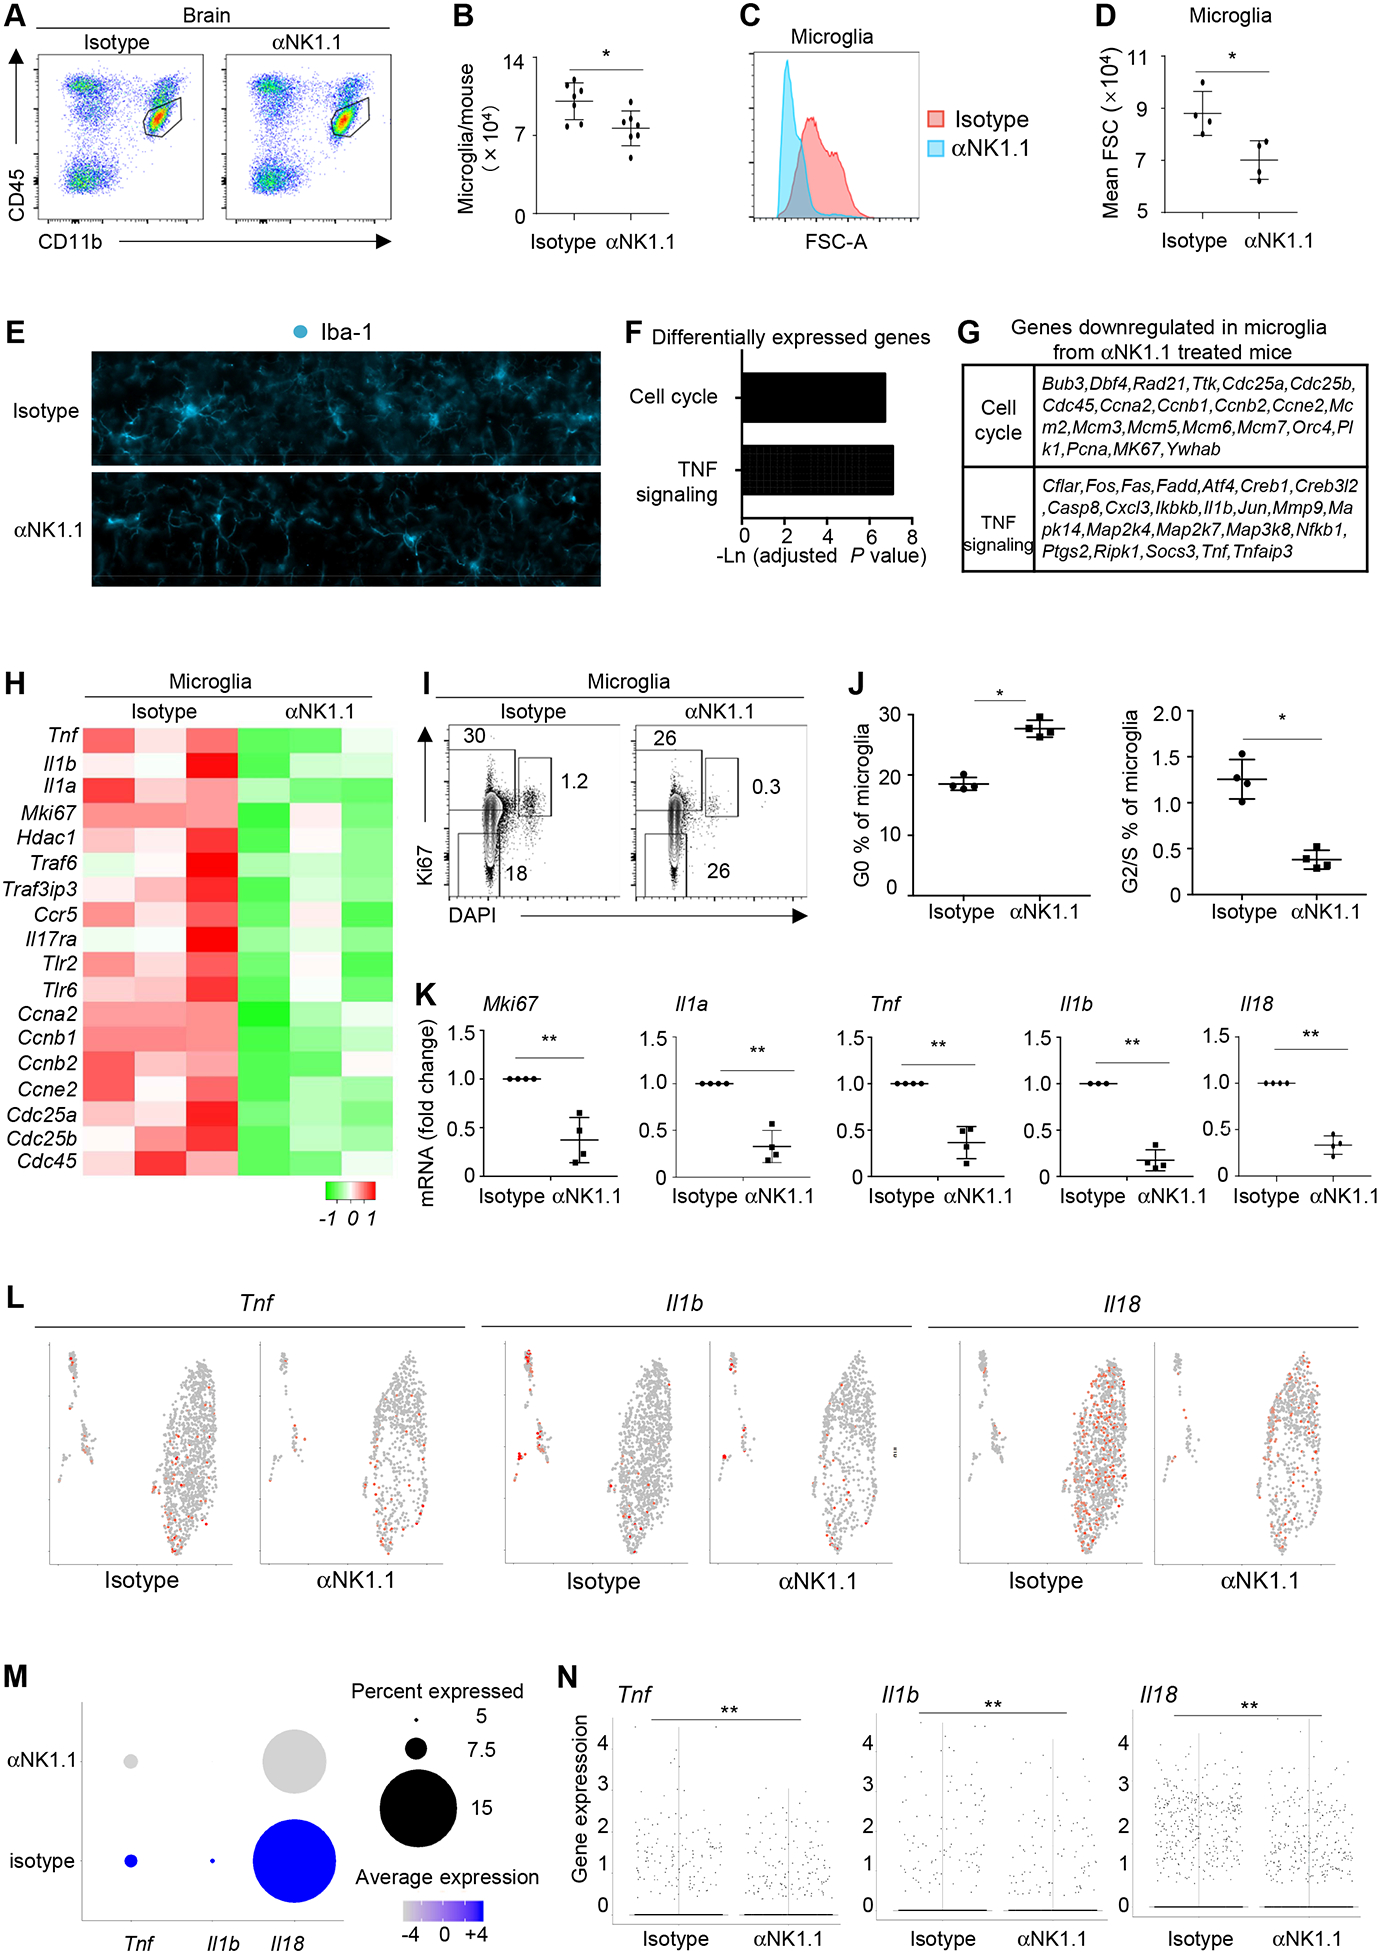
Despite mounting evidence suggesting the involvement of the immune system in regulating brain function, the specific role of immune and inflammatory cells in neurodegenerative diseases remain poorly understood. In this study, we report that depletion of NK cells, a type of innate lymphocytes, alleviates neuroinflammation, stimulates neurogenesis, and improves cognitive function in a triple-transgenic Alzheimer disease (AD) mouse model. NK cells in the brains of triple-transgenic AD mouse model (3xTg-AD) mice exhibited an enhanced proinflammatory profile. Depletion of NK cells by anti-NK1.1 Abs drastically improved cognitive function of 3xTg-AD mice. NK cell depletion did not affect amyloid β concentrations but enhanced neurogenesis and reduced neuroinflammation. Notably, in 3xTg-AD mice depleted of NK cells, microglia demonstrated a homeostatic-like morphology, decreased proliferative response and reduced expression of neurodestructive proinflammatory cytokines. Together, our results suggest a proinflammatory role for NK cells in 3xTg-AD mice and indicate that targeting NK cells might unlock novel strategies to combat AD.


Conflict of interest statement

Dr. Qi Yang reported a patent (U.S. Patent Application No.: 62/822,159). The authors declare no additional conflict of interest.

Figures

Figure 1.
Figure 1.. NK cells in 3xTg-AD mice exhibited an enhanced pro-inflammatory profile.
A, Representative flow cytometry profiles of NK cells in 7–8 months 3xTg-AD and control mice. Plots were pre-gated on brain CD45+CD3B220 lymphocytes. B, Numbers of NK cells in 7–8 months 3xTg-AD and control mice. C, UMAP analysis of sorted NK cells in 7 month old 3xTg-AD and control mice by single-cell RNA-seq (scRNA-seq). D, Expression of individual genes in sorted NK cells by scRNA-seq. E, Pathways of genes highly expressed in NK1AD subset. F, List of presentative genes highly expressed in NK1AD subset. G, Violin plots depicting expression of the indicated genes in each NK cell subsets. H, Expression of the indicated genes in NK1a and NK1b subsets in 3xTg-AD and control mice. Data are from 6 mice per group, pooled from two independent experiments (A and B), or are pooled from 6 mice per group (C-G). *p<0.05; **p<0.01.
Figure 2.
Figure 2.. Depletion of NK cells improved cognitive function in 3xTg-AD mice.
A, Representative flow cytometry profiles of NK cells in 7–8 month old 3xTg-AD mice treated with anti-NK1.1 antibodies or isotype controls. Plots were pre-gated on brain CD45+CD3B220 lymphocytes. B, Experimental scheme of Water Maze Test. C, Mean swimming speed of 7–8 month old 3xTg-AD mice treated with anti-NK1.1 antibodies or isotype controls in the probe trial. D, Time spent in the target quadrant by 3xTg-AD mice treated with anti-NK1.1 antibodies or isotype controls in the probe trial. E, Numbers of entries into the target quadrant in the probe trial. F, Latency to enter the target quadrant in the probe trial. G, Path efficiency of entering the target quadrant in the probe trial. H, Representative path profiles in the probe trial. I. Representative immunofluorescence imaging depicting Edu+ neurons in the SVZ region. J, Numbers of EdU+ neurons in SVZ regions. K. Numbers of EdU+ neurons in hippocampus dentate gyrus regions. DG, dentate gyrus. Data represents 3 independent experiments (A); or are from 9 mice per group and represent two independent experiments (B-H); or from 10 mice per group pooled from two independent experiments (I-K). *p<0.05; **p<0.01.
Figure 3.
Figure 3.. Depletion of NK cells did not affect amyloid beta concentrations.
A, Concentrations of soluble b-amyloid x-42 measured by ELISA in 7–8 month old 3xTg-AD mice injected with MeX-04 and treated with anti-NK1.1 antibodies or isotype controls. B, Concentrations of insoluble b-amyloid x-42 measured by ELISA. C, Presentative flow cytometry profiles depicting uptake of b-amyloid by microglia in 7–8 month old 3xTg-AD mice injected with MeX-04 and treated with anti-NK1.1 antibodies or isotype controls. D, Percentage of MeX-04+ microglia in 7–8 month old 3xTg-AD mice treated with anti-NK1.1 antibodies or isotype controls. Data are from 4 mice per group and represent two independent experiments. *p<0.05; **p<0.01.
Figure 4.
Figure 4.. Depletion of NK cells reduced neuroinflammation.
A, Representative flow cytometry profiles of microglia in 7–8 month old 3xTg-AD mice treated with anti-NK1.1 antibodies or isotype controls. B, Numbers of microglia in 7–8 month old 3xTg-AD mice treated with anti-NK1.1 antibodies or isotype controls. C, Histogram depicting forward scatter-A (FSC-A) of microglia in 7–8 month old 3xTg-AD mice treated with anti-NK1.1 antibodies or isotype controls. D, Mean FSC-A of microglia in 7–8 month old 3xTg-AD mice treated with anti-NK1.1 antibodies or isotype controls. E, Representative immunofluorescence imaging of microglia from 7–8 month old 3xTg-AD mice treated with anti-NK1.1 antibodies or isotype controls. F, RNA-seq was performed with sorted microglia from 7–8 month old 3xTg-AD mice treated with anti-NK1.1 antibodies or isotype controls. Pathways of differentially expressed genes were identified. G, List of representative genes that were down-regulated in microglia from mice treated with anti-NK1.1 antibodies. H, Heatmap of representative genes whose expression is downregulated in microglia from 3xTg-AD mice treated with anti-NK1.1 antibodies. I, Flow cytometry profiles of Ki67 and DAPI staining in microglia from 7–8 month old 3xTg-AD mice treated with anti-NK1.1 antibodies and isotype controls. J, Percentages of microglia in G0 or S/G2 phases. K, Expression of the indicated genes by QPCR. L, scRNA-seq analysis of the indicated genes expressed by microglia from 7–8 month old 3xTg-AD mice treated with anti-NK1.1 antibodies or isotype controls. M, Percentages of microglia that express the indicated genes and the average gene expression by scRNA-seq. N, Violin plots depicting expression of the indicated genes by scRNA-seq. Data are from 7 mice per group, pooled from two independent experiments (A-B), or from 4 mice per group, representative of two independent experiments (C-E, I-J), or from four independent experiments (K), or from 3 mice per group (F-H), or pooled from 4 mice per group (J-M). *p<0.05; **p<0.01.

References

    1. Bradburn S, Murgatroyd C, and Ray N. 2019. Neuroinflammation in mild cognitive impairment and Alzheimer’s disease: A meta-analysis. Ageing Res Rev 50: 1–8. - PubMed
    1. Calsolaro V, and Edison P. 2016. Neuroinflammation in Alzheimer’s disease: Current evidence and future directions. Alzheimers Dement 12: 719–732. - PubMed
    1. Chaney A, Williams SR, and Boutin H. 2019. In vivo molecular imaging of neuroinflammation in Alzheimer’s disease. J Neurochem 149: 438–451. - PMC - PubMed
    1. Regen F, Hellmann-Regen J, Costantini E, and Reale M. 2017. Neuroinflammation and Alzheimer’s Disease: Implications for Microglial Activation. Curr Alzheimer Res 14: 1140–1148. - PubMed
    1. Song WM, and Colonna M. 2018. The identity and function of microglia in neurodegeneration. Nat Immunol 19: 1048–1058. - PubMed

Publication types