. 2020 Jul;31(7):1522-1537.
doi: 10.1681/ASN.2019090956. Epub 2020 Jun 5.

Cell-Based Phenotypic Drug Screening Identifies Luteolin as Candidate Therapeutic for Nephropathic Cystinosis

Affiliations

Cell-Based Phenotypic Drug Screening Identifies Luteolin as Candidate Therapeutic for Nephropathic Cystinosis

Ester De Leo et al. J Am Soc Nephrol. 2020 Jul.

Abstract

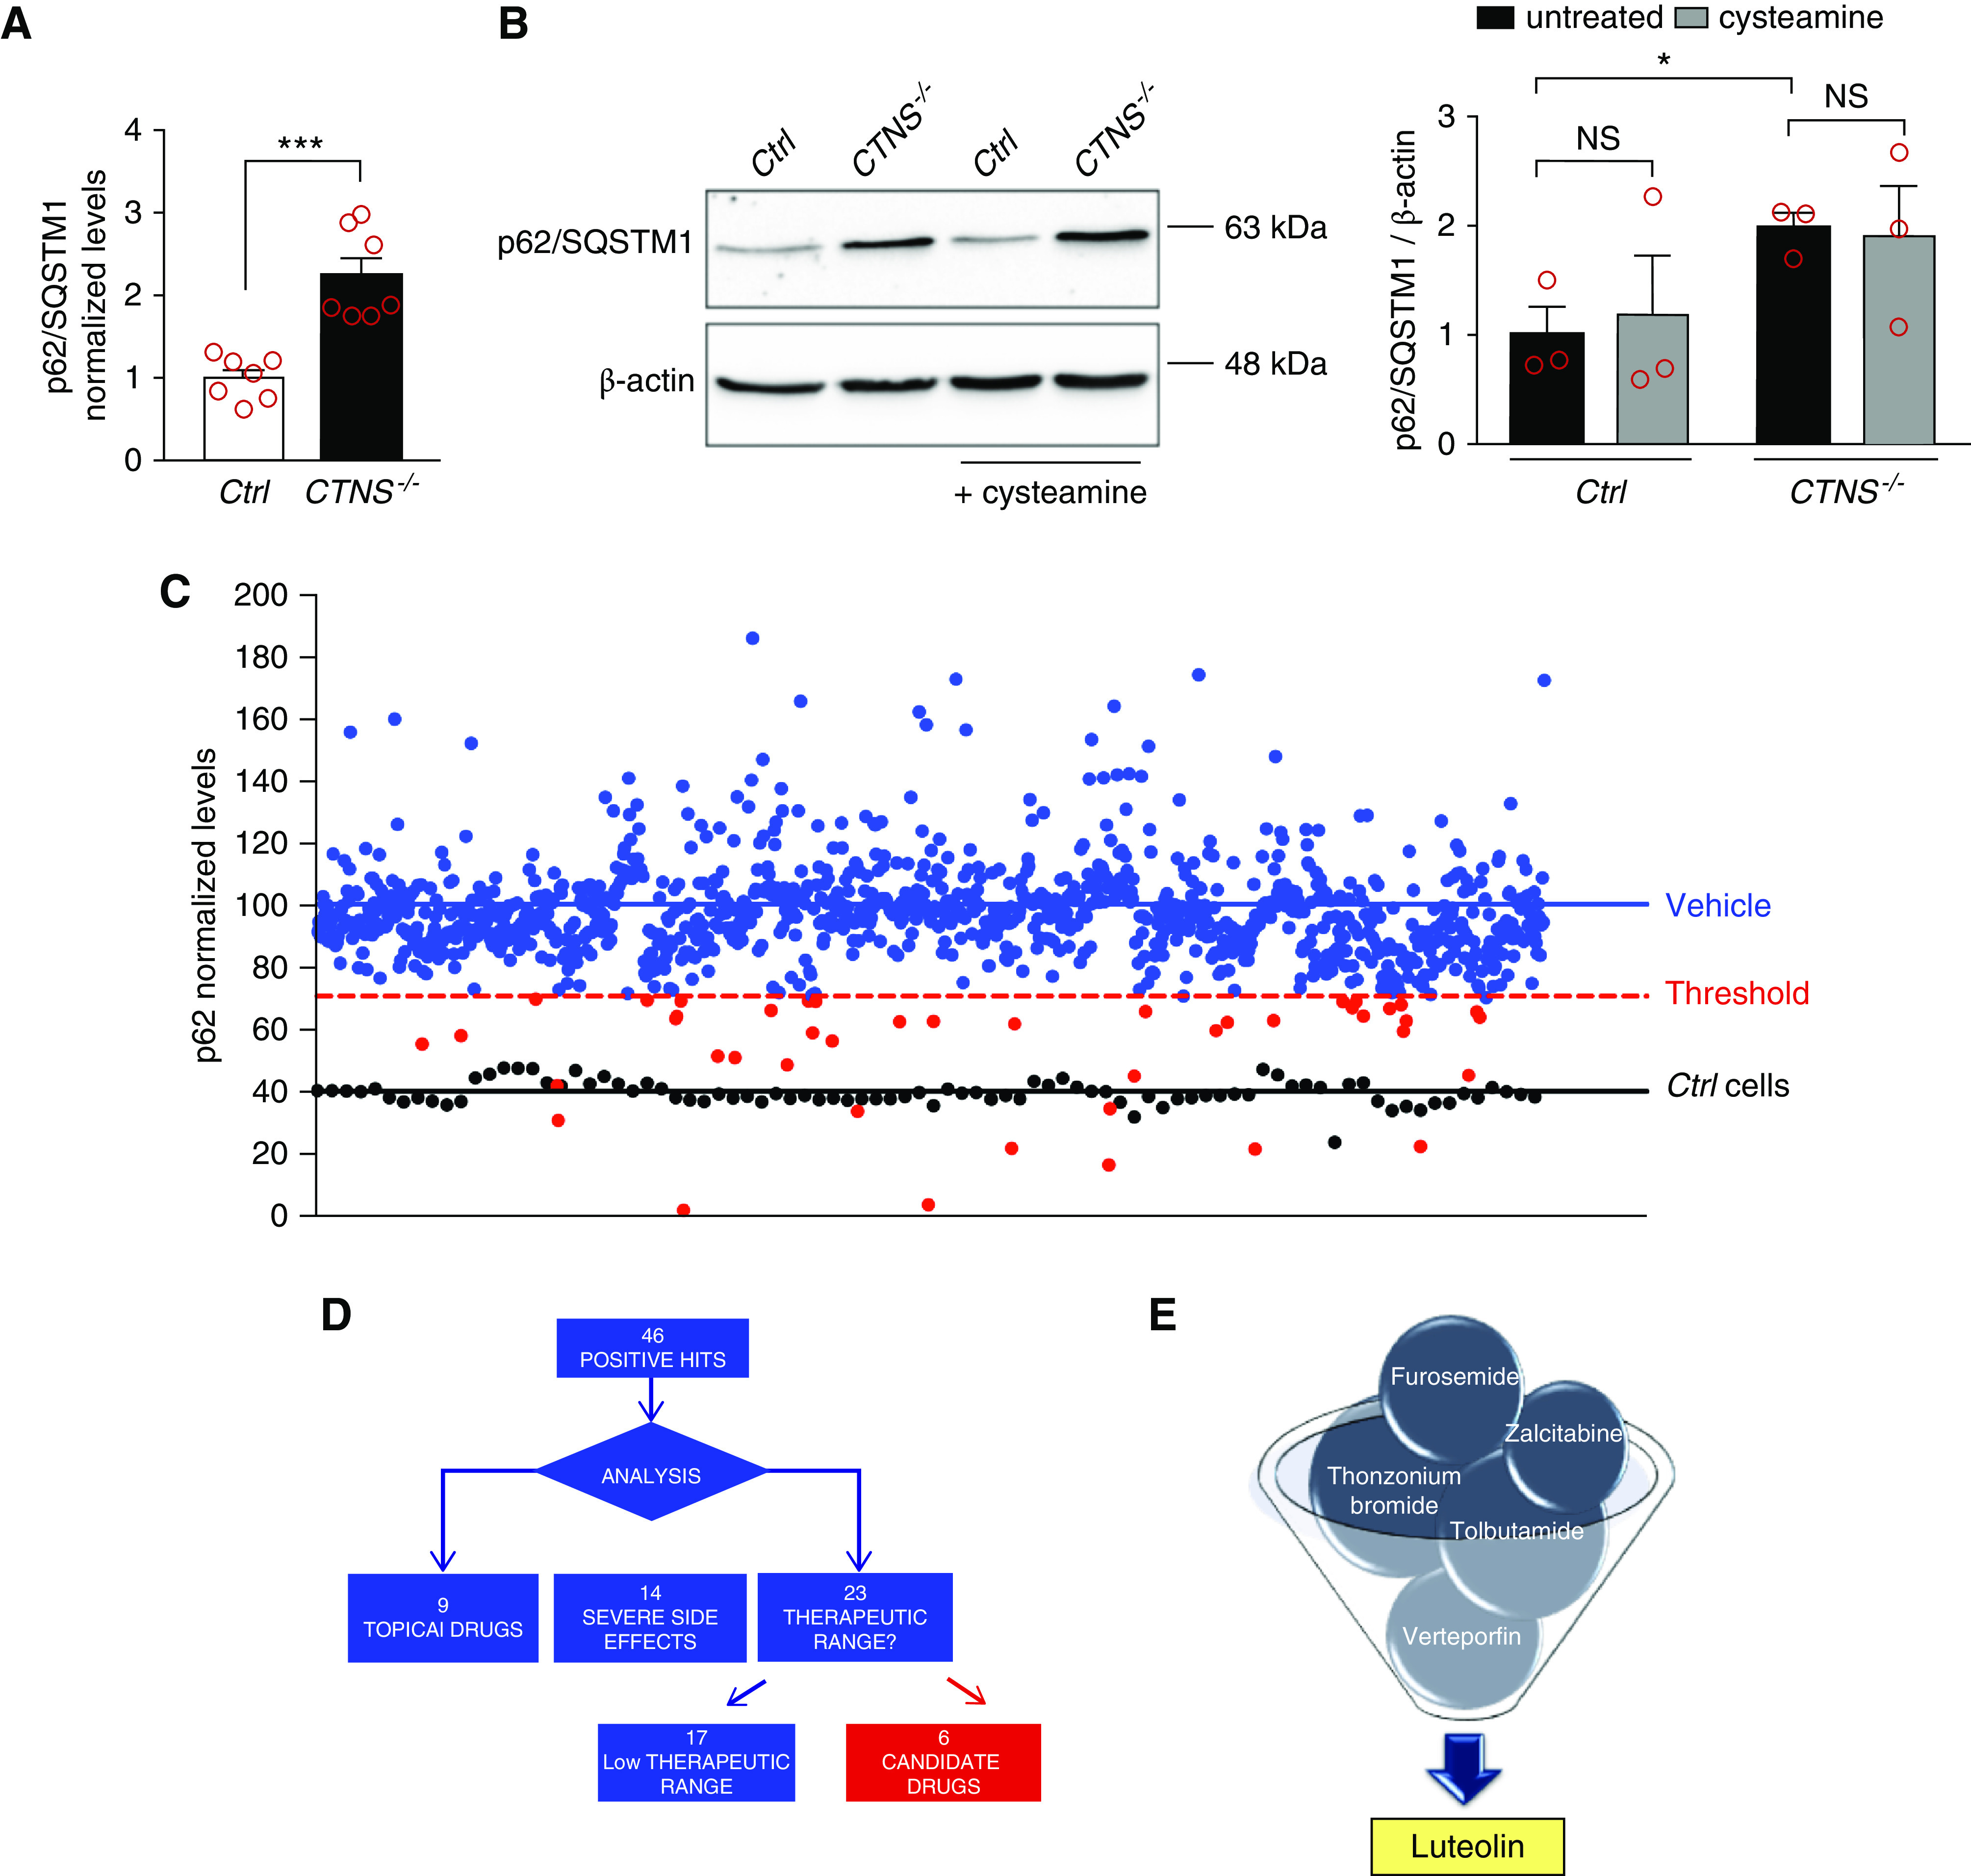
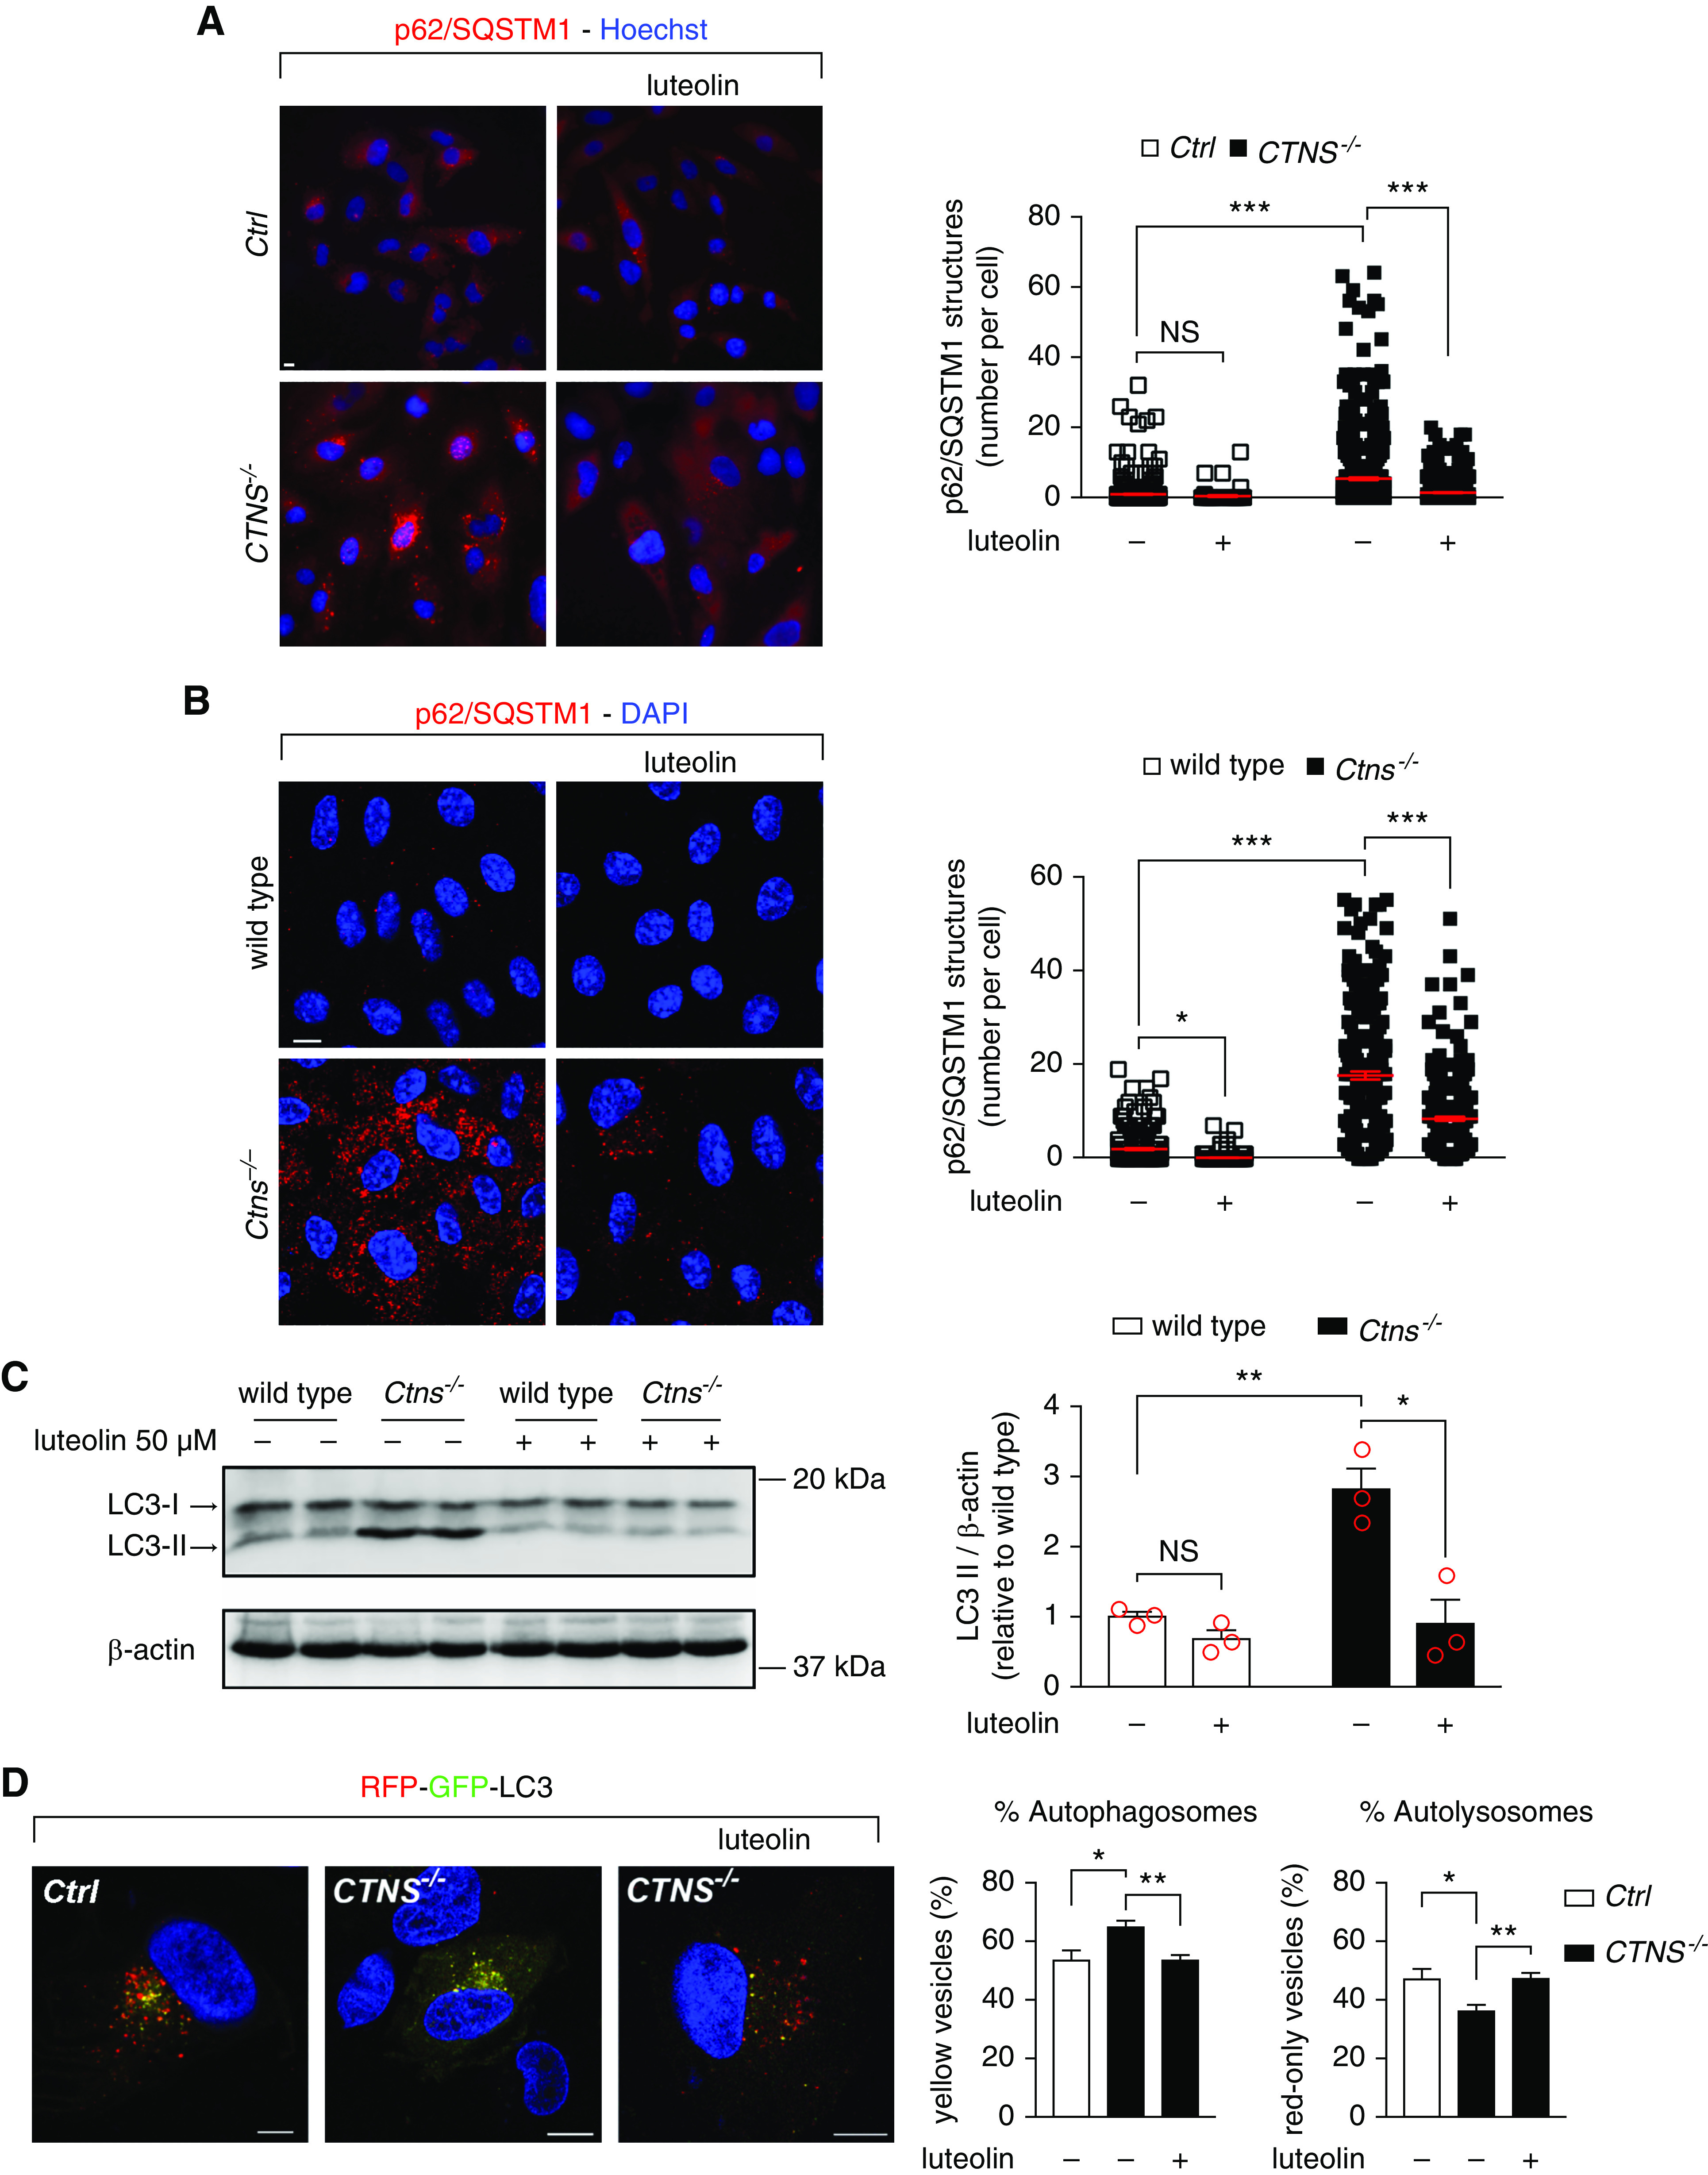
Background: Mutations in the gene that encodes the lysosomal cystine transporter cystinosin cause the lysosomal storage disease cystinosis. Defective cystine transport leads to intralysosomal accumulation and crystallization of cystine. The most severe phenotype, nephropathic cystinosis, manifests during the first months of life, as renal Fanconi syndrome. The cystine-depleting agent cysteamine significantly delays symptoms, but it cannot prevent progression to ESKD and does not treat Fanconi syndrome. This suggests the involvement of pathways in nephropathic cystinosis that are unrelated to lysosomal cystine accumulation. Recent data indicate that one such potential pathway, lysosome-mediated degradation of autophagy cargoes, is compromised in cystinosis.

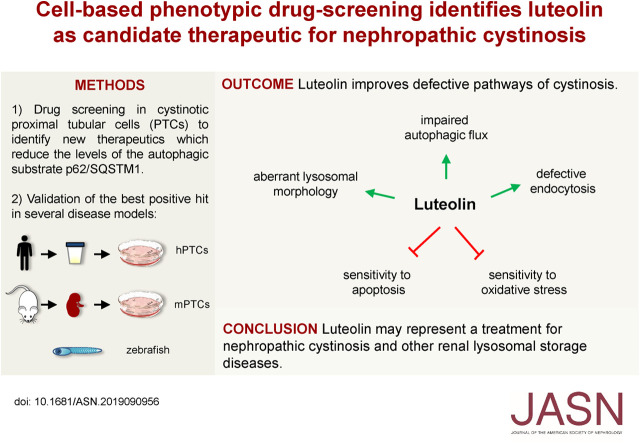
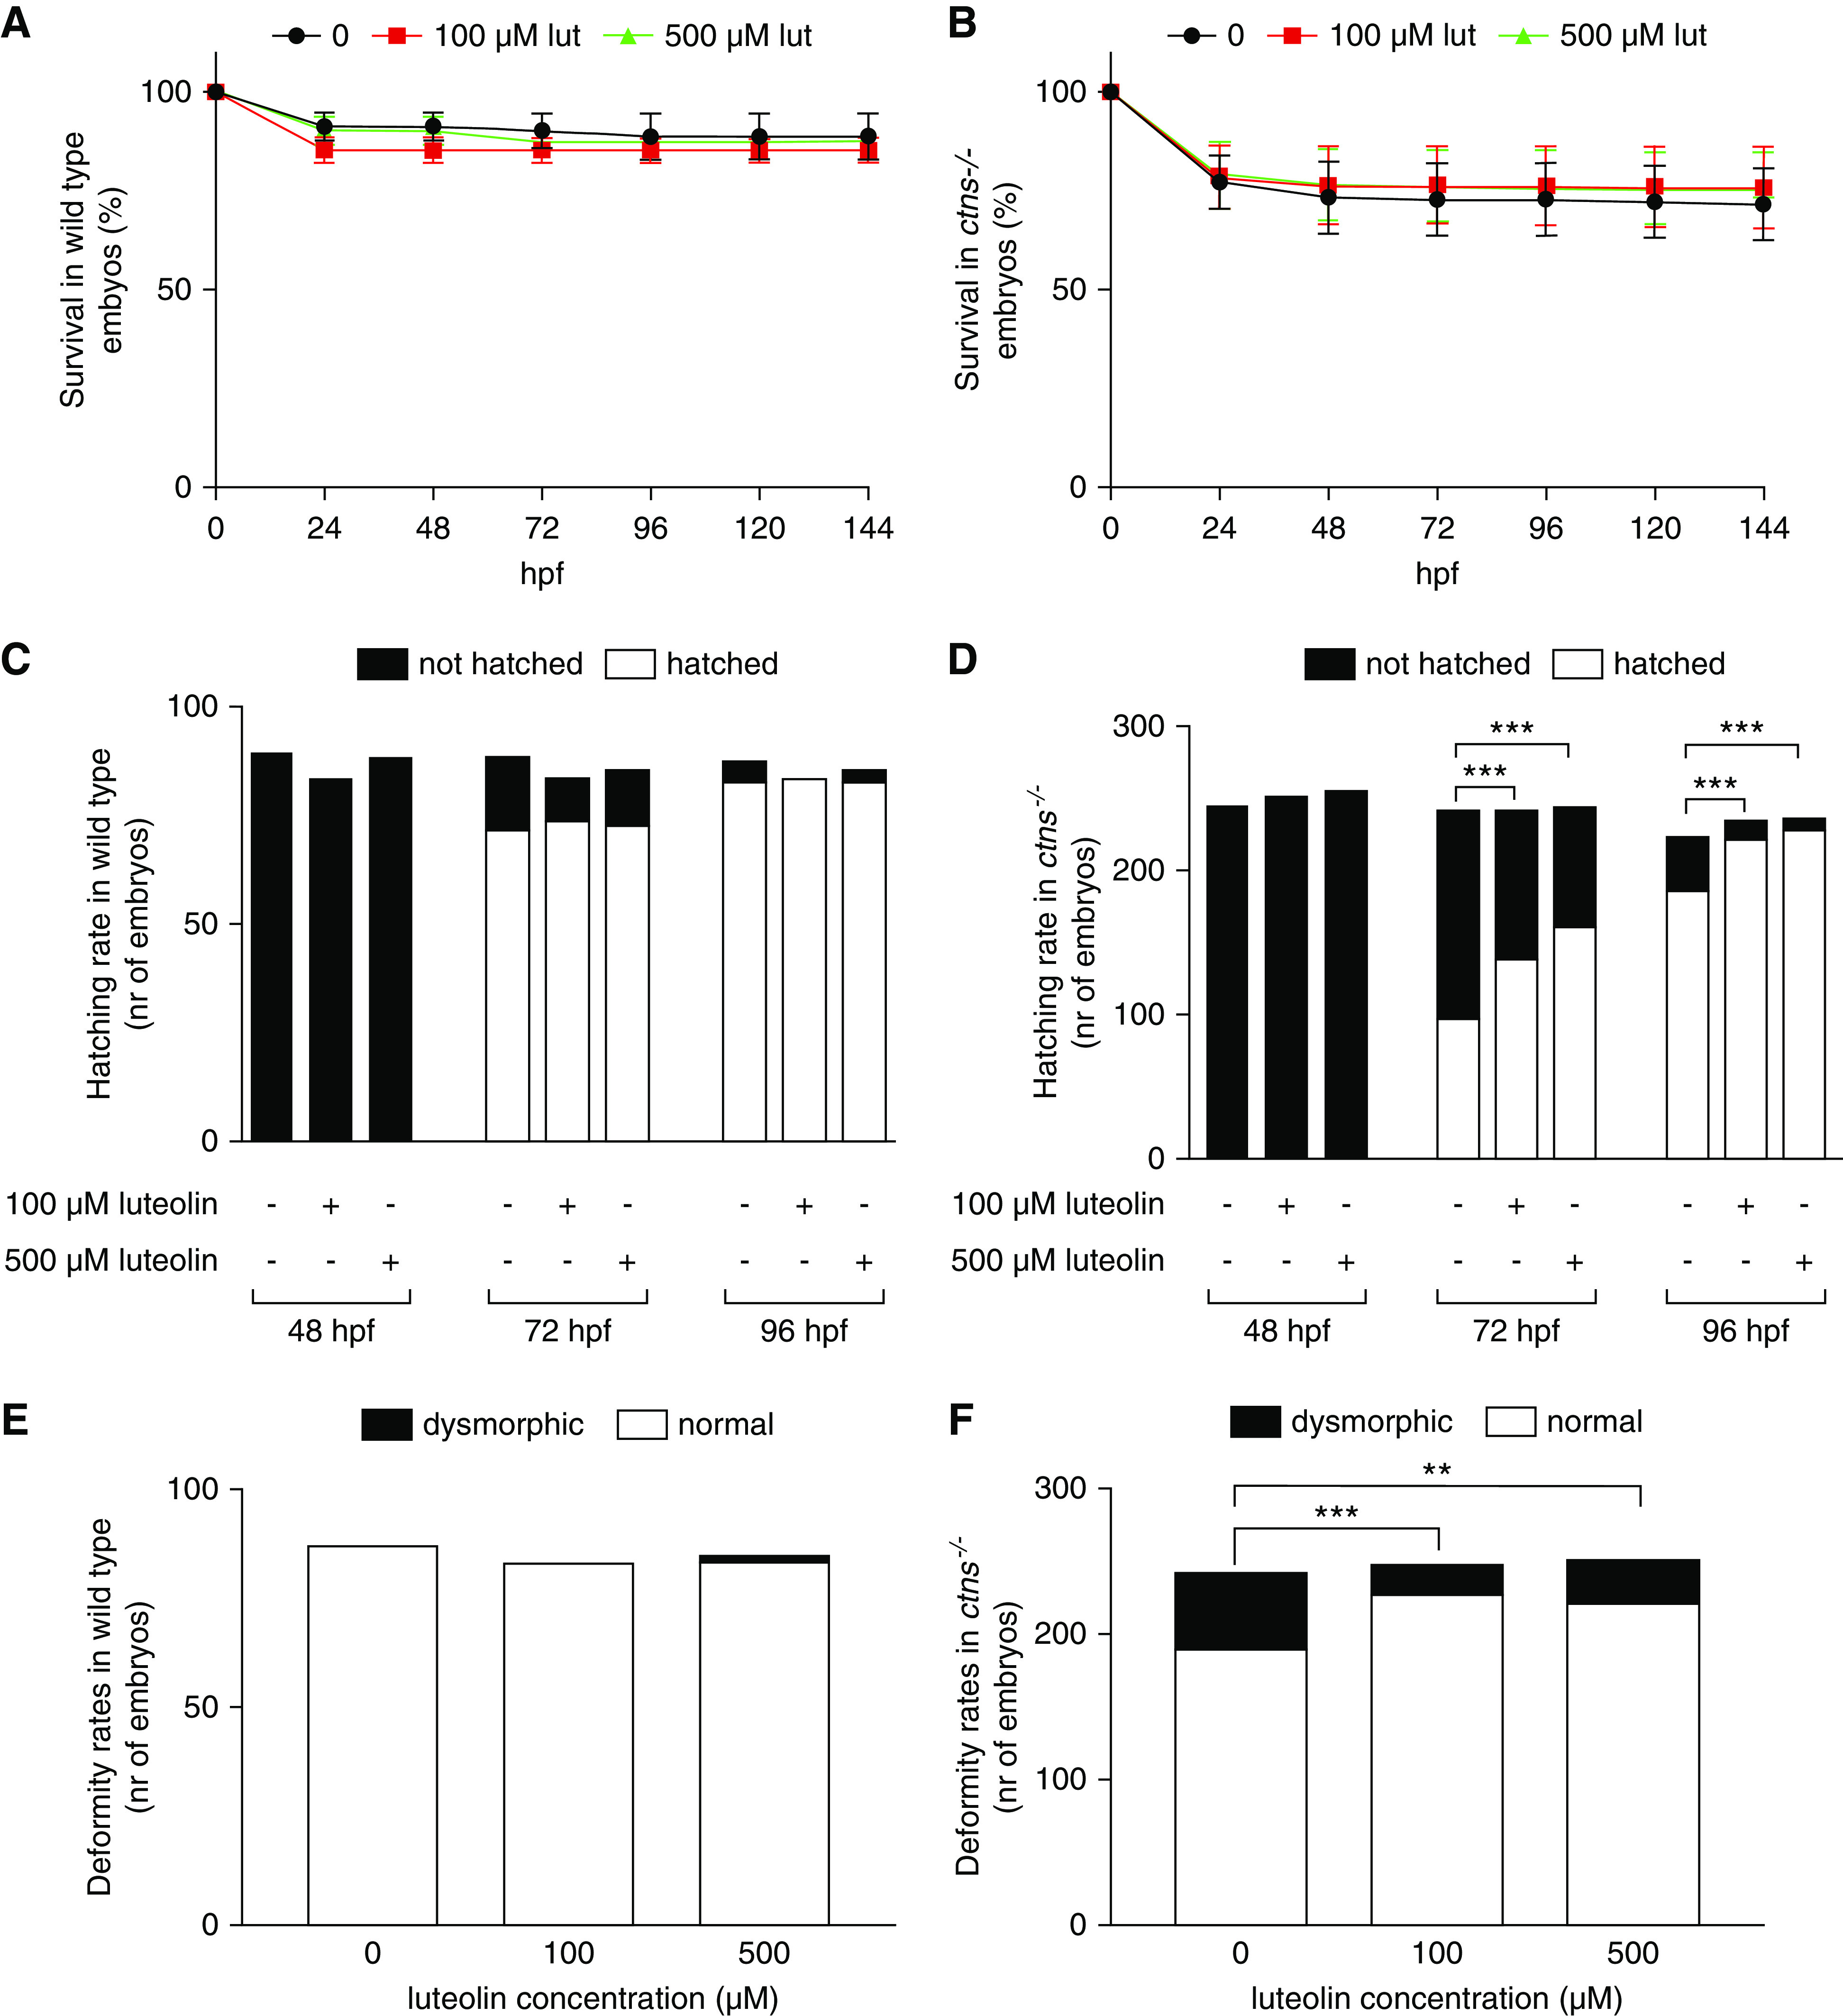
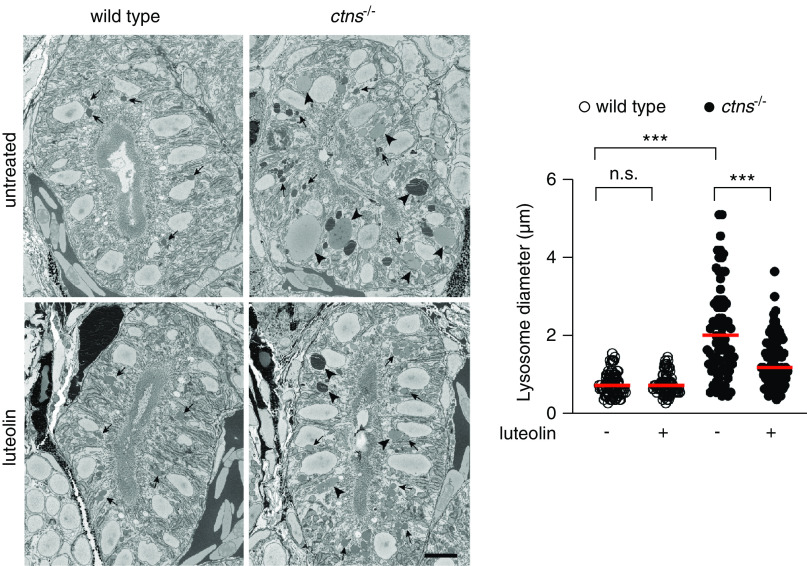
Methods: To identify drugs that reduce levels of the autophagy-related protein p62/SQSTM1 in cystinotic proximal tubular epithelial cells, we performed a high-throughput screening on the basis of an in-cell ELISA assay. We then tested a promising candidate in cells derived from patients with, and mouse models of, cystinosis, and in preclinical studies in cystinotic zebrafish.

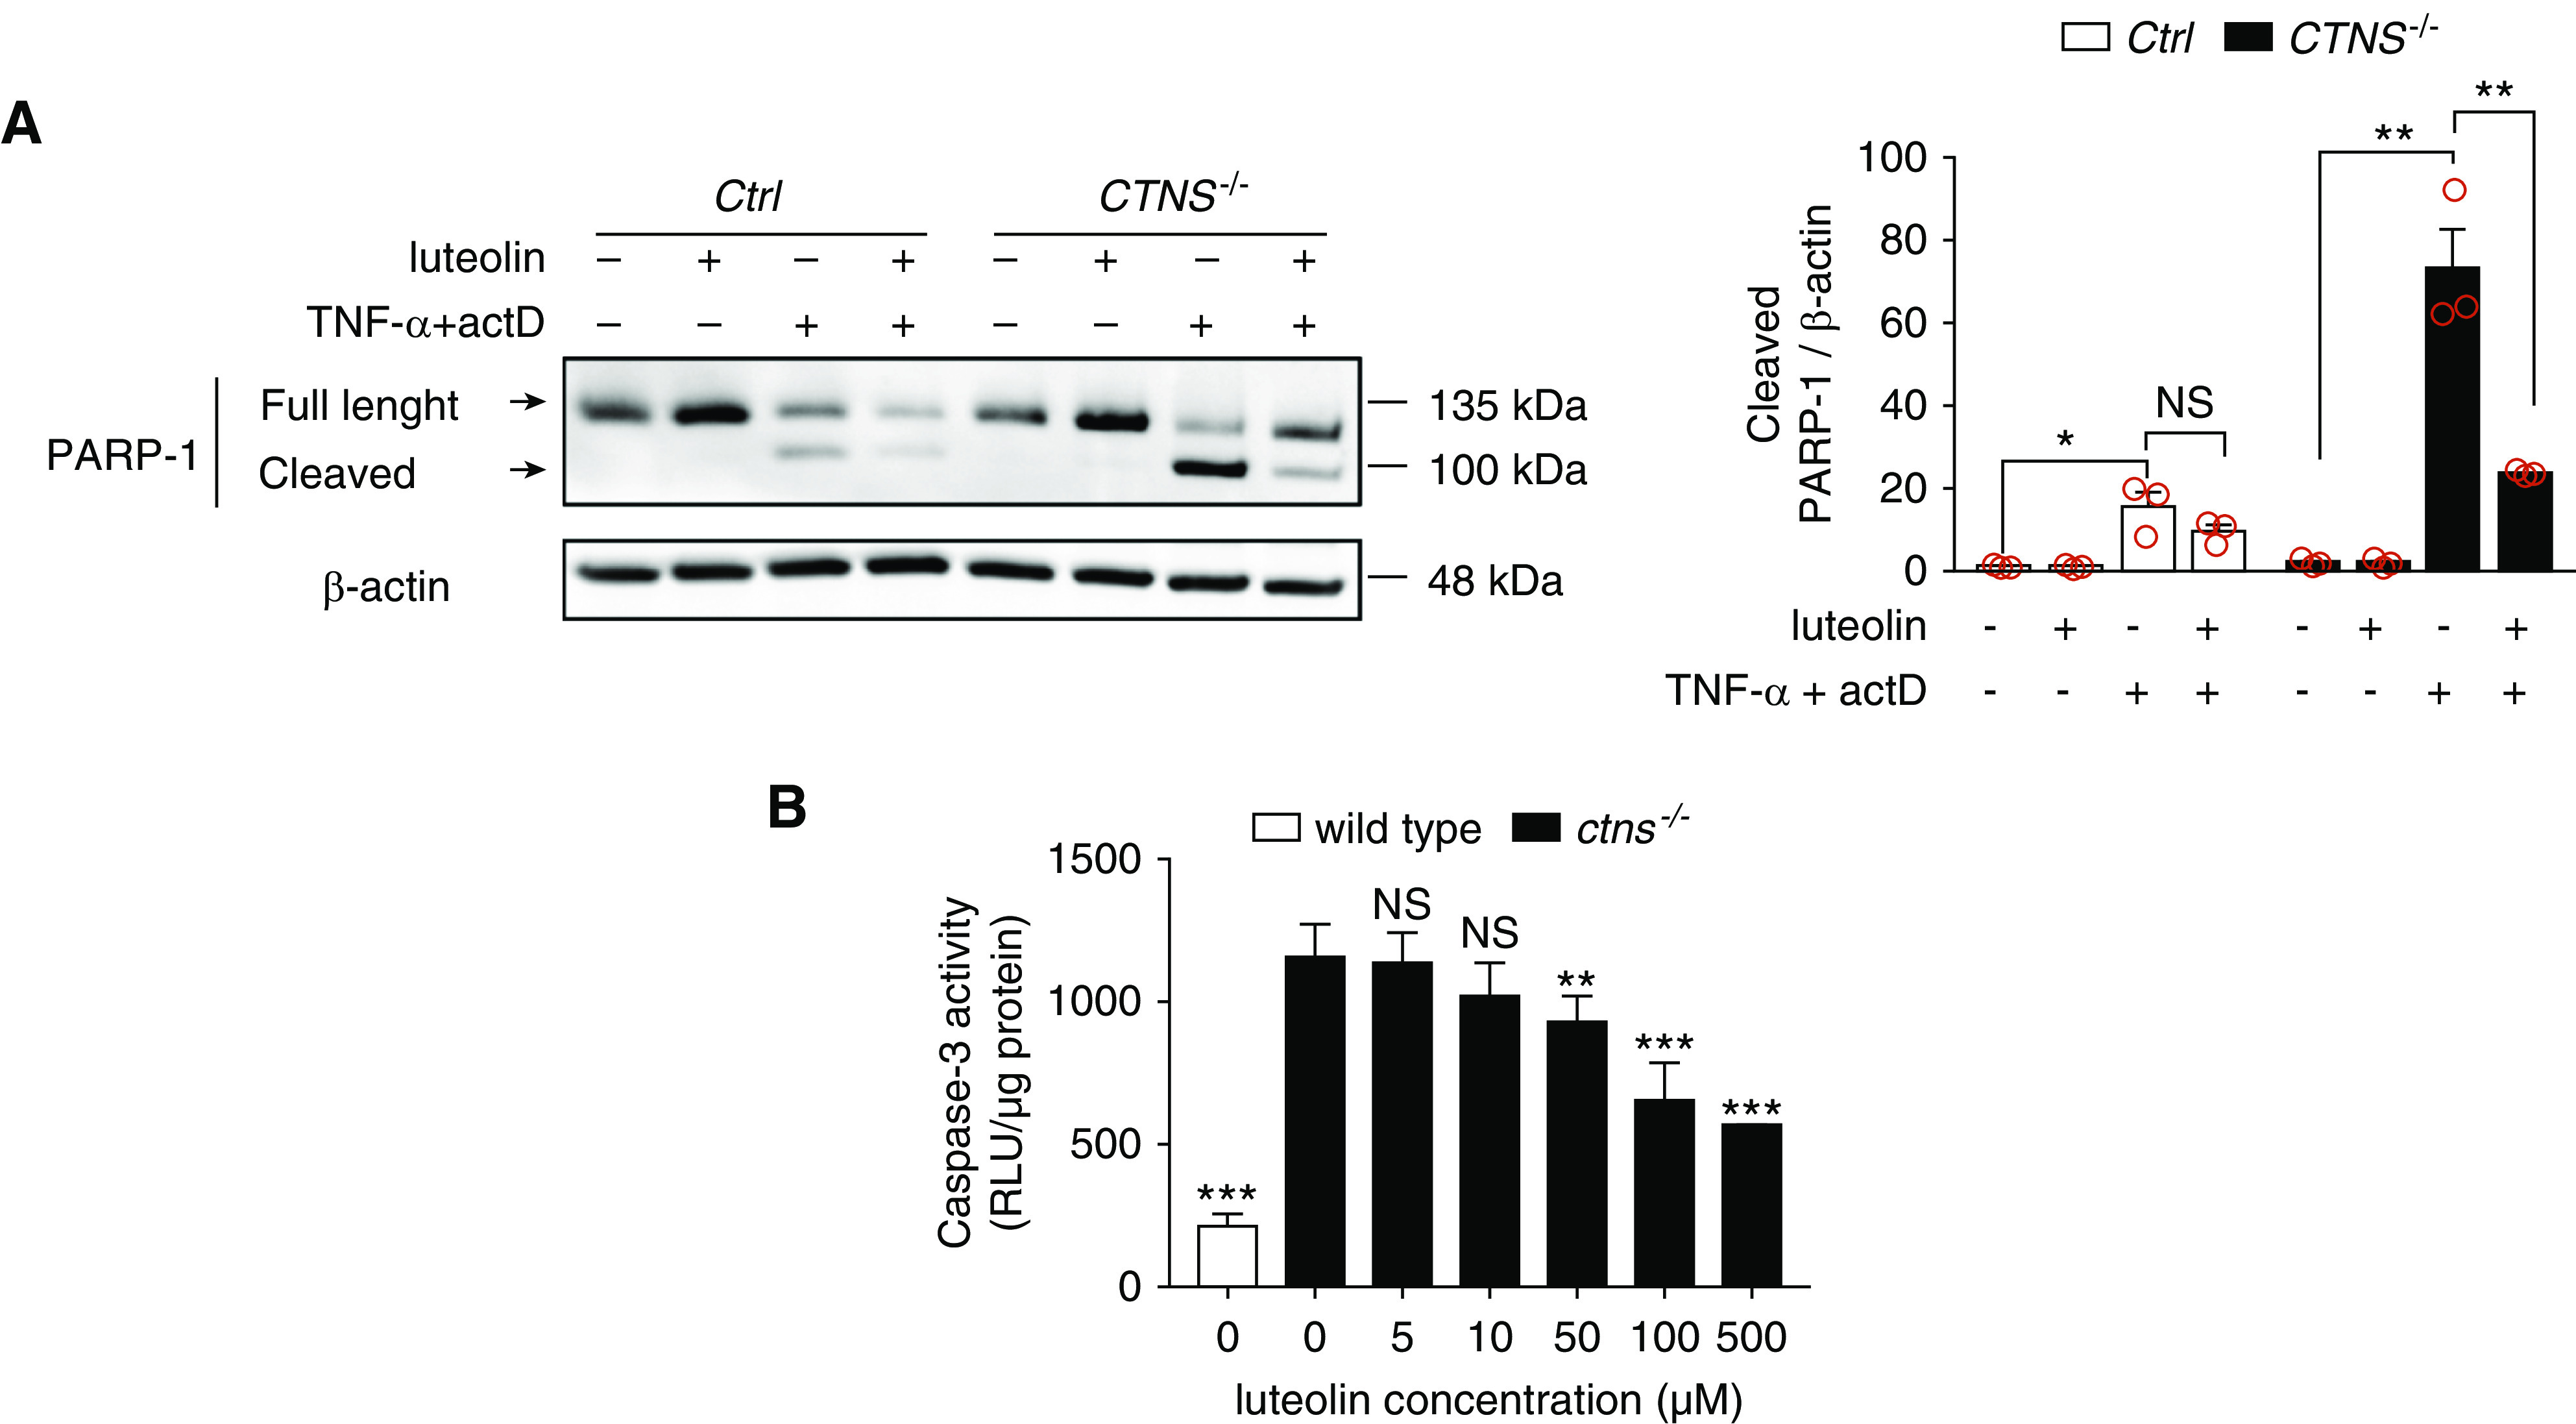
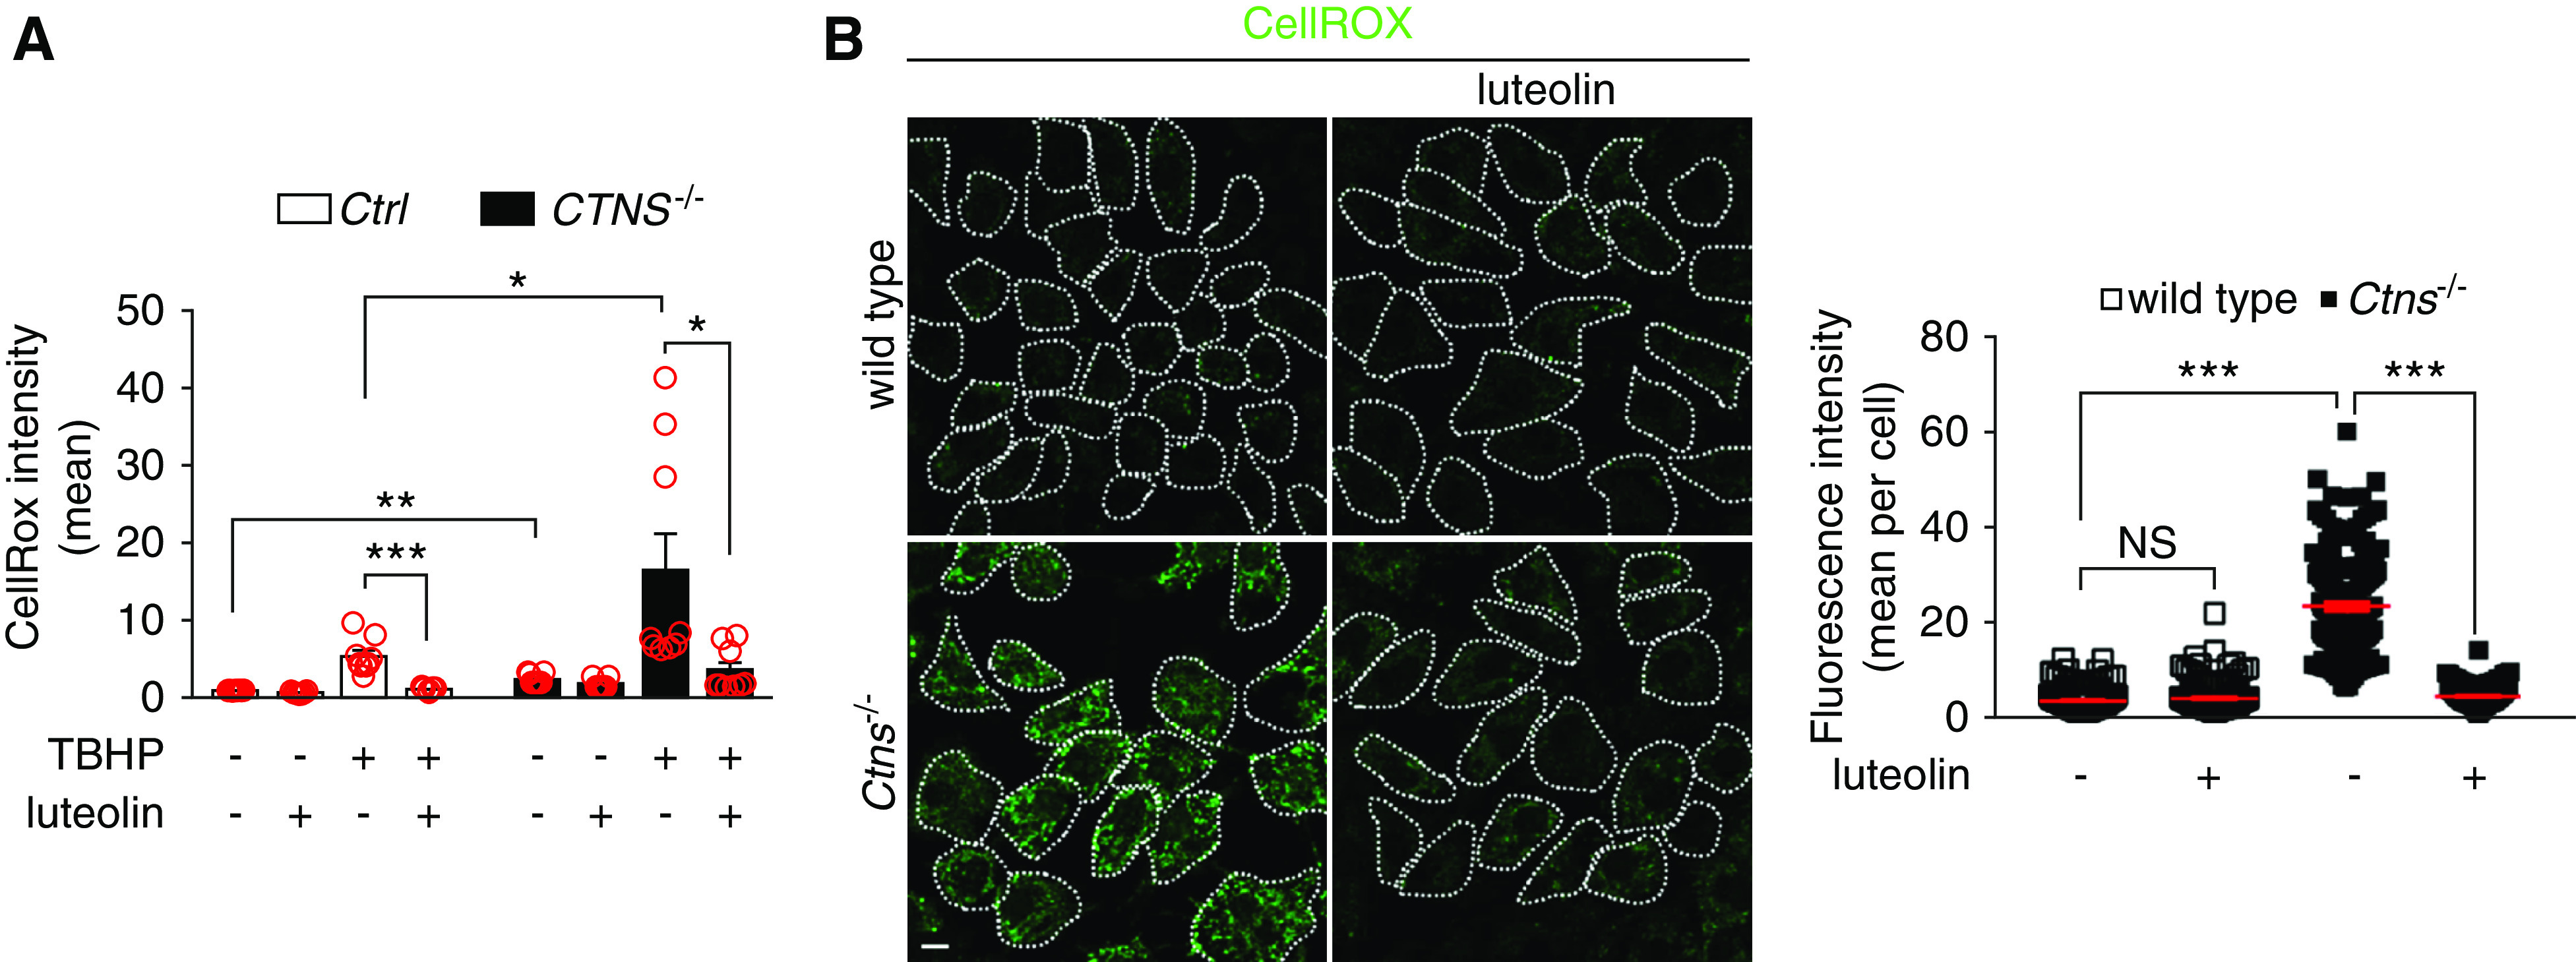
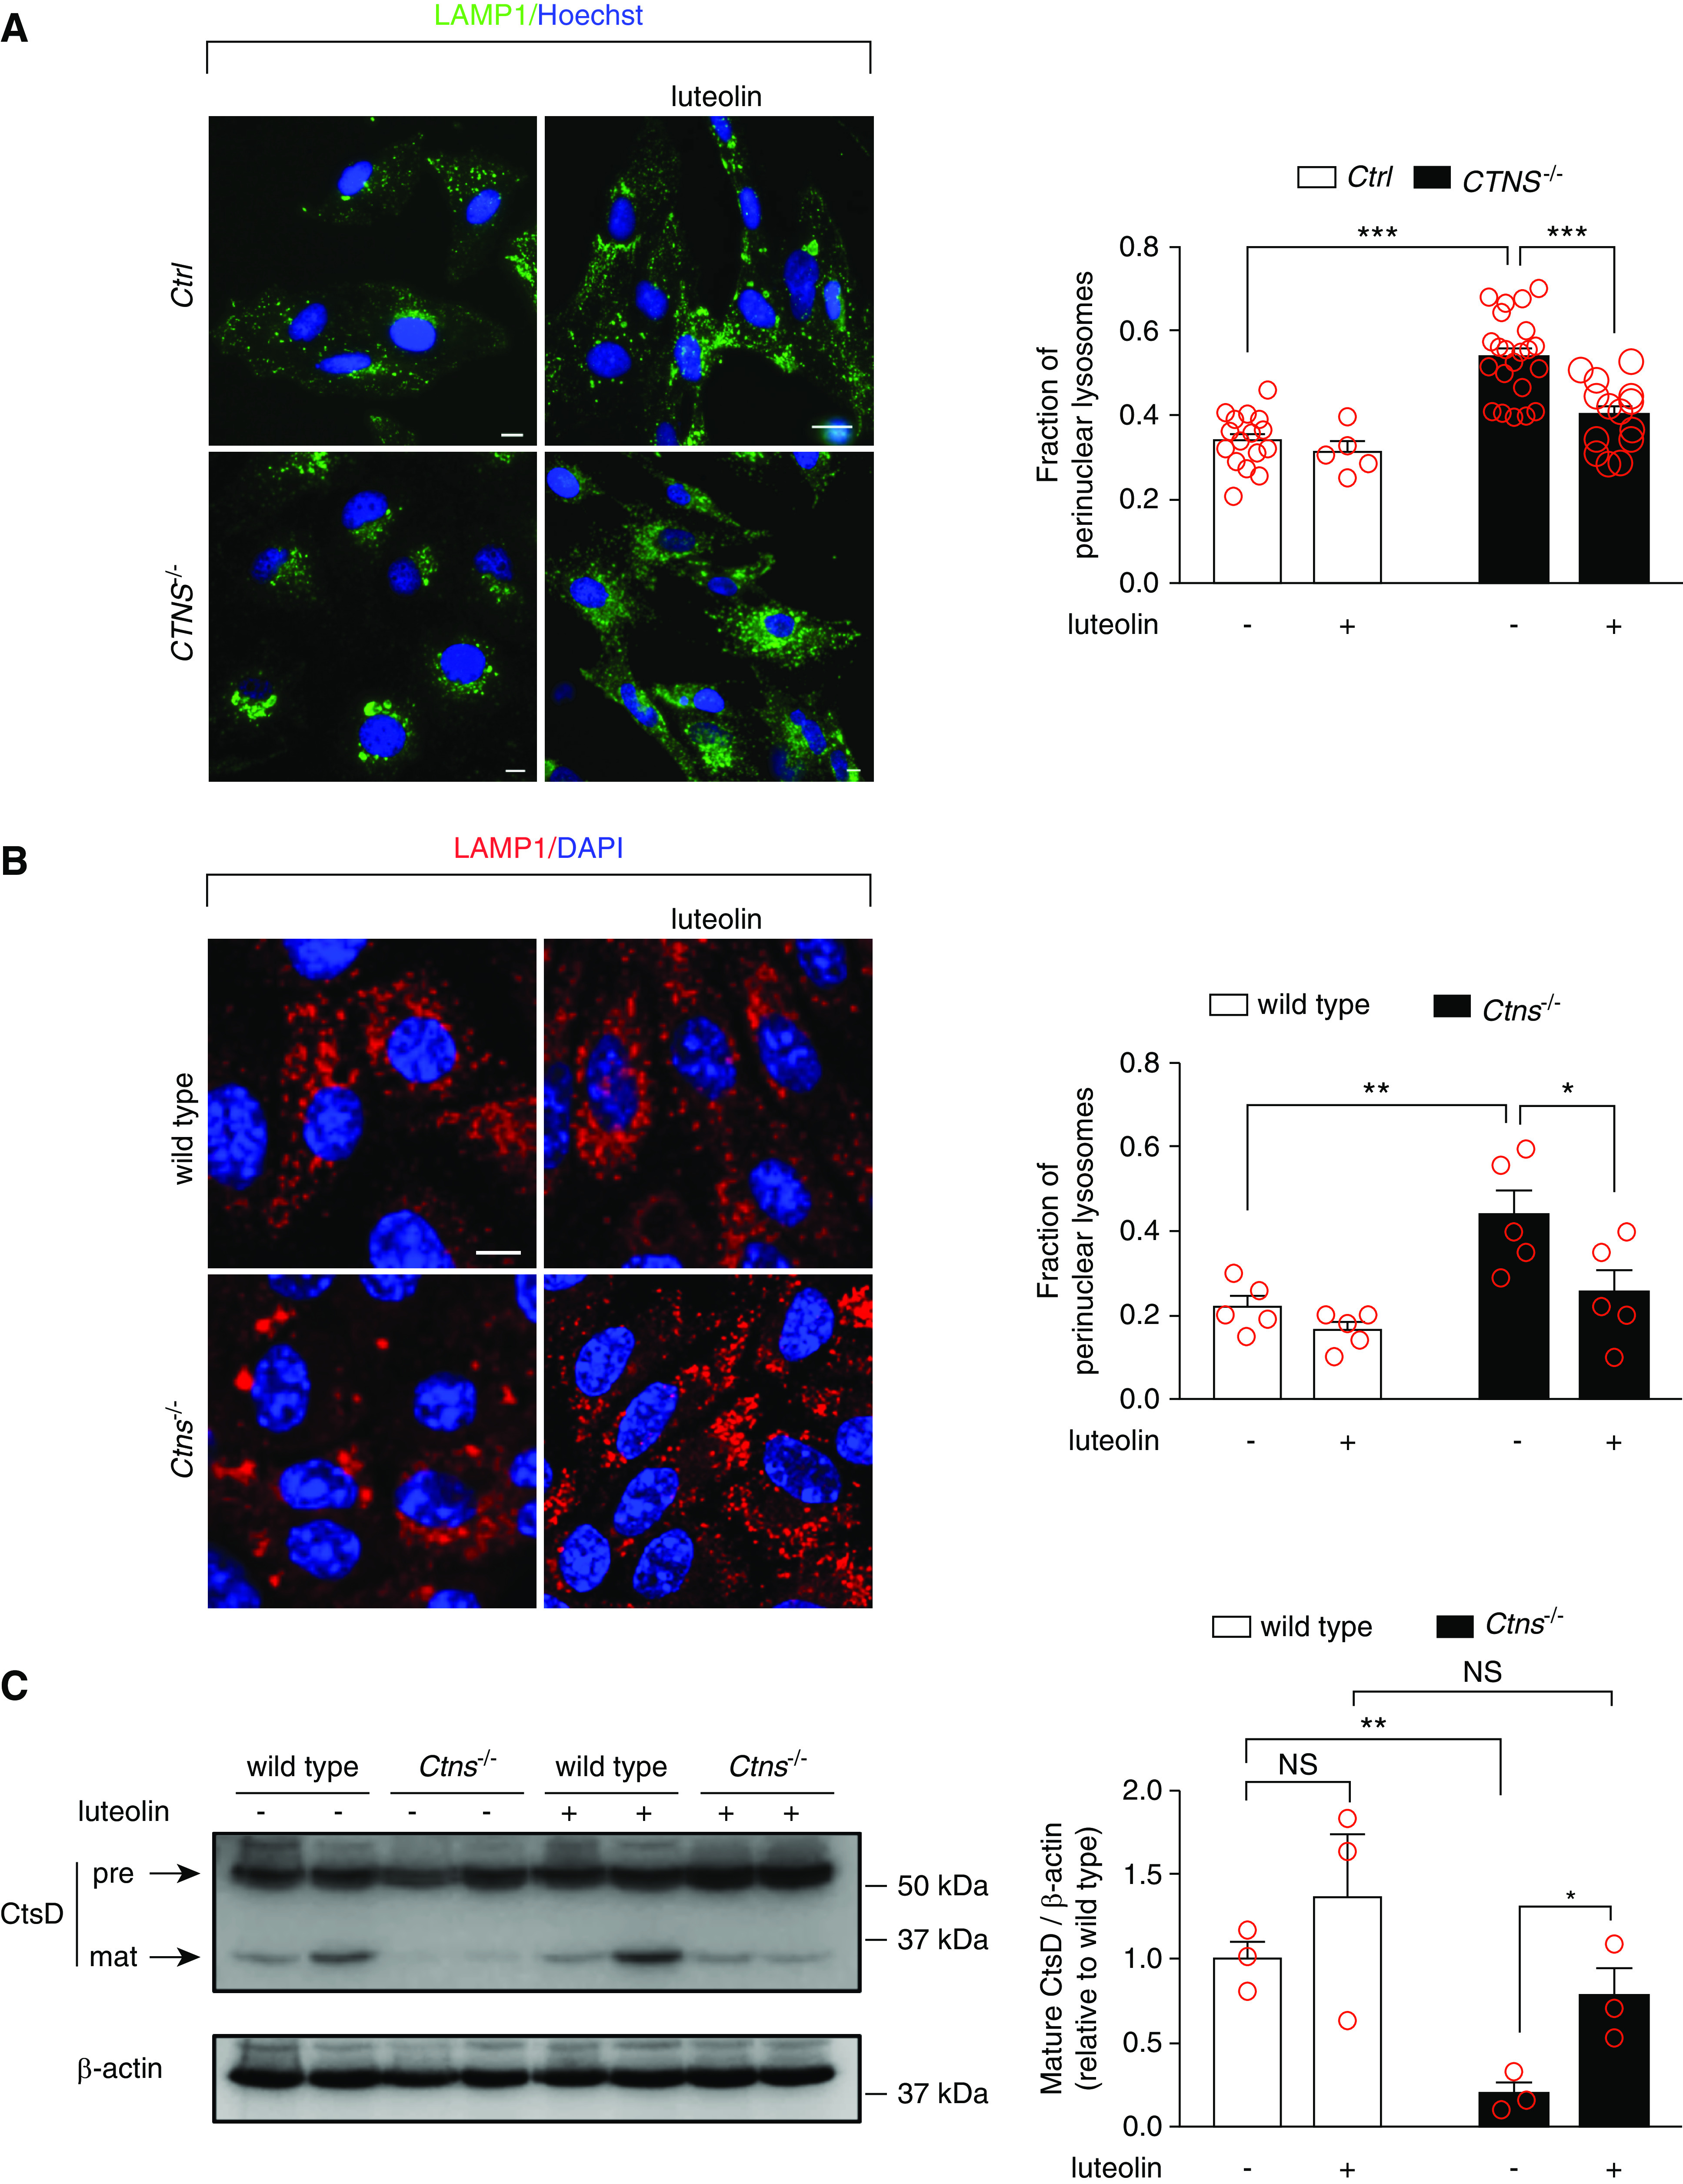
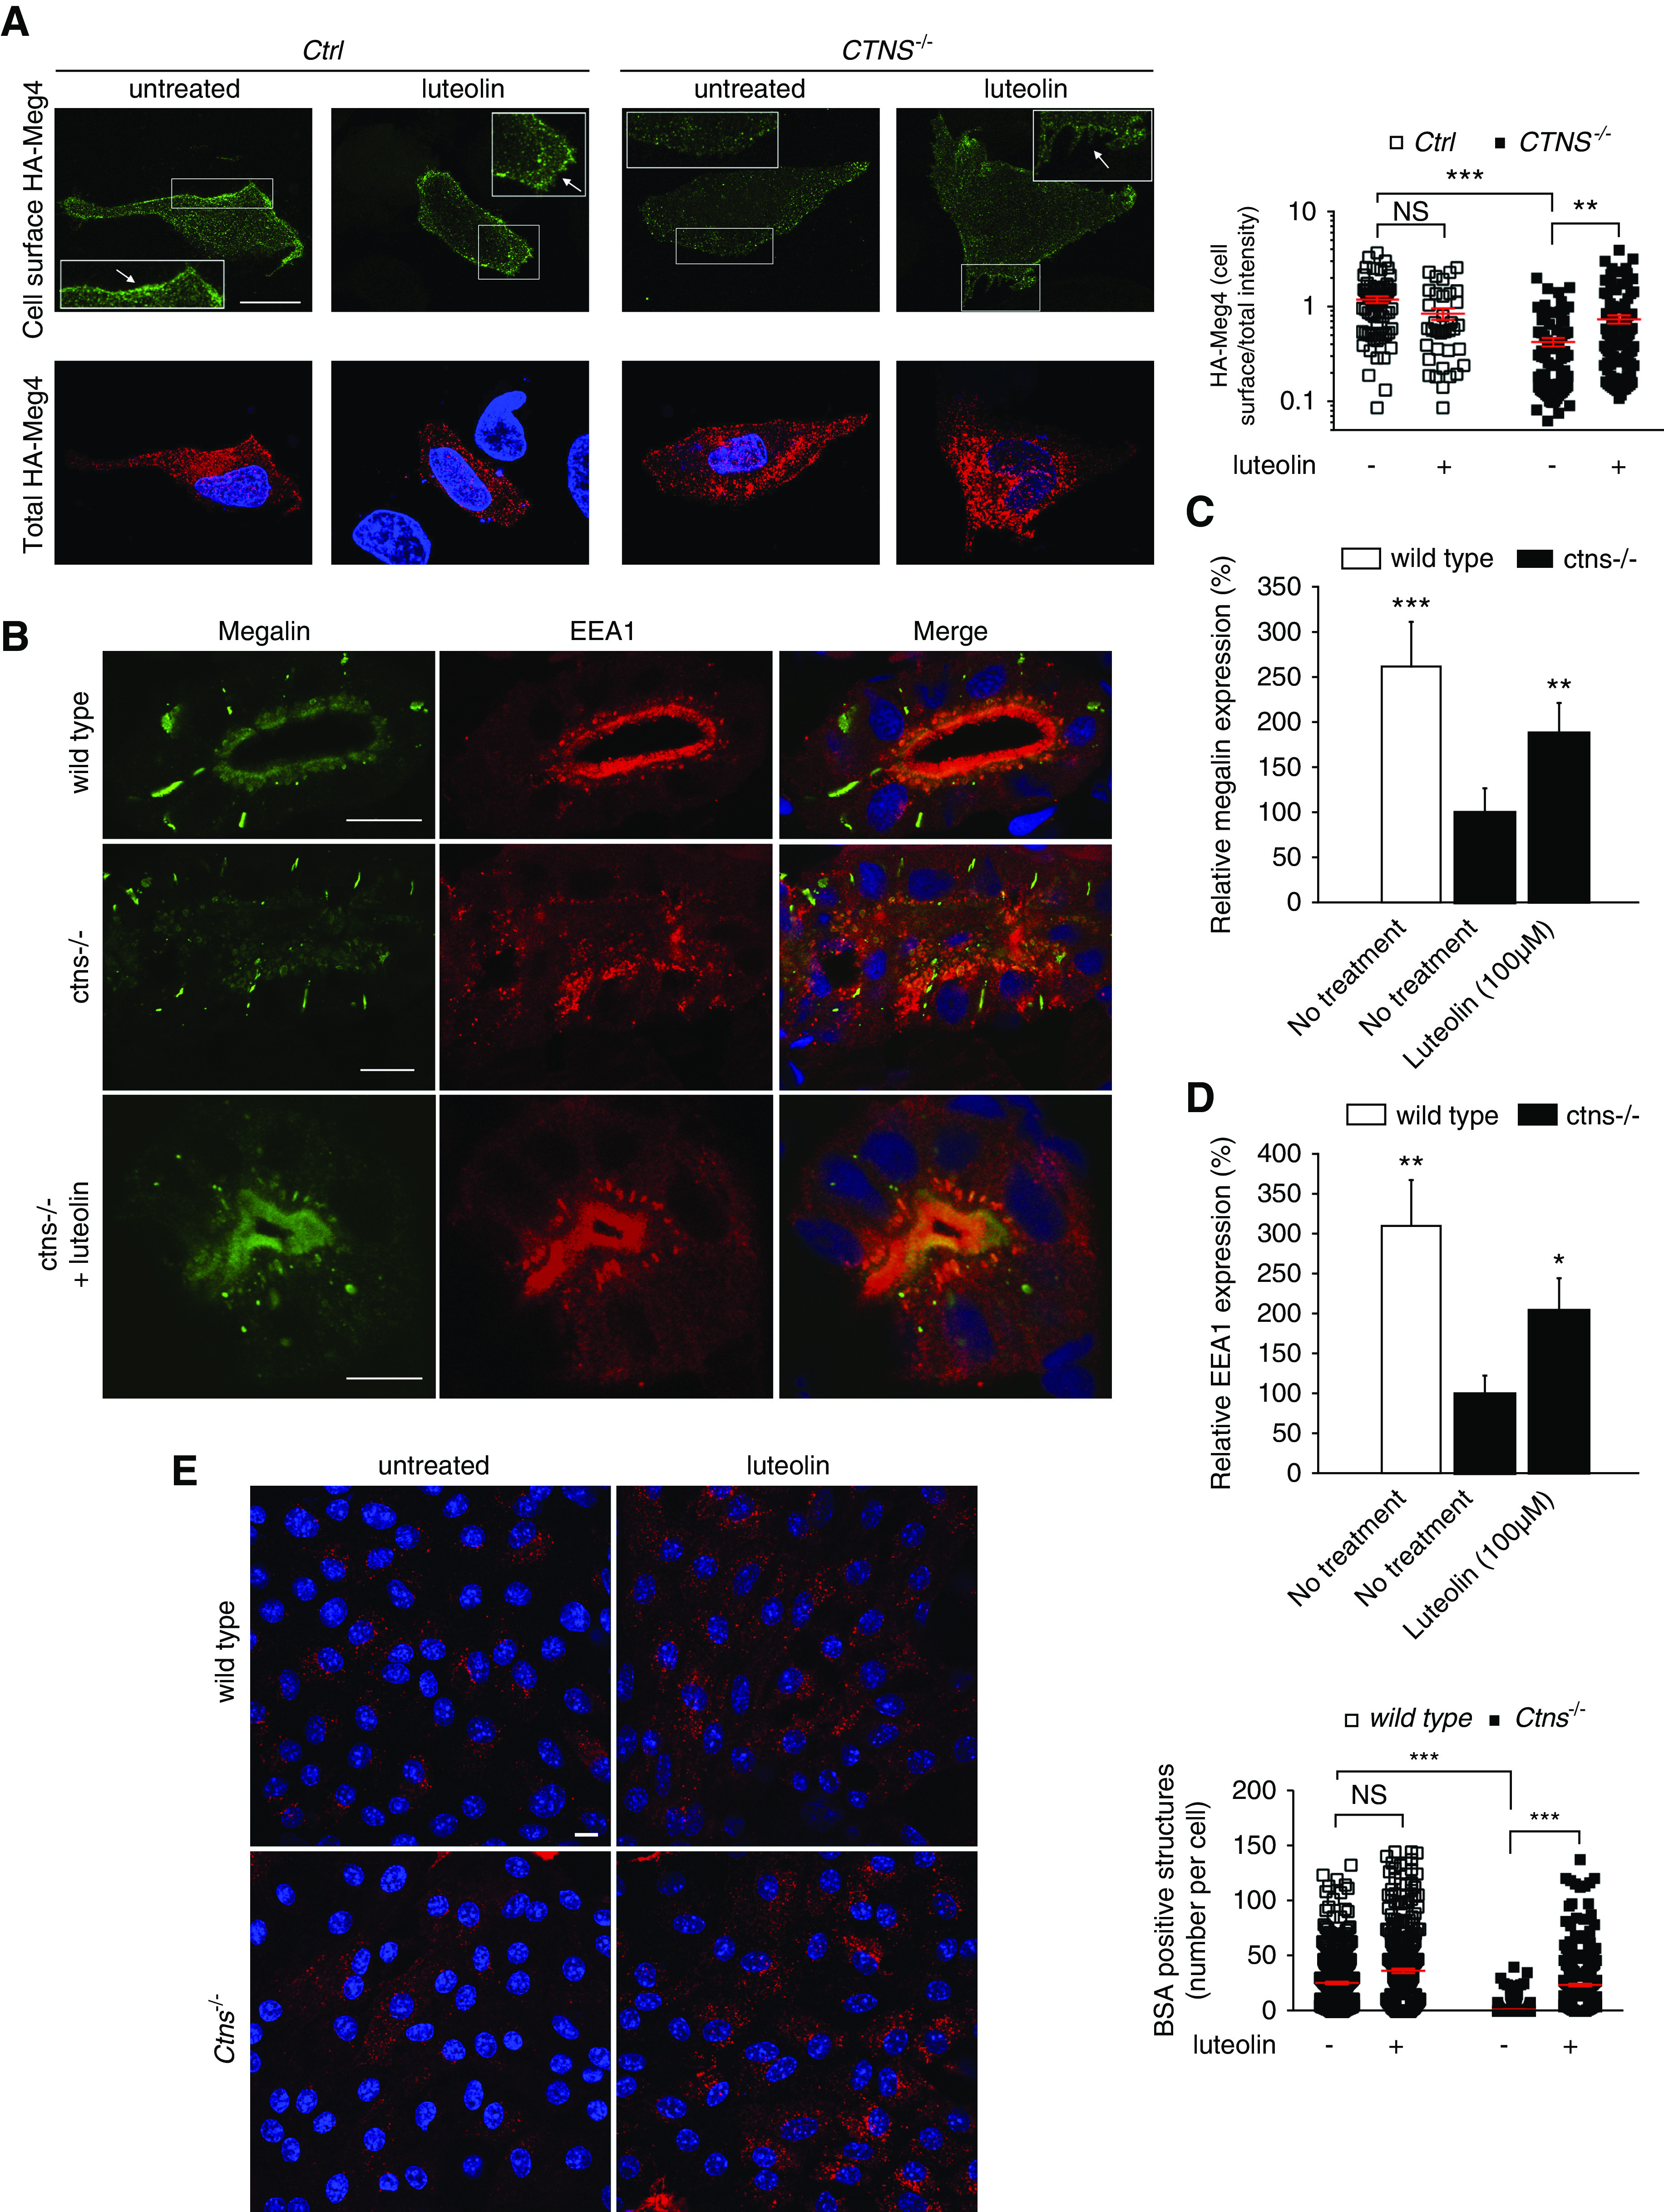
Results: Of 46 compounds identified as reducing p62/SQSTM1 levels in cystinotic cells, we selected luteolin on the basis of its efficacy, safety profile, and similarity to genistein, which we previously showed to ameliorate other lysosomal abnormalities of cystinotic cells. Our data show that luteolin improves the autophagy-lysosome degradative pathway, is a powerful antioxidant, and has antiapoptotic properties. Moreover, luteolin stimulates endocytosis and improves the expression of the endocytic receptor megalin.

Conclusions: Our data show that luteolin improves defective pathways of cystinosis and has a good safety profile, and thus has potential as a treatment for nephropathic cystinosis and other renal lysosomal storage diseases.

Keywords: apoptosis; autophagy; endocytosis; lysosomal storage disease; reactive.


Figures

None
Graphical abstract
Figure 1.
Figure 1.
Cell-based phenotypic drug screening for compounds that reduce p62/SQSTM1 levels. (A) p62/SQSTM1 protein levels were analyzed in ciPTCs from a healthy donor (Ctrl) and a patient with cystinosis (CTNS−/−) by in-cell ELISA. Levels of p62/SQSTM1 were normalized by Janus Green cell stain. Data are shown as fold change of untreated Ctrl. Mean values±SEM from seven independent experiments are reported. t test ***P<0.001. (B) Western blotting and densitometric analysis of p62/SQSTM1 and β-actin levels in Ctrl and CTNS−/− ciPTC after treatment with 100 μM cysteamine for 24 hours. Histogram shows levels of p62/SQSTM1 normalized to those of β-actin and reported as relative to untreated Ctrl ratios. Data are shown as mean±SEM from three independent experiments. t test *P<0.05; NS not statistically significant. (C) p62/SQSTM1 levels were analyzed in CTNS−/− ciPTCs after treatment with DMSO (vehicle, negative control) or 10 μM of each drug of the Prestwick Chemical Library (red and blue dots). Ctrl cells were used as positive control (black dots). The threshold for significance (red dashed line) was set at 50% reduction in the relative increased p62/SQSTM1 levels in CTNS−/− ciPTCs (blue line) compared with Ctrl cells (black line). This threshold highlights 46 positive hits (red spots). Levels of p62/SQSTM1 were normalized to Janus Green cell stain signal. Data are represented as mean value of three independent experiments. (D and E) Diagram represents process of selection of six candidate drugs. The screening yielded 46 positive hits, of which nine drugs were excluded because they are registered for topical use only, 14 because of severe side effects, and 17 because of their low therapeutic range.
Figure 2.
Figure 2.
Luteolin has a favorable toxicity profile and improves hatching rates and deformity rates in ctns−/− zebrafish larvae. (A and B) Survival rates in wild-type and ctns−/− embryos and larvae after 0, 100, or 500 µM luteolin. Data are reported as mean±SEM (n=3 independent experiments). (C and D) Hatching rates in surviving wild-type and ctns−/− embryos evaluated at 48, 72, and 96 hpf with 0, 100, or 500 µM of luteolin. (E and F) Deformity rates in wild-type and ctns−/− larvae after 0, 100, or 500 µM luteolin. The total numbers of embryos evaluated for survival, hatching, and deformity rates were 97 embryos per group of wild-type and 350 embryos per group of ctns−/− zebrafish. Luteolin was administered at 48 hpf in all experiments dissolved in the swimming water with the specified concentrations. **P<0.01 and ***P<0.001 using Fisher test.
Figure 3.
Figure 3.
Luteolin rescues autophagic defects in cystinosis. (A) Representative images of Ctrl and CTNS−/− ciPTCs after treatment with 50 μM luteolin for 24 hours. After fixing, cells were stained with anti-p62/SQSTM1 antibody (red) and Hoechst (nuclei, blue). Scale bar is 10 μm. Graph represents number of p62/SQSTM1-positive structures per cells (n>70 cells from three independent experiments, one-way ANOVA followed by Bonferroni post hoc test, ***P<0.001 and NS not statistically significant). (B) Representative images of wild-type and Ctns−/− mPTCs after treatment with 50 μM luteolin for 24 hours. After fixing, cells were stained with anti-p62/SQSTM1 antibodies (red) and DAPI (nuclei, blue). Scale bar is 10 μm. Graph represents number of p62/SQSTM1-positive structures per cell (n>214). One-way ANOVA followed by Bonferroni post hoc test, *P<0.05 and ***P<0.001. (C) Western blotting and densitometric analyses of LC3 and β-actin protein levels in mPTCs after treatment with 50 µM luteolin for 24 hours. Data are shown as mean±SEM (n=3 independent experiments), t test *P<0.05; **P<0.01 and NS not statistically significant. (D) Representative images of Ctrl and CTNS−/− ciPTCs transfected with RFP-GFP-LC3. After 24 hours from transient transfection, cells were left untreated or treated with 50 µM luteolin for 24 hours. Scale bar is 10 µm. GFP and RFP signals were analyzed by confocal microscopy. Percentage of autophagosomes (yellow vesicles) and percentage of autolysosomes (red-only vesicles) were calculated on the basis of the ratio between the number of yellow and red-only puncta, respectively, and the total number of autophagosomes (number of yellow and red-only puncta). Data are reported as mean±SEM (n>70 cells from five independent experiments). One-way ANOVA followed by Bonferroni post hoc test, **P<0.01 and *P<0.05.
Figure 4.
Figure 4.
Luteolin reduces sensitivity to apoptosis in CTNS−/− ciPTCs and in ctns−/− zebrafish larvae. (A) Western blotting and densitometric analysis of PARP-1 and β-actin protein levels in Ctrl and CTNS−/− ciPTCs left untreated or pretreated with 50 µM luteolin for 6 hours. After luteolin pretreatment, where indicated apoptosis was induced by 18 hours treatment with 30 ng/ml TNFα and 2.5 μg/ml actinomycin D (actD). Histogram shows levels of cleaved PARP-1 normalized to those of β-actin and reported as relative to untreated Ctrl ratios. Data are shown as mean±SEM from three independent experiments. t test *P<0.05; **P<0.01 and NS not statistically significant. (B) Quantitation of caspase-3 enzyme activity (RLU/µg protein) in homogenates of 120 hpf wild-type and ctns−/− zebrafish larvae either untreated or treated with 5, 10, 50, 100, and 500 µM luteolin. Twenty larvae were homogenized in each pellet and at least three replicates were performed per condition. t test **P<0.01; ***P<0.001 and NS not statistically significant relative to untreated ctns−/− condition.
Figure 5.
Figure 5.
Luteolin treatment reduces oxidative stress in cystinotic cells. (A) Ctrl and CTNS−/− ciPTCs were left untreated or pretreated with 50 μM luteolin for 24 hours. Levels of cellular ROS were then analyzed both at basal conditions and after 2 hours exposure to 100 μM tert-butyl- hydroperoxide (TBHP) by CellROX staining and flow cytometry. Diagram shows CellROX mean intensities normalized to those of untreated Ctrl. Data are presented as mean±SEM from nine independent experiments. t test *P<0.05; **P<0.01; and ***P<0.001 . (B) Representative images and quantification of CellROX (green) staining in wild-type and Ctns−/− mPTCs under basal condition or treatment with 50 μM luteolin for 24 hours. Scale bar is 10 μm. CellROX fluorescence intensities per cell are reported; means and SEM are shown in red (n>100 cells, one-way ANOVA followed by Bonferroni post hoc test, ***P<0.001 and NS not statistically significant ).
Figure 6.
Figure 6.
Luteolin treatment rescues morphology and degradation capacities of lysosomes in cystinotic cells. (A) Representative images of Ctrl and CTNS−/− ciPTCs left untreated or treated with 50 μM luteolin for 24 hours. After fixing, cells were stained with anti–lysosome-associated membrane protein 1 (LAMP1) antibody (green) and Hoechst (nuclei, blue). Scale bar is 10 µm. Fraction of perinuclear lysosomes was quantified in at least five randomly selected fields (red circles) per condition. Mean±SEM are shown by column bars. One-way ANOVA followed by Bonferroni post hoc test, ***P<0.001 . (B) Representative images of wild-type and Ctns−/− mPTCs under basal condition or treatment with 50 μM luteolin for 24 hours. After fixing, cells were stained with anti-LAMP1 antibody (red) and DAPI (nuclei, blue). Scale bar is 10 µm. Fraction of perinuclear lysosomes was quantified in at least five randomly selected fields (red circles) per condition. Mean±SEM are shown by column bars. One-way ANOVA followed by Bonferroni post hoc test, *P<0.05 and **P<0.01. (C) Western blotting and densitometric analysis of cathepsin-D (CtsD) and β-actin protein levels from wild-type and Ctns−/− mPTCs, left untreated or treated with 50 µM luteolin for 24 hours. Histogram shows levels of mature CtsD (33 kDa) normalized to those of β-actin and reported as relative to control wild-type ratios (n=3 independent experiments). t test *P<0.05; **P<0.01 and NS not statistically significant.
Figure 7.
Figure 7.
Luteolin restores impaired morphology of lysosomes in the pronephros of ctns−/− larvae. Representative block-face scanning electron microscopy images of the proximal tubule of 5 dpf wild-type and ctns−/− larvae after treatment without or with luteolin (100 μM for 72 hours). Arrowheads indicate lysosomes >1.5 µm diameter. Arrows indicate lysosomes <1.5 µm diameter. Scale bar is 5 μm. Diameter of lysosomes was quantified in five randomly selected fields (n=80 lysosomes from four tubules of two larvae for each experimental condition). Mann–Whitney U test ***P<0.001 and NS not statistically significant .
Figure 8.
Figure 8.
Luteolin restores endocytic defects in cystinosis. (A) Ctrl and CTNS−/− ciPTCs were transiently transfected with HA-Meg4. After 4–6 hours, transfection medium was replaced by full medium or 50 μM luteolin for 24 hours. The cell surface exposure of HA–Meg4 was measured through binding at 4°C (cell surface HA–Meg4) of an anti-HA mouse antibody. The total amount of HA–Meg4 expressed was measured using an anti-HA rabbit antibody (total HA–Meg4) in permeabilized HA–Meg4 cells. The arrows indicate plasma membrane localization of HA-Meg4. Scale bar is 20 μm. Histogram shows ratios of cell surface/total HA-Meg4 fluorescence intensity (n>65 cells for each experimental condition). t test **P<0.01; ***P<0.001 and NS not statistically significant . (B) Representative confocal images of the protein expression of the multiligand receptor megalin (green) and EEA1 (red) in wild-type larvae, untreated ctns−/− larvae, and luteolin-treated (100 µM) ctns−/− larvae. Scale bar is 5 µm in all images. Quantitation of periluminal fluorescence intensity at the level of the proximal tubules of (C) megalin (n=8 larvae/group) and (D) EEA1 (n=4 larvae/group). Relative fluorescence intensities in quantitation graphs were referred to the untreated ctns−/− group, which was considered as 100%. t test *P<0.05; **P<0.01; and ***P<0.001. (E) Representative images of BSA uptake (red) in wild-type and Ctns−/− mPTCs under basal condition or treatment with 50 µM luteolin for 24 hours. Scale bar is 10 µm. Number of BSA-positive structures per cell was quantified; mean and SEM are shown in red (n>300 cells, one-way ANOVA followed by Bonferroni post hoc test, ***P<0.001 and NS not statistically significant).

Similar articles

Cited by

References

    1. Emma F, Nesterova G, Langman C, Labbé A, Cherqui S, Goodyer P, et al. .: Nephropathic cystinosis: An international consensus document. Nephrol Dial Transplant 29[Suppl 4]: iv87-iv94, 2014. - PMC - PubMed
    1. Kalatzis V, Cherqui S, Antignac C, Gasnier B: Cystinosin, the protein defective in cystinosis, is a H(+)-driven lysosomal cystine transporter. EMBO J 20: 5940–5949, 2001. - PMC - PubMed
    1. Gahl WA, Thoene JG, Schneider JA: Cystinosis. N Engl J Med 347: 111–121, 2002. - PubMed
    1. Brodin-Sartorius A, Tête MJ, Niaudet P, Antignac C, Guest G, Ottolenghi C, et al. .: Cysteamine therapy delays the progression of nephropathic cystinosis in late adolescents and adults. Kidney Int 81: 179–189, 2012. - PubMed
    1. Elmonem MA, Veys KR, Soliman NA, van Dyck M, van den Heuvel LP, Levtchenko E: Cystinosis: A review. Orphanet J Rare Dis 11: 47, 2016 - PMC - PubMed

Publication types

MeSH terms

LinkOut - more resources