. 2020 Oct;26(10):1360-1379.
doi: 10.1261/rna.075507.120. Epub 2020 Jun 5.

Prefoldin-like Bud27 influences the transcription of ribosomal components and ribosome biogenesis in Saccharomyces cerevisiae

Affiliations

Prefoldin-like Bud27 influences the transcription of ribosomal components and ribosome biogenesis in Saccharomyces cerevisiae

Verónica Martínez-Fernández et al. RNA. 2020 Oct.

Abstract

Understanding the functional connection that occurs for the three nuclear RNA polymerases to synthesize ribosome components during the ribosome biogenesis process has been the focal point of extensive research. To preserve correct homeostasis on the production of ribosomal components, cells might require the existence of proteins that target a common subunit of these RNA polymerases to impact their respective activities. This work describes how the yeast prefoldin-like Bud27 protein, which physically interacts with the Rpb5 common subunit of the three RNA polymerases, is able to modulate the transcription mediated by the RNA polymerase I, likely by influencing transcription elongation, the transcription of the RNA polymerase III, and the processing of ribosomal RNA. Bud27 also regulates both RNA polymerase II-dependent transcription of ribosomal proteins and ribosome biogenesis regulon genes, likely by occupying their DNA ORFs, and the processing of the corresponding mRNAs. With RNA polymerase II, this association occurs in a transcription rate-dependent manner. Our data also indicate that Bud27 inactivation alters the phosphorylation kinetics of ribosomal protein S6, a readout of TORC1 activity. We conclude that Bud27 impacts the homeostasis of the ribosome biogenesis process by regulating the activity of the three RNA polymerases and, in this way, the synthesis of ribosomal components. This quite likely occurs through a functional connection of Bud27 with the TOR signaling pathway.

Keywords: RNA polymerases; Saccharomyces cerevisiae; prefoldin-like; ribosome biogenesis; transcription.


Figures

FIGURE 1.
FIGURE 1.
Bud27 is required for the optimal synthesis and maturation of the rRNAs transcribed by RNA polymerase I. (A) Northern blot analysis of the pre- and mature rRNAs of the wild-type and bud27Δ strains. Cells were grown in YPD medium at 30°C and shifted to 37°C for 6 or 12 h. Total RNA was extracted and equal amounts (5 µg) were subjected to northern hybridization. Probes, in brackets, are described in Supplemental Table S2 and Supplemental Figure S2. 7S pre-rRNA is indicated by an asterisk. (B,C) The wild-type and bud27Δ strains were transformed with YCplac33 (CEN, URA3), grown at 30°C in SD-Ura to the mid-log phase and shifted to 37°C for 12 h. Cells were pulse-labeled with [5,6-3H]uracil for 2 min, followed by a chase with unlabeled uracil largely in excess for the indicated times. Total RNA was extracted from each sample and 20,000 c.p.m. were loaded and separated on 1.2% agarose-6% formaldehyde gel (B) or on 7% polyacrylamide-8 M urea gel (C) before being transferred to nylon membranes and visualized by fluorography. The positions of the different pre- and mature rRNAs are indicated. We assume that 7S pre-rRNAs correspond to the species labeled by an asterisk, which were only evident in bud27Δ cells. (D) RNA Pol I and Pol II occupancy (Rpb8-TAP occupancy) was analyzed by chromatin immunoprecipitation (ChIP) in the wild-type and bud27Δ cells containing a functional TAP-tagged version of Rpb8, which is a common subunit to the three RNA pols. Cells were grown in YPD at 30°C or shifted to 37°C for 12 h. RNA pols were precipitated using Dynabeads Pan Mouse IgG as described in the Materials and Methods. The occupancy on the rDNA unit was analyzed for the indicated amplicons. The values found for the immunoprecipitated PCR products were compared to those of the total input, and the ratio of each PCR product of transcribed genes to a nontranscribed region of chromosome V was calculated. The average and standard deviations of three biological replicates are shown. RNA Pol II occupancy on PMA1 gene (5′ and 3′ regions) was analyzed at 30°C. Statistical significance, by t-Student. (*) P < 0.05, (**) P < 0.005, (***) P < 001. The lowest right panel shows the processivity analysis of the data from RNA Pol I occupancy, at 37°C. (E) Wild-type and bud27Δ cells containing a functional TAP-tagged version of Spt5 were grown in YPD medium at 30°C or shifted to 37°C for 12 h. Whole-cell extracts were performed and subjected to pull-down with an anti-TAP resin. The obtained immunoprecipitates were analyzed by western blot with antibodies against TAP (Spt5), Rpa34.5 (RNA Pol I), Rpb1 (RNA Pol II), and Pgk1 as a control.
FIGURE 2.
FIGURE 2.
Bud27 is required for the optimal synthesis and maturation of 5S rRNA and tRNAs transcribed by RNA polymerase III. (A) Northern analyses of the selected pre- and mature tRNAs and 5S rRNA of wild-type and bud27Δ strains. Cells were grown in YPD medium at 30°C and shifted to 37°C for 12 h. Total RNA was extracted and equal amounts (5 µg) were subjected to northern hybridization. Probes, in brackets, are described in Supplemental Table S2. 7S pre-rRNAs are indicated by an asterisk. Note that the doublets shown in the pre-tRNA panels are different precursor forms of the corresponding tRNAs. (B) RNA Pol III occupancy (Rpb8-TAP occupancy) was analyzed by chromatin immunoprecipitation (ChIP) in the wild-type and bud27Δ cells containing a functional Rpb8-TAP tagged, which is a common subunit to the three RNA pols. Cells were grown in YPD at 30°C or shifted to 37°C for 12 h. RNA pols were precipitated using Dynabeads Pan Mouse IgG as described in Materials and Methods. Occupancy in the type 1 (5S rDNA), type 2 (tRNALeu, SUP56), and type 3 (SCR1) genes was analyzed. The values found for the immunoprecipitated PCR products were compared to those of the total input, and the ratio of each polymerase chain reaction (PCR) product of transcribed genes to a nontranscribed region of chromosome V was calculated. The average and standard deviations of three biological replicates are shown. Statistical significance, by t-Student. (**) P < 0.01, (***) P < 0.05.
FIGURE 3.
FIGURE 3.
Lesser accumulation of mRNAs of the RP genes in the absence of Bud27. (A) Analysis of the mRNA accumulation of several RP genes by RT-qPCR in the wild-type and bud27Δ strains. Cells were grown in YPD medium at 30°C and shifted to 37°C for 12 h. The mRNA levels of PYK1 were used as a control of a gene whose expression decreases and those of ACT1 as the control of a gene with no significant alteration. The used oligonucleotides are listed in Supplemental Table S1. (B) Analysis by RT-qPCR of the mRNA accumulation of the immature and mature forms of some intron-containing genes in the wild-type and bud27Δ strains. Cells were grown in YPD medium at 30°C and shifted to 37°C for 12 h. (C) Ratios for the immature versus mature forms of the genes analyzed in B.
FIGURE 4.
FIGURE 4.
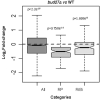
Comparison of the transcriptomic expression profile of the RP and RiBi genes from bud27Δ and wild-type yeast cells. Box plots showing the effects of BUD27 deletion on the expression levels of the indicated classes of genes. Statistical testing was done by the Wilcoxon test. Data represent the differentially expressed genes (more than twofold). Cells were grown in YPD at 30°C.
FIGURE 5.
FIGURE 5.
ChIP-seq analysis of Bud27 occupancy. (A) Heatmap of the input-normalized Bud27-TAP ChIP-seq signals over a region that includes the gene body 500 bp upstream of the transcription start site (TSS), and 500 bp downstream from the cleavage and polyadenylation sites (pA). The heatmap includes all the protein-coding genes with TSS and pA annotations. (B) The input-normalized average metagene profile of the occupancy of Bud27-TAP over gene bodies and flanking regions of all protein-coding genes from Figure 5A and the subsets of the RP (n = 129) and RiBi (n = 236) genes. (C) The same as in panel B for Rpb1 ChIP-seq. (D) The average metagene profile of the occupancy of Bud27-TAP over the gene bodies and flanking regions of all the protein-coding genes, separated by the nascent transcription rate level (nTR). Q1–Q4 indicates the nTR quartiles. D1 refers to the first nTR decile. (E) The average Rpb1 ChIP-seq occupancy change profile (bud27Δ /wt ratio) over the three groups of the analyzed genes.
FIGURE 6.
FIGURE 6.
Absence of Bud27 impairs translation and 60S r-subunit metabolism. Polysomes profile analysis of the wild-type and bud27Δ cells grown to the mid-log phase in YPD medium at 30°C and then shifted to 37°C for 6 h. Cells were harvested at an OD600 of about 0.8. Whole-cell extracts were prepared and 10 A260 units of each extract were resolved in 7%–50% sucrose gradients. A254 was continuously measured. Sedimentation goes from left to right. The peaks of the free 40S and 60S r-subunits, 80S vacant ribosomes or monosomes and polysomes, are indicated.
FIGURE 7.
FIGURE 7.
Global transcriptomic expression analysis of a bud27Δ mutant and rapamycin-treated wild-type cells. (A) Venn diagrams representing the differentially expressed genes (more than twofold) in the bud27Δ versus wild-type cells and the rapamycin-treated versus untreated wild-type cells. Cells were grown in YPD at 30°C. Rapamycin was added at the 400 ng/mL concentration. P-values are represented for each analyzed data set. (B) A correlation scatterplot showing the relation between the RNA-seq data of the bud27Δ versus wild-type cells and the rapamycin-treated versus untreated wild-type cells. The Spearman correlation coefficient is indicated. The color scale indicates the density of overlapping genes (from colder to warmer colors as density increases). (C) A similar correlation analysis as in B depicting the correlation coefficients of the RP, RiBi, and the other protein-coding genes, separately. Tendency lines are adjusted to the specific gene groups indicated by the color scheme.
FIGURE 8.
FIGURE 8.
The phosphorylation status of S6 is altered in the cells lacking Bud27. Western blot analysis of the phosphorylated (Rps6-P) and nonphosphorylated (Rps6) S6 RP in both the wild-type and bud27Δ mutant cells. Cells were grown in YPD medium at 30°C (time 0) or in YPD containing 400 ng/mL rapamycin for the indicated times. Anti-phospho (pSer235/236)-S6 RP and anti-S6 RP antibodies were used. Pgk1 was taken as the internal control.

Similar articles

Cited by

References

    1. Albert B, Knight B, Merwin J, Martin V, Ottoz D, Gloor Y, Bruzzone MJ, Rudner A, Shore D. 2016. A molecular titration system coordinates ribosomal protein gene transcription with ribosomal RNA synthesis. Mol Cell 64: 720–733. 10.1016/j.molcel.2016.10.003 - DOI - PubMed
    1. Anders S, Huber W. 2010. Differential expression analysis for sequence count data. Genome Biol 11: R106 10.1186/gb-2010-11-10-r106 - DOI - PMC - PubMed
    1. Anderson SJ, Sikes ML, Zhang Y, French SL, Salgia S, Beyer AL, Nomura M, Schneider DA. 2011. The transcription elongation factor Spt5 influences transcription by RNA polymerase I positively and negatively. J Biol Chem 286: 18816–18824. 10.1074/jbc.M110.202101 - DOI - PMC - PubMed
    1. Angus-Hill ML, Schlichter A, Roberts D, Erdjument-Bromage H, Tempst P, Cairns BR. 2001. A Rsc3/Rsc30 zinc cluster dimer reveals novel roles for the chromatin remodeler RSC in gene expression and cell cycle control. Mol Cell 7: 741–751. 10.1016/S1097-2765(01)00219-2 - DOI - PubMed
    1. Ausubel FM, Brent R, Kingston RE, Moore DD, Seidman JG, Smith JA, Struhl K. 1994. Current protocols in molecular biology, pp. 13.10.11–13.14.17. Wiley, New York.

Publication types

MeSH terms