. 2020 Jun;8(1):e000266.
doi: 10.1136/jitc-2019-000266.

Nectin4 is a novel TIGIT ligand which combines checkpoint inhibition and tumor specificity

Affiliations

Nectin4 is a novel TIGIT ligand which combines checkpoint inhibition and tumor specificity

Adi Reches et al. J Immunother Cancer. 2020 Jun.

Abstract

Background: The use of checkpoint inhibitors has revolutionized cancer therapy. Unfortunately, these therapies often cause immune-related adverse effects, largely due to a lack of tumor specificity.

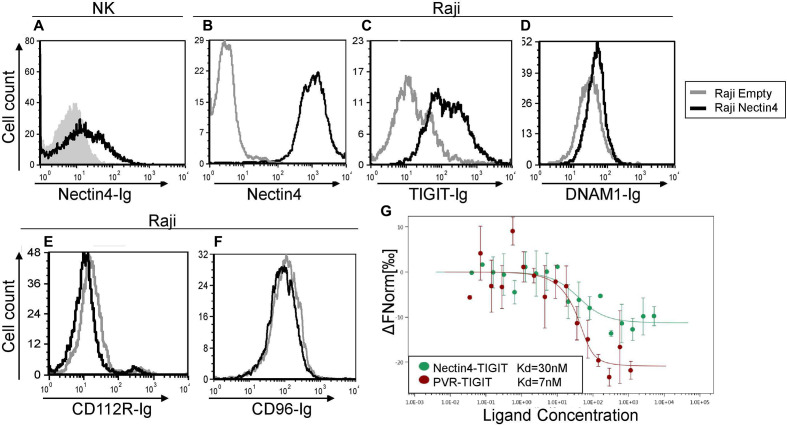
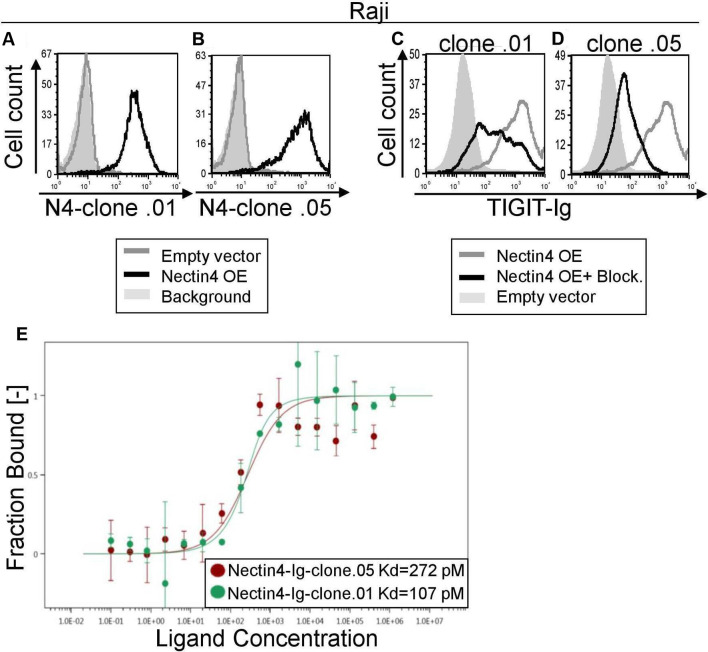
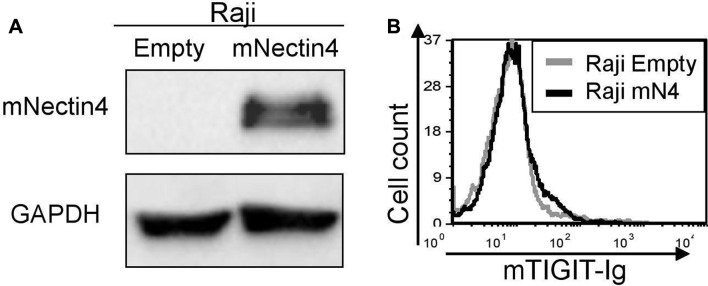
Methods: We stained human natural killer cells using fusion proteins composed of the extracellular portion of various tumor markers fused to the Fc portion of human IgG1, and identified Nectin4 as a novel TIGIT ligand. Next, we generated a novel Nectin4 blocking antibody and demonstrated its efficacy as a checkpoint inhibitor in killing assays and in vivo.

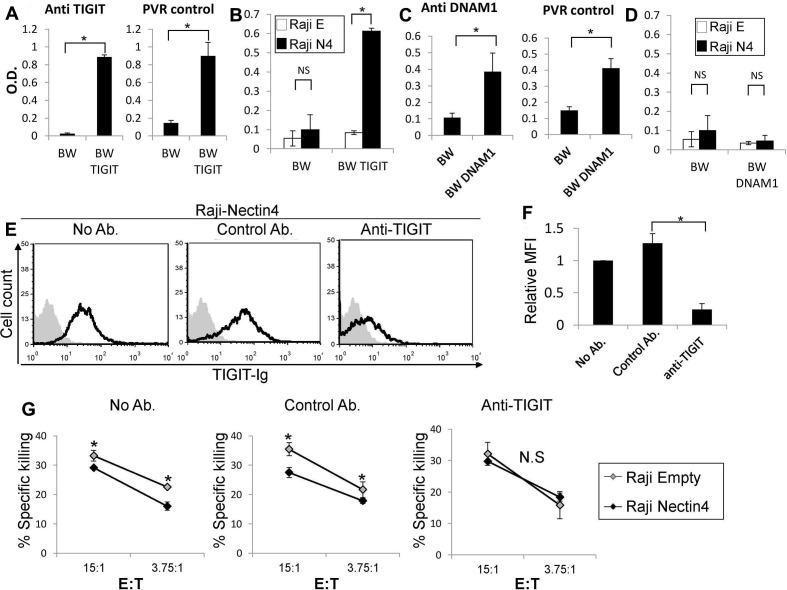
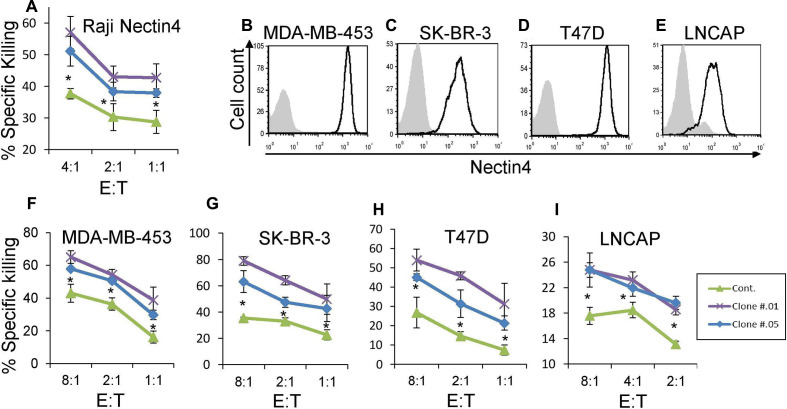
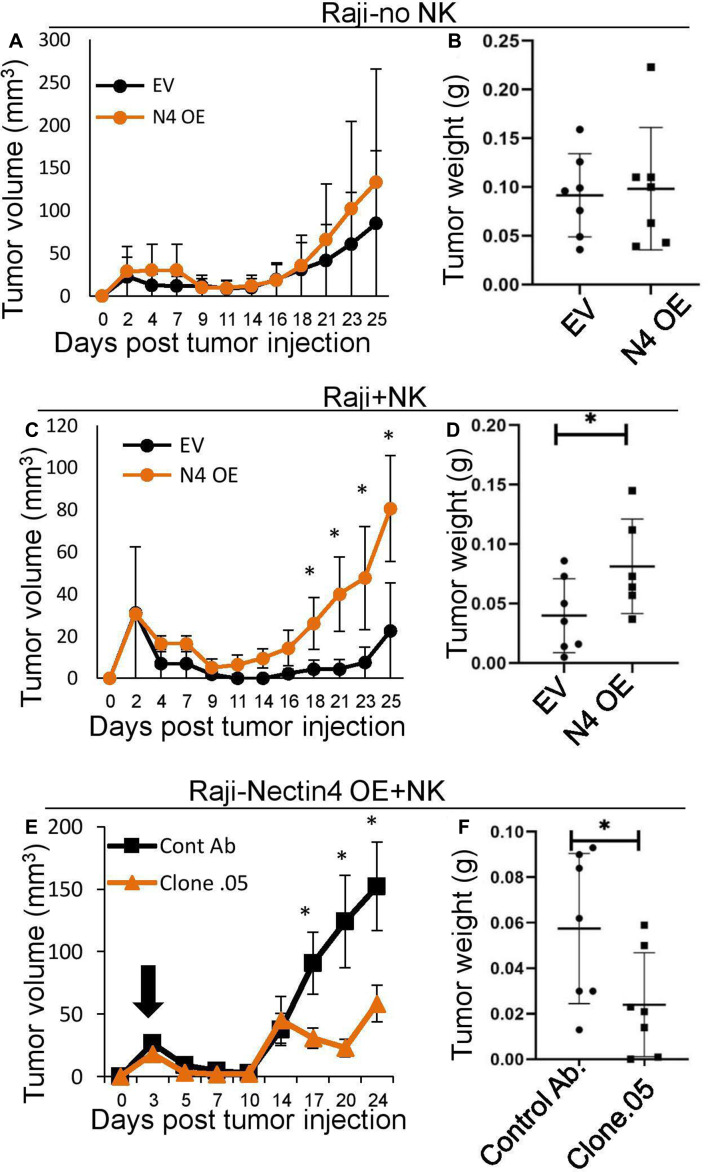
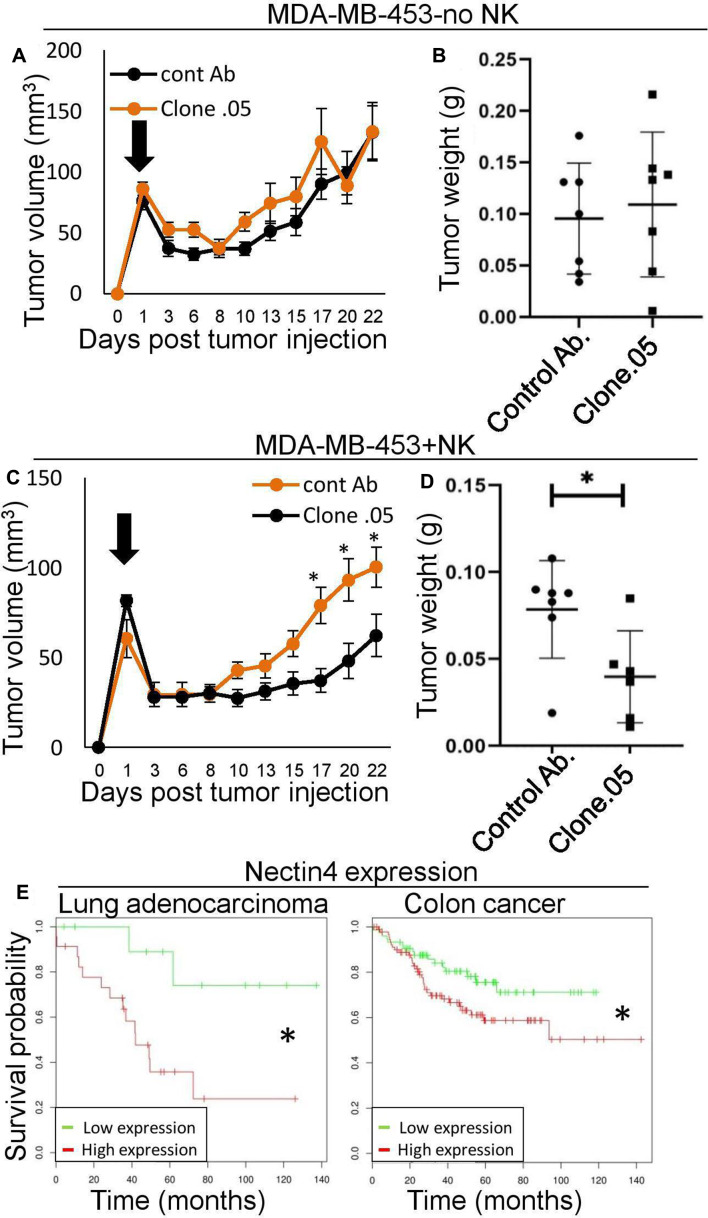
Results: We identify Nectin4 to be a novel ligand of TIGIT. We showed that, as opposed to all other known TIGIT ligands, which bind also additional receptors, Nectin4 interacts only with TIGIT. We show that the TIGIT-Nectin4 interaction inhibits natural killer cell activity, a critical part of the innate immune response. Finally, we developed blocking Nectin4 antibodies and demonstrated that they enhance tumor killing in vitro and in vivo.

Conclusion: We discovered that Nectin4 is a novel ligand for TIGIT and demonstrated that specific antibodies against it enhance tumor cell killing in vitro and in vivo. Since Nectin4 is expressed almost exclusively on tumor cells, our Nectin4-blocking antibodies represent a combination of cancer specificity and immune checkpoint activity, which may prove more effective and safe for cancer immunotherapy.

Keywords: immunology.


Conflict of interest statement

Competing interests: None declared.

Figures

Figure 1
Figure 1
TIGIT but not DNAM1, CD112R or CD96—interacts with Nectin4. (A) FACS staining of IL-2 activated primary NK cells with Nectin4-Ig. Gray filled histogram represents background staining with secondary antibody only; black line histogram represents specific binding as indicated. (B–F) FACS staining of Raji cells transfected either with an empty vector as control (gray histograms) or with Nectin4 (black histograms). Cells were stained with commercial anti-Nectin4 mAb (B), TIGIT-Ig (C), DNAM1-Ig (D), CD112-Ig (E) or CD96-Ig (F). Figures show one representative experiment out of three performed. Graph depicting the mean fluorescence intensity values of the stainings appears in online supplementary figure 2. (G) Direct binding of Nectin4 to TIGIT. The binding of fluorophore-labeled TIGIT-Ig and its ligands PVR-Ig (red) and Nectin4-Ig (green) was determined using MST. Measurements were repeated with at least three independent protein preparations. FACS, fluorescence-activated cell sorting; IL-2, interleukin-2; MST, microscale thermophoresis; NK, natural killer.
Figure 2
Figure 2
Nectin4 inhibits NK cytotoxicity via TIGIT. (A, C) IL2 secretion by parental BW (A, C), (A) BW-TIGIT and (C) BW-DNAM1 cells. IL2 secretion was determined by ELISA (od 650 nm) following incubation with control anti-TIGIT or anti-DNAM1 antibodies (left in a and C) or with PVR expressing cells (right in a and C). (B, D) IL2 secretion of parental BW (B, D), (B) BW-TIGIT and (D) BW-DNAM1 cells. IL2 secretion was determined by ELISA (od 650 nm) following incubation with Raji cells transfected either with an empty vector (Raji E) as a control, or with Nectin4 (Raji N4). Figure shows one representative experiment out of 3 performed. *P<0.05. (E) FACS staining of Raji cells overexpressing Nectin4 with TIGIT-Ig. TIGIT-Ig was preincubated with no antibody (left), with a control mAb (anti-CD99 mAb clone 12E7, middle) or with anti-TIGIT blocking antibody (mAb #4 generated as described previously, right). Black line histograms represent TIGIT-Ig binding. Gray filled histograms represent background staining of the secondary antibody only. (F) Mean fluorescence intensity (MFI) values of the TIGIT-Ig staining shown in (E) relative to NO antibody staining, *p<2×10⁻⁴. (G) [35S] methionine-labeled Raji cells transfected either with an empty vector as control (Raji empty—gray) or with Nectin4 (Raji Nectin4—black), were incubated for 5 hours with NK cells. NK cells were preincubated with no antibody (left), with a control antibody (anti-CD99 mAb clone 12E7, middle) or with an anti-TIGIT antibody (mAb #4 generated as described previously, right). The effector to target (E:T) ratios are indicated on the x-axis. Figure shows one representative experiment out of three performed. Shown is the relative average killing ±SD, *p<0.05. FACS, fluorescence-activated cell sorting; IL2, interleukin-2; NK, natural killer; NS, not significant.
Figure 3
Figure 3
Novel checkpoint inhibitor anti-Nectin4 antibodies block TIGIT binding. (A, B) FACS staining of Raji cells transfected either with an empty vector (gray histograms) or with Nectin4 over-expression (black histograms). Gray filled histograms represent background staining of secondary antibody only. Cells were stained with anti-Nectin4 mAb clone .01 (A) or clone .05 (B). (C, D) FACS staining with TIGIT-Ig of Raji overexpressing Nectin4 with (black histograms) or without (gray histograms) preincubation with anti-Nectin4 mAb clone .01 (C) or clone .05 (D). Gray, filled histograms represent background staining. Figures show one representative experiment out of three performed. Graph depicting the mean fluorescence intensity values of the stainings appears in online supplementary figure 3a–d. (E) Avidity quantification between Nectin4-Ig and anti-Nectin4 mAb clone .01 and clone .05 using MST. Measurements were repeated with at least three independent protein preparations. FACS, fluorescence-activated cell sorting; MST, microscale thermophoresis
Figure 4
Figure 4
Anti-Nectin4 antibodies increase NK cytotoxicity. (A) [35S] methionine-labeled Raji cells transfected with Nectin4 were incubated with 1 µg/well of either mouse IgG1 as control Ab (green) or with clone .01 (purple) or clone .05 (blue) for 1 hour and then incubated with activated human NK cells for 5 hours. The effector to target (E:T) ratios are indicated on the X-axis. Figure shows one representative experiment out of three performed. Shown is the relative average killing ±SD., *p<0.05 (significance between the clones’ blocking and control antibody blocking). (B–E) FACS staining of cell lines stained with commercial anti-Nectin4 antibody (black line histograms). Gray filled histograms are background staining with secondary antibody only. Cell lines used are MDA-MB-453 (B), SK-BR-3 (C), T47D (D) and LNCaP (E). Figures show one representative experiment out of three performed. Graph depicting the mean fluorescence intensity values of the stainings appears in online supplementary figure 3e–h. (F–I) [35S] methionine-labeled MDA-MB-453 (F), SK-BR-3 (G), T47D (H), and LNCaP (I) cells were incubated with either mouse IgG1 as control mAb (green) or with clone .01 (purple) or clone .05 (blue) for 1 hour and then incubated with activated human NK cell cultures for 5 hours. The E:T ratios are indicated on the X-axis. Figures show one representative experiment out of three performed. Shown is the relative average killing ±SD., *p<0.05 (significance between the clones’ blocking and the control antibody). FACS, fluorescence-activated cell sorting; NK, natural killer.
Figure 5
Figure 5
Murine Nectin4 does not bind murine TIGIT. (A) Overexpression of murine Nectin4 (indicated as mNectin4) on Raji cells. Western blots were performed with antimurine Nectin4 AB and expression was compared with Raji cells expressing empty vector (indicated as empty). Staining for GAPDH was used as a loading control. (B) FACS staining of Raji cells transfected either with an empty vector as control (gray histograms), or with murine Nectin4 (black histograms). Cells were stained with murine TIGIT-Ig. Figures show one representative experiment out of three performed. Graph depicting the mean fluorescence intensity values of the stainings appears in online supplementary figure 4 FACS, fluorescence-activated cell sorting.
Figure 6
Figure 6
In vivo effect of anti-Nectin4 mAb on tumors overexpressing Nectin4. (A–D) SCID-beige mice were subcutaneously implanted with 5×10⁶ Raji cells either overexpressing Nectin4 (N4 oe) or empty vector (EV) either alone (A, B) or with 1×10⁶ NK cells (C, D). (E, F) SCID-beige mice were subcutaneously implanted with 5×10⁶ Raji cells overexpressing Nectin4 (N4 oe) and 1×10⁶ NK cells. Mice were then treated with either anti-Nectin4 clone .05 mAb (clone .05) and or a control Ab. (A, C, E) Tumor growth was followed with standard caliper. Starting day of antibody treatment is marked by a black arrow. Tumor volumes were calculated by the formula: length×width2×0.5. (B, D, F) Tumors ware harvested and weighed on day 21 (B, D) or 27 (F) post tumor injection. For all murine experiments n=7. *p<0.05. NK, natural killer.
Figure 7
Figure 7
The checkpoint inhibitor anti-Nectin4 mAb enhances NK killing of tumors expressing all ligands of TIGIT in vivo. (A–D) SCID-beige mice were subcutaneously implanted with 5×10⁶ MDA-MB-453 cells either alone (A, B) or with 7×10⁵ NK cells (C, D). Half of each group was treated with anti-Nectin4 clone .05 mAb (clone.05) or a control Ab. (A, C) Tumor growth was followed with standard caliper. starting day of antibody treatment is marked by a black arrow. Tumor volumes were calculated by the formula: length×width2×0.5. (B, D) Tumors ware harvested and weighed on day 23 post-tumor injection. For all murine experiments n=7. *P<0.05. (E) Kaplan-Meier curves of lung adenocarcinoma patients (left, Geo dataset ID: GSE36471) and colon cancer patients (right, Geo dataset ID: GSE17538) after stratification by Nectin4 expression level. *P<0.05. Data were obtained from DRUGSURV. NK, natural killer

References

    1. Wang DY, Salem J-E, Cohen JV, et al. . Fatal toxic effects associated with immune checkpoint inhibitors. JAMA Oncol 2018;4:1721 10.1001/jamaoncol.2018.3923 - DOI - PMC - PubMed
    1. Stein N, Tsukerman P, Mandelboim O. The paired receptors TIGIT and DNAM-1 as targets for therapeutic antibodies. Hum Antibodies 2017;25:111–9. 10.3233/HAB-160307 - DOI - PubMed
    1. Josefsson SE, Huse K, Kolstad A, et al. . T cells expressing checkpoint receptor TIGIT are enriched in follicular lymphoma tumors and characterized by reversible suppression of T-cell receptor signaling. Clin Cancer Res 2018;24:870–81. 10.1158/1078-0432.CCR-17-2337 - DOI - PMC - PubMed
    1. Yu X, Harden K, C Gonzalez L, et al. . The surface protein TIGIT suppresses T cell activation by promoting the generation of mature immunoregulatory dendritic cells. Nat Immunol 2009;10:48–57. 10.1038/ni.1674 - DOI - PubMed
    1. Kučan Brlić P, Lenac Roviš T, Cinamon G, et al. . Targeting Pvr (CD155) and its receptors in anti-tumor therapy. Cell Mol Immunol 2019;16:40–52. 10.1038/s41423-018-0168-y - DOI - PMC - PubMed

Publication types

LinkOut - more resources