. 2020 Jun 5;11(1):2850.
doi: 10.1038/s41467-020-16591-0.

Multi-trait analysis of rare-variant association summary statistics using MTAR

Affiliations

Multi-trait analysis of rare-variant association summary statistics using MTAR

Lan Luo et al. Nat Commun. .

Abstract

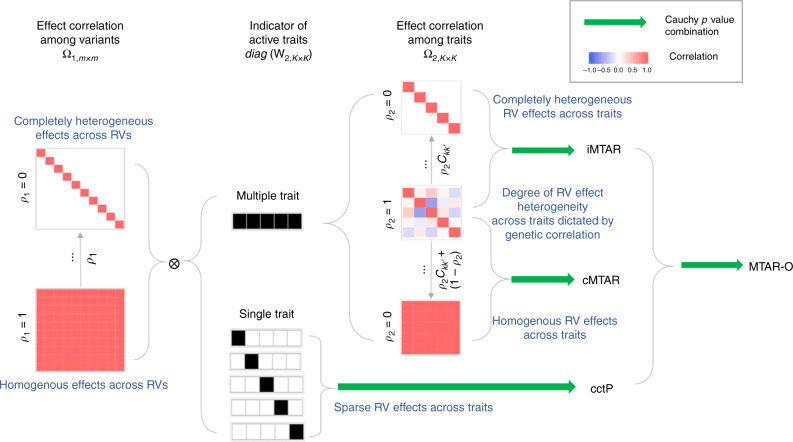
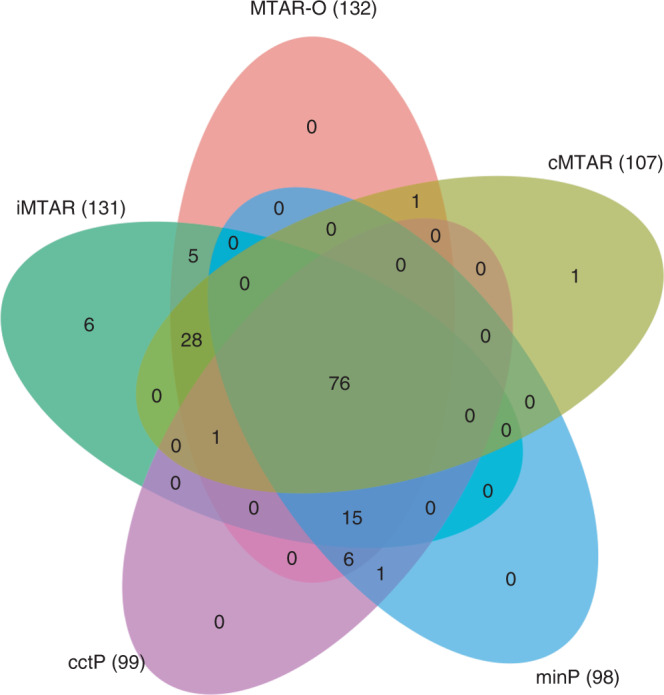
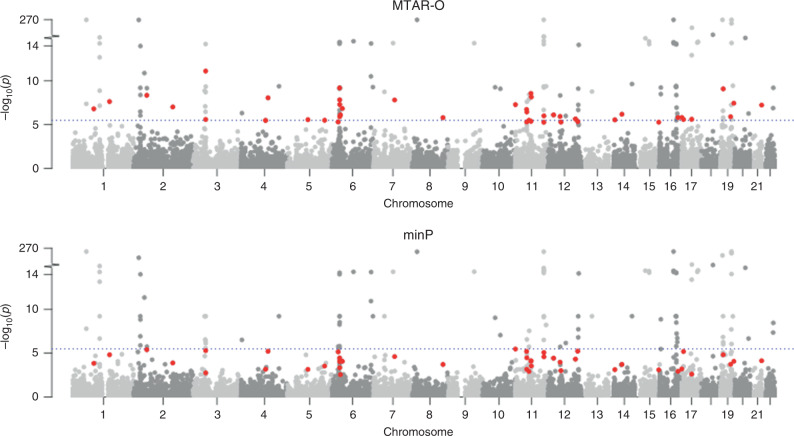
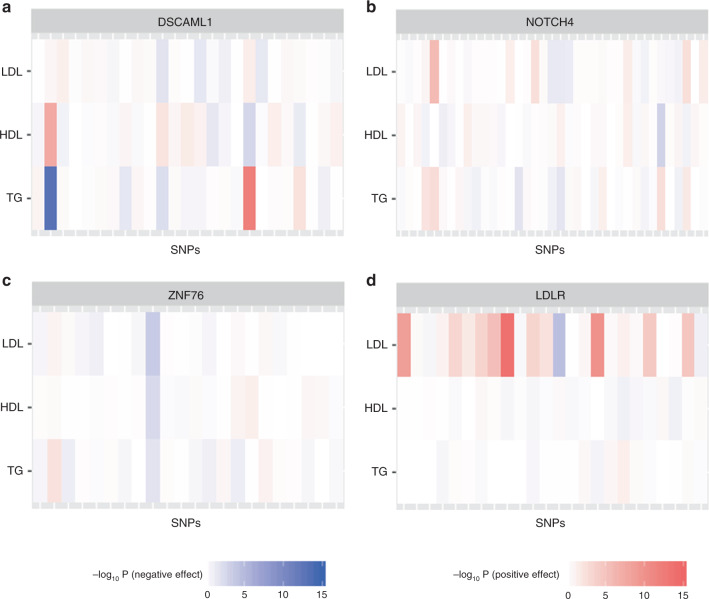
Integrating association evidence across multiple traits can improve the power of gene discovery and reveal pleiotropy. Most multi-trait analysis methods focus on individual common variants in genome-wide association studies. Here, we introduce multi-trait analysis of rare-variant associations (MTAR), a framework for joint analysis of association summary statistics between multiple rare variants and different traits. MTAR achieves substantial power gain by leveraging the genome-wide genetic correlation measure to inform the degree of gene-level effect heterogeneity across traits. We apply MTAR to rare-variant summary statistics for three lipid traits in the Global Lipids Genetics Consortium. 99 genome-wide significant genes were identified in the single-trait-based tests, and MTAR increases this to 139. Among the 11 novel lipid-associated genes discovered by MTAR, 7 are replicated in an independent UK Biobank GWAS analysis. Our study demonstrates that MTAR is substantially more powerful than single-trait-based tests and highlights the value of MTAR for novel gene discovery.


Conflict of interest statement

J.S., H.Z., A.C., and D.V.M. are employees at Merck Sharp & Dohme Corp., a subsidiary of Merck & Co., Inc., Kenilworth, NJ, USA. The remaining authors declare no competing interests.

Figures

Fig. 1
Fig. 1. Summary of methods under MTAR framework.
In this illustration, the number of variants is m = 10 and the number of traits is K = 5. The degree of heterogeneity of among-variant effects is controlled by ρ1. MTAR methods are robust to various patterns of genetic effects across variants by combining variance-component test P-values from different specifications of ρ1. The degree of heterogeneity of among-trait effects is controlled by ρ2. By changing the value of ρ2, the degree of heterogeneity of among-trait effects can be weakly, moderately, or strongly dictated by genetic correlation Ckk. By setting ρ2 = 0, iMTAR and cMTAR structures assume genetic effects become completely heterogeneous and homogeneous, respectively. MTAR methods are robust to various patterns of genetic effects across traits by combining variance-component test P-values from different specifications of ρ2. The cctP that combines the single-trait burden and SKAT tests P-values is particularly powerful when only a small number of traits are associated with the set of rare variants. The omnibus test MTAR-O that combines iMTAR, cMTAR, and cctP is robust to all the aforementioned patterns of genetic effects across traits and variants.
Fig. 2
Fig. 2. Venn diagram of significant genes in the GLGC data analysis.
MTAR-O, cMTAR, iMTAR, cctP, and minP test are performed and the number of significant genes identified by each method is shown in the parentheses.
Fig. 3
Fig. 3. Manhattan plots of MTAR-O and minP results in the GLGC data analysis.
The horizontal line marks the genome-wide significance threshold (3.3 × 10−6). The 41 genes highlighted in red are those exclusively discovered by MTAR tests (MTAR-O, cMTAR, and iMTAR). The Manhattan plots for the other methods (cMTAR, iMTAR, and cctP) are shown in Supplementary Fig. 2.
Fig. 4
Fig. 4. Heat maps of association signals in the GLGC data for four example genes.
The darkness of the color indicates the variant-level Z-test P-values (in −log10 scale) for individual traits LDL, HDL, and TG. The positive and negative Z-scores are indicated by red and blue colors, respectively. a The effect correlations among traits resemble their genetic correlations. b The effects are independent among traits. c The effects are similar among traits. d Association signal resides in a single trait.
Fig. 5
Fig. 5. Power comparisons of MTAR-O, cMTAR, iMTAR, cctP, and minP.
Each bar represents the empirical power for a method estimated as the proportion of P-values < 2.5 × 10−6 based on 104 replicates. The percentage of causal variants is set to be 20% or 50%, which corresponds to the two rows. The left column assumes the effects of the causal variants have the same direction, whereas the right column assumes the effect directions are randomly determined with an equal probability. The effect sizes (|βkj|’s) of the causal variants have a decreasing relationship with MAF as |βkj| = d|log10 MAFj|, where the constant d depends on the percentage of causal variants and the direction of their effects (the value of d is presented in each subfigure). For each configuration in a subfigure, five patterns of among-trait effects are considered.

References

    1. Goh K-I, et al. The human disease network. Proc. Natl Acad. Sci. USA. 2007;104:8685–8690. - PMC - PubMed
    1. Solovieff N, Cotsapas C, Lee PH, Purcell SM, Smoller JW. Pleiotropy in complex traits: challenges and strategies. Nat. Rev. Genet. 2013;14:483–495. - PMC - PubMed
    1. He Q, Avery CL, Lin DY. A general framework for association tests with multivariate traits in large-scale genomics studies. Genet. Epidemiol. 2013;37:759–767. - PMC - PubMed
    1. Kim J, Bai Y, Pan W. An adaptive association test for multiple phenotypes with GWAS summary statistics. Genet. Epidemiol. 2015;39:651–663. - PMC - PubMed
    1. Zhu X, et al. Meta-analysis of correlated traits via summary statistics from GWASs with an application in hypertension. Am. J. Hum. Genet. 2015;96:21–36. - PMC - PubMed

Publication types