. 2020 Jun 5;11(1):2856.
doi: 10.1038/s41467-020-16625-7.

Transcriptomics and proteomics reveal a cooperation between interferon and T-helper 17 cells in neuromyelitis optica

Affiliations

Transcriptomics and proteomics reveal a cooperation between interferon and T-helper 17 cells in neuromyelitis optica

Agnieshka M Agasing et al. Nat Commun. .

Abstract

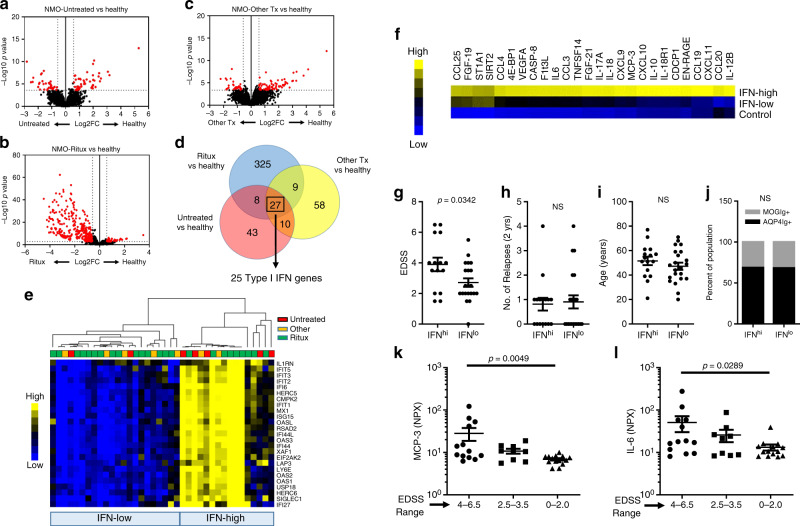
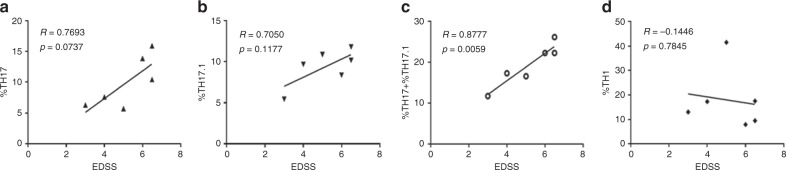
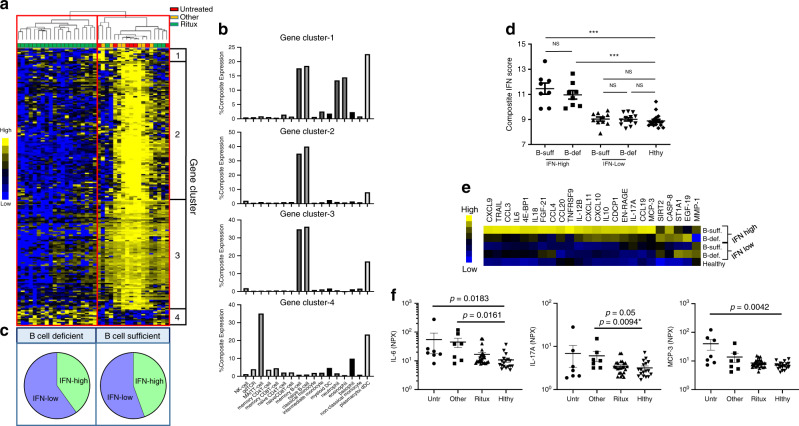
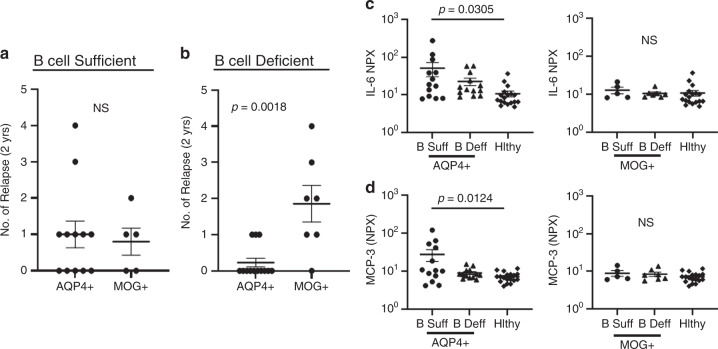
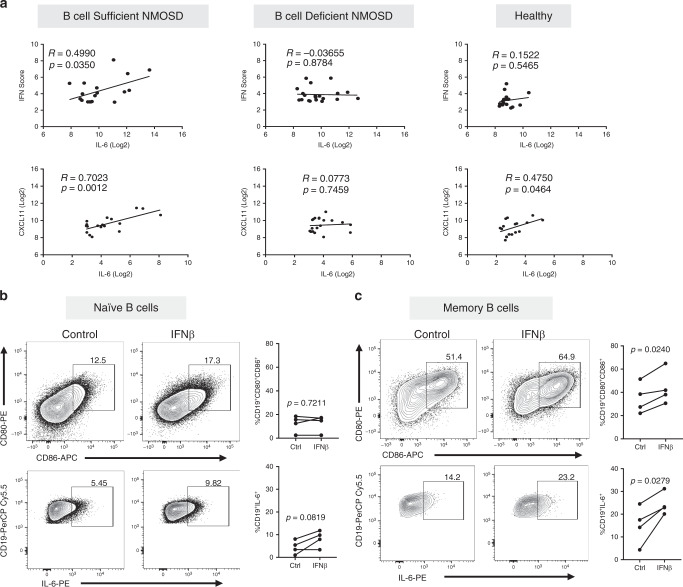
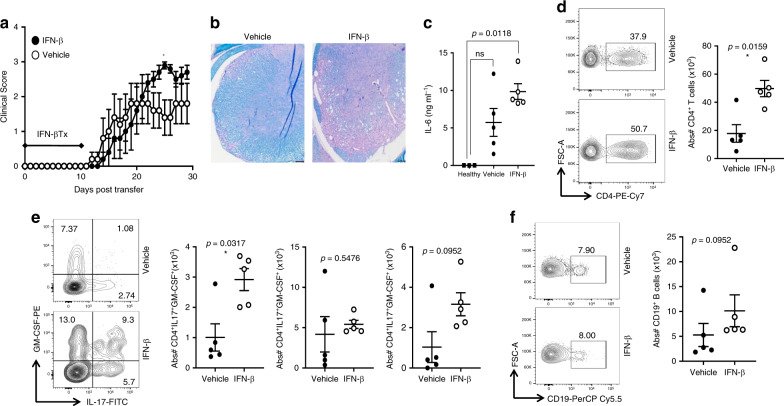
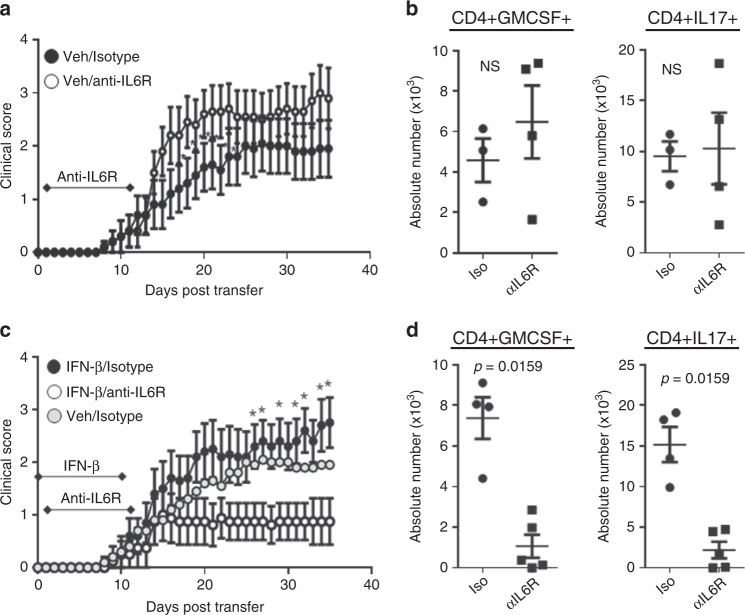
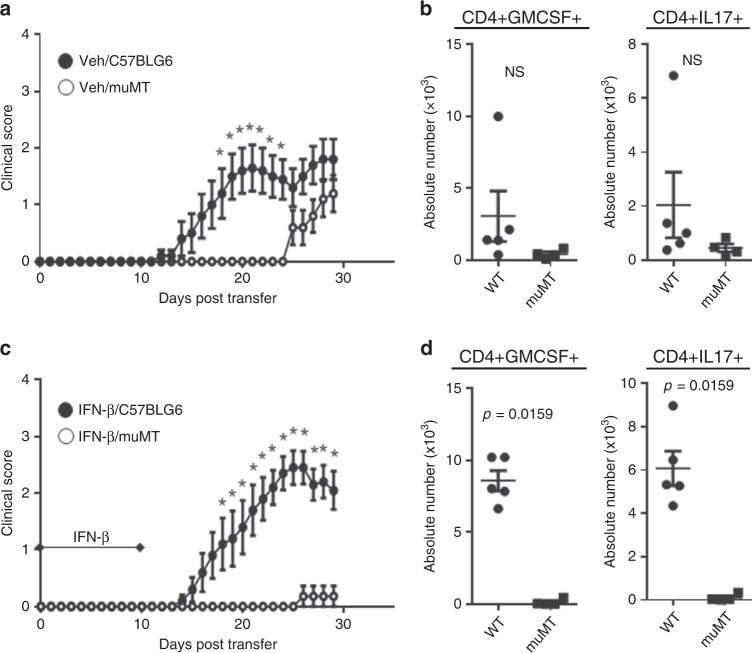
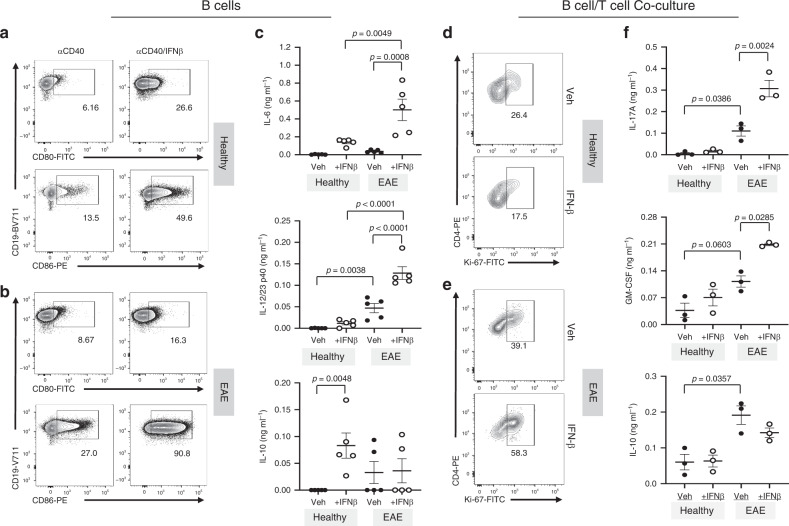
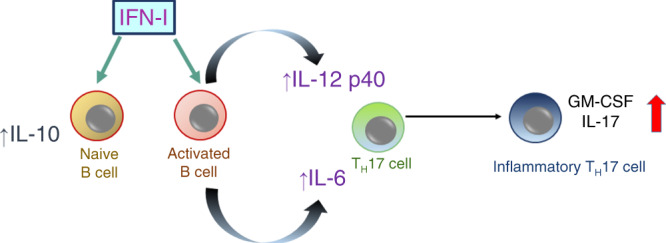
Type I interferon (IFN-I) and T helper 17 (TH17) drive pathology in neuromyelitis optica spectrum disorder (NMOSD) and in TH17-induced experimental autoimmune encephalomyelitis (TH17-EAE). This is paradoxical because the prevalent theory is that IFN-I inhibits TH17 function. Here we report that a cascade involving IFN-I, IL-6 and B cells promotes TH17-mediated neuro-autoimmunity. In NMOSD, elevated IFN-I signatures, IL-6 and IL-17 are associated with severe disability. Furthermore, IL-6 and IL-17 levels are lower in patients on anti-CD20 therapy. In mice, IFN-I elevates IL-6 and exacerbates TH17-EAE. Strikingly, IL-6 blockade attenuates disease only in mice treated with IFN-I. By contrast, B-cell-deficiency attenuates TH17-EAE in the presence or absence of IFN-I treatment. Finally, IFN-I stimulates B cells to produce IL-6 to drive pathogenic TH17 differentiation in vitro. Our data thus provide an explanation for the paradox surrounding IFN-I and TH17 in neuro-autoimmunity, and may have utility in predicting therapeutic response in NMOSD.


Conflict of interest statement

R.C.A. has consulted for Roche, Biogen, and EMD serono. Y.M.-D. has consulted for and/or received grant support from: Acorda, Bayer Pharmaceutical, Biogen Idec, EMD Serono, Genzyme, Novartis, Questor, Genentech, and Teva Neuroscience. F.P. has consulted for and/or received speaker honoraria from Bayer, Teva, Genzyme, Merck, Novartis, and MedImmune. All other authors declare no competing interests.

Figures

Fig. 1
Fig. 1. NMOSD patients stratify into two groups based on IFN-I gene expression.
RNA profiles of a untreated patients (NMO-untreated; n = 7), b Rituximab-treated patients (NMO-Ritux; n = 24) and c patients on other therapies (NMO-Other Tx; n = 7) were compared with healthy volunteers (n = 18). d Venn diagram of differentially expressed genes of the NMO-Untreated vs healthy, NMO-Ritux vs healthy, and NMO-Other Tx vs healthy. e Heatmap depicts relative levels of IFN-I genes in NMOSD patients (Red = NMO-Untreated, Yellow = NMO-Other Tx, Green = NMO-Ritux). Patients were stratified into two groups, IFN-low and IFN-high, based on IFN-I gene expression. Yellow represents relative high expression and blue represents relative low expression. f Heatmap depicts the differentially abundant serum proteins in IFN-high NMOSD (N = 16), IFN-low NMOSD (n = 22), and healthy controls (n = 18). Yellow represents relative high serum levels; blue represents relative low serum levels. Comparison of g disability (EDSS), h number of relapses 2 years prior to sample collection, i age, and j autoantibody status of IFN-high and IFN-low NMOSD patients. Two-tailed Student’s t tests and Chi-square tests were used to determine statistical significance. k MCP-3 and l IL-6 levels in NMOSD patients of different EDSS range (EDSS 4–6.5: n = 15, EDSS 2.5–3.5: n = 9, EDSS 0–2: n = 16). P values were determined using two-tailed Kruskal–Wallis tests with multiple comparisons corrected by the Dunn’s method. Bar graphs represent the mean and error bars are the S.E.M. Source data are provided as a Source Data file.
Fig. 2
Fig. 2. Correlation between TH17 and disability in NMOSD patients.
Correlations between EDSS and a %TH17, b %TH17.1, c %TH17 + %TH17.1, and d %TH1 cells in NMOSD patients (n = 6). Two-tailed Pearson correlations were used to determine statistical significance. P values < 0.05 were considered significant and P values > 0.05 were not significant.
Fig. 3
Fig. 3. Effects of B-cell-depleting therapy (BCDT) in IFN-high and IFN-low NMOSD patients.
a Heatmap depicts the hierarchical clustering of NMOSD patients (Red = NMO-Untreated, Yellow = NMO-Other Tx, Green = NMO-Ritux) based on differentially expressed genes (DEGs) of patients treated with rituximab (n = 24) compared with patients not treated with rituximab (n = 14). Hierarchical clustering of the DEGs grouped genes into four clusters (Gene clusters 1–4). Yellow represents elevated gene expression and blue represents reduced gene expression. b Percent expression of genes in clusters 1–4 per cell type. c Stratification of NMOSD patients into two groups, defined as B-cell-deficient and B-cell-sufficient, based on gene expression and pie chart depicting the distribution of IFN-high and IFN-low NMOSD patients in the B-cell-deficient and B-cell-sufficient groups. d Composite IFN scores (average read count of IFN-I genes) of B-cell-sufficient IFN-high patients (n = 8), B-cell-deficient IFN-high patients (n = 8), B-cell-sufficient IFN-low patients (n = 10), B-cell-deficient IFN-low patients (n = 12) and healthy individuals (n = 18). e Heatmap indicating relative protein levels in IFN-high and IFN-low NMOSD patients from B-cell-sufficient or B-cell-deficient groups. f Serum protein levels of IL-6, IL-17A, and MCP-3 in untreated (n = 7), Other-treated (n = 7), and rituximab-treated NMOSD (n = 24) patients compared with healthy controls (n = 18). P values were determined using two-tailed Kruskal–Wallis tests with multiple comparisons corrected by the Dunn’s method or by a two-tailed Mann–Whitney test indicated with an *.
Fig. 4
Fig. 4. Effects of B-cell depletion on AQP4-Ig + and MOG-Ig + NMOSD.
a Comparison of relapse rates in AQP4-Ig + (n = 12) and MOG-Ig+ NMOSD (n = 5) who are B-cell-sufficient. b Comparison of relapse rates in AQP4-IgG+ (n = 13) and MOG-IgG+ (n = 7) NMOSD who are B-cell-deficient. P values were determined using two-tailed Mann–Whitney tests. Serum c IL-6 and d MCP-3 levels in B cell-sufficient AQP4-IgG+ patients (n = 13), B-cell-deficient AQP4-IgG+ patients (n = 13), B-cell-sufficient MOG-IgG+ patients (n = 5) and B-cell-deficient MOG-IgG+ patients (n = 7) were compared with healthy controls (n = 18). P values were determined using one-way ANOVA tests with multiple comparisons corrected by the Tukey’s method. Error bars indicate the S.E.M. Source data are provided as a Source Data file.
Fig. 5
Fig. 5. Type I IFN drives IL-6 production in human memory B cells.
a Correlation between composite IFN scores and serum CXCL11 levels with IL-6 in B cell-sufficient NMOSD patients (n = 18), B-cell-deficient NMOSD patients (n = 20) and healthy volunteers (n = 18). R and p values were determined using two-tailed Pearson correlation coefficient tests. Direct effect of IFN-β on human naive and memory B cells was assessed by stimulating purified human naïve (CD27) and memory B cells (CD27+) from healthy donors (n = 4) with CD40L, anti-Ig ± IFN-β. Representative flow cytometric plots and frequency of live b naive CD19+ B cells and c memory B cells expressing CD80, CD86, and IL-6 are shown. Statistical significance was determined using two-tailed Student t tests. P values <0.05 were considered significant.
Fig. 6
Fig. 6. IFN-β elevates IL-6 and exacerbates TH17-driven EAE.
MOG-primed TH17 cells were transferred into recipient mice and treated with 1000 U of IFN-β or vehicle every other day from day 0–10 post transfer of cells. a Clinical scores of mice with TH17-EAE treated with vehicle or IFN-β; (TH17-vehicle n = 5, TH17-IFN-β n = 5) and two-tailed Mann–Whitney tests were performed to determine statistical significance (*P < 0.05). Representative of four experiments with similar results. b Spinal cord sections from mice (day 30) were stained with H&E and Luxol fast blue. Representative images of four mice in each group. Scale bar represents 100 µm. c Levels of IL-6 in the sera (measured by ELISA) of TH17-EAE (day 2) were elevated with IFN-β; (TH17-vehicle n = 5, TH17-IFN-β n = 5, healthy n = 3) and a two-tailed Kruskal–Wallis test with multiple comparisons corrected by the Dunn’s method was used to determine statistical significance. d Representative flow cytometry plots and absolute numbers of live CD4+ T cells in the spinal cords of EAE mice, 30 days post transfer. e Representative flow cytometry plots and absolute numbers of CD4+ T cells expressing IL-17, GM-CSF or both in the spinal cords of EAE mice. f Representative flow cytometry plots and absolute numbers of live CD19+ B cells in the spinal cords of EAE mice. (TH17-vehicle n = 5, TH17-IFN-β n = 5) and two-tailed Mann–Whitney tests were performed to determine statistical significance. Error bars indicate the S.E.M. Source data are provided as a Source Data file.
Fig. 7
Fig. 7. IL-6 blockade attenuates IFN-β-treated TH17-EAE.
TH17-EAE mice, either treated with IFN-β or vehicle, were also treated with either anti-IL-6R or an isotype control every 5 days from days 1–11. a Effect of treatment with anti-IL-6R (n = 10) or isotype (n = 10) control on the clinical scores of vehicle-treated TH17-EAE. Data were pooled from two independent experiments. b Number of CD4+ T cells that express GM-CSF and IL-17 in spinal cords of vehicle-treated mice (day 35). c Effect of anti-IL-6R (n = 8) or isotype (n = 10) treatment on the clinical scores of IFN-β-treated TH17-EAE. Data were pooled from two independent experiments. Vehicle/isotype treated mice were also plotted for reference. d Number of CD4+ T cells that express GM-CSF and IL-17 in the spinal cords of IFN-β-treated EAE mice (day 35). Statistical analysis was performed using Mann–Whitney tests (P < 0.05). Error bars indicate the S.E.M. Results are compiled from two independent experiments.
Fig. 8
Fig. 8. B cell-deficiency attenuates IFN-β-treated TH17-EAE.
TH17-EAE was induced in either C57BL/6 or µMT mice and treated with IFN-β or vehicle. a Clinical scores of vehicle-treated C57BL/6 (n = 10) and µMT (n = 10) mice with TH17-EAE. Data were pooled from two independent experiments. Mann–Whitney tests were performed to determine statistical significance (P < 0.05). b Number of CD4+ T cells that express GM-CSF and IL-17 in spinal cords of vehicle-treated mice (day 29). c Clinical scores of IFN-β-treated C57BL/6 (n = 10) and µMT (n = 11) mice with TH17-EAE. Data were pooled from two independent experiments. Mann–Whitney tests were performed to determine statistical significance (P < 0.05). d Number of CD4+ T cells that express GM-CSF and IL-17 in spinal cords of IFN-β-treated mice (day 29). Statistical analysis was performed using two-tailed Mann–Whitney tests. Error bars indicate the S.E.M. Results are compiled from two independent experiments. Source data are provided as a Source Data file.
Fig. 9
Fig. 9. Effect of IFN-β-stimulated B cells on TH17 cells.
Purified B cells from spleens of healthy or EAE mice (n = 5) were stimulated with anti-CD40 ± IFN-β for 3 days. Following stimulation, B cells were washed and co-cultured with CD4+ T cells from 2D2 mice in the presence of MOG35–55 antigen. Following IFN-β stimulation, B-cell phenotype and cytokine production were assessed by a, b FACS and c ELISA, respectively. Stimulated B cells were washed and co-cultured with antigen-specific 2D2 T-helper cells in the presence of MOG35–55 antigen. Representative flow cytometry plots of Ki-67 staining of 2D2 CD4+ T cells cultured with B cells from d healthy (n = 3) or e EAE mice (n = 3). f The cytokines IL-17A, GM-CSF, and IL-10 from the co-culture supernatants were analyzed by ELISA (n = 3 per group). Statistical significance was determined using paired one-way ANOVA tests with multiple comparison corrections using the Holm-Sidak’s method. P values < 0.05 were considered significant. Error bars indicate SEM. Source data are provided as a Source Data file.
Fig. 10
Fig. 10. IFN-I indirectly promotes TH17 pathogenicity.
Data from Fig. 9 indicate that IFN-I stimulates the expression of IL-6 and IL-12p40 from activated B cells which, in the context of auto-antigen, supports the proliferation of inflammatory TH17 cells. In contrast, IFN-I stimulation of naive B cells elevates IL-10 and not IL-6 and does not efficiently promote inflammatory TH17 cell proliferation.

References

    1. Isaacs A, Lindenmann J. Virus interference. I. The interferon. Proc. R. Soc. Lond. B Biol. Sci. 1957;147:258–267. - PubMed
    1. Moschos S, Varanasi S, Kirkwood JM. Interferons in the treatment of solid tumors. Cancer Treat. Res. 2005;126:207–241. - PubMed
    1. Paty DW, Li DK. Interferon beta-1b is effective in relapsing-remitting multiple sclerosis. II. MRI analysis results of a multicenter, randomized, double-blind, placebo-controlled trial. UBC MS/MRI Study Group and the IFNB Multiple Sclerosis Study Group. Neurology. 1993;43:662–667. - PubMed
    1. Palace J, Leite MI, Nairne A, Vincent A. Interferon Beta treatment in neuromyelitis optica: increase in relapses and aquaporin 4 antibody titers. Arch. Neurol. 2010;67:1016–1017. - PubMed
    1. Uzawa A, Mori M, Hayakawa S, Masuda S, Kuwabara S. Different responses to interferon beta-1b treatment in patients with neuromyelitis optica and multiple sclerosis. Eur. J. Neurol. 2010;17:672–676. - PubMed

Publication types

MeSH terms