. 2020 Jun 5;3(1):289.
doi: 10.1038/s42003-020-1006-1.

Multidimensional imaging of liver injury repair in mice reveals fundamental role of the ductular reaction

Affiliations

Multidimensional imaging of liver injury repair in mice reveals fundamental role of the ductular reaction

Kenji Kamimoto et al. Commun Biol. .

Abstract

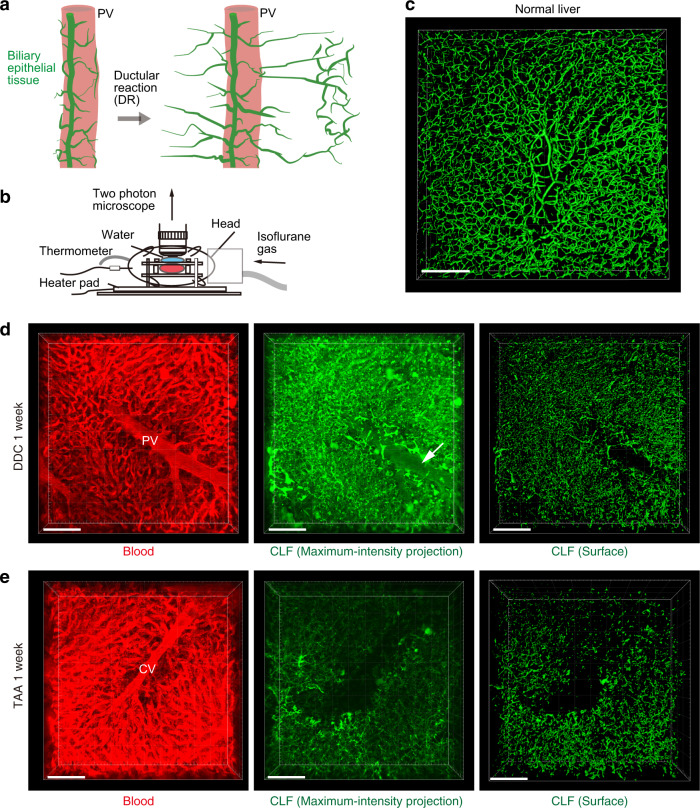
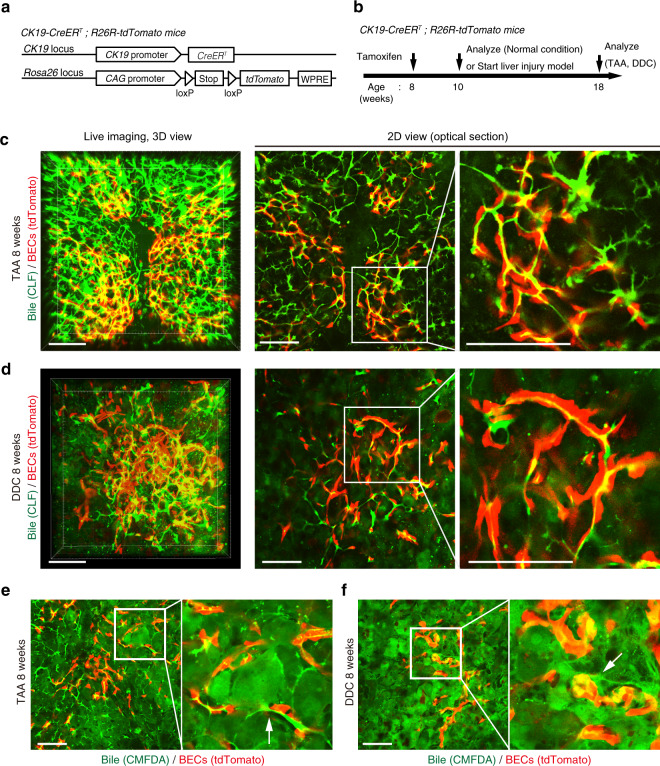
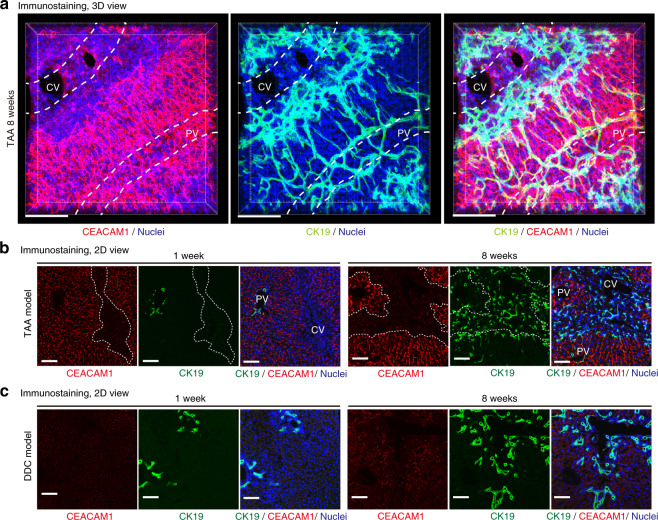
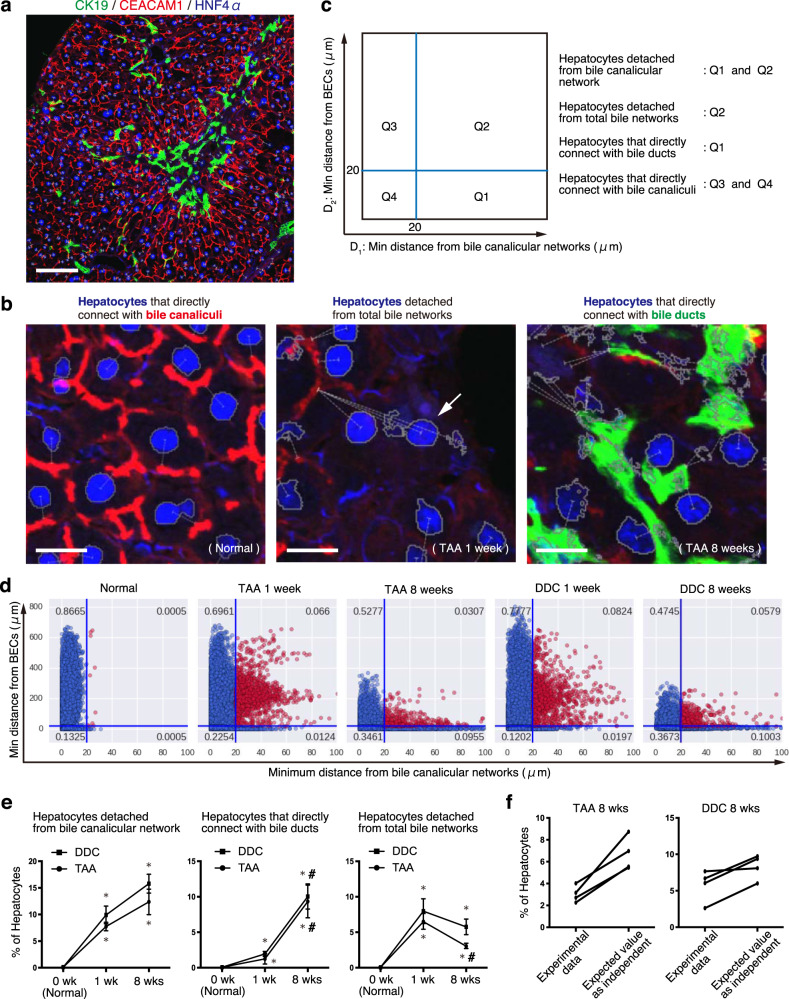
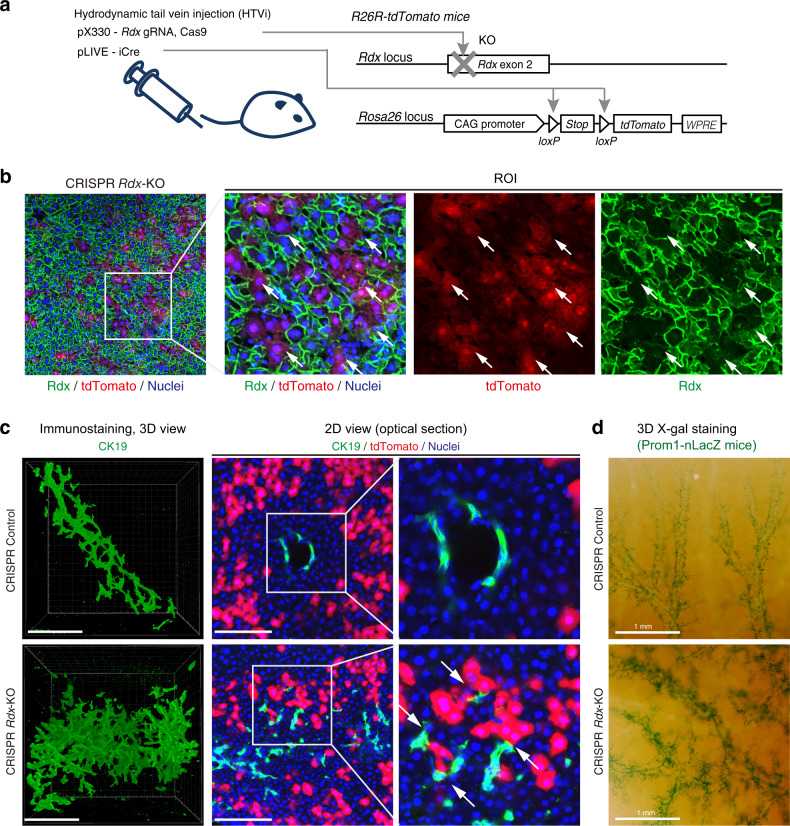
Upon severe and/or chronic liver injury, ectopic emergence and expansion of atypical biliary epithelial-like cells in the liver parenchyma, known as the ductular reaction, is typically induced and implicated in organ regeneration. Although this phenomenon has long been postulated to represent activation of facultative liver stem/progenitor cells that give rise to new hepatocytes, recent lineage-tracing analyses have challenged this notion, thereby leaving the pro-regenerative role of the ductular reaction enigmatic. Here, we show that the expanded and remodelled intrahepatic biliary epithelia in the ductular reaction constituted functional and complementary bile-excreting conduit systems in injured parenchyma where hepatocyte bile canalicular networks were lost. The canalicular collapse was an incipient defect commonly associated with hepatocyte injury irrespective of cholestatic statuses, and could sufficiently provoke the ductular reaction when artificially induced. We propose a unifying model for the induction of the ductular reaction, where compensatory biliary epithelial tissue remodeling ensures bile-excreting network homeostasis.


Conflict of interest statement

The authors declare no competing interests.

Figures

Fig. 1
Fig. 1. Observation of the bile-excreting channel structure in live mouse livers.
a Schematic illustration of the ductular reaction. While biliary epithelial tissues (green) exist around the portal vein (PV, pink) in normal condition, they expand branches outward upon parenchymal injury. b Experimental setup for intravital imaging. Mice were anesthetized with isoflurane gas. The abdomen was incised to expose the liver, which was then attached to the developed liver-holding device. c Representative 3D image of the biliary channel structure under normal conditions, visualized with cholyl-lysyl-fluorescein (CLF) and captured with a two-photon microscope (n = 10 mice). Stacked images were used to reconstruct a 3D image using IMARIS software. The image is shown in surface mode, which highlights the surface of the object. d, e Representative images of blood flow and the biliary channel structure visualized with Texas red-conjugated dextran and CLF, respectively. Wild-type mice at 1 week of liver injury induced by DDC (d) or TAA (e) administration were subjected to intravital imaging (n = 8 mice for each). PV and CV denote blood vessels of the portal vein and the central vein, respectively. White arrow indicates bile accumulation in the portal vein in the DDC-injured liver. Scale bars, 100 μm.
Fig. 2
Fig. 2. Expanded biliary structures in the ductular reaction function as bile-excreting channels.
a CK19-CreERT;R26R-tdTomato mice were used to visualize biliary epithelial cells (BECs) with a red fluorescent protein. b Experimental design. BECs were labeled with tdTomato at 8 weeks of age and were then subjected to chronic liver injury (TAA or DDC). After 8 weeks of liver injury, the mice were analyzed by intravital imaging. Cholyl-lysyl-fluorescein (CLF)was injected immediately before intravital imaging. c, d Representative images of intravital observation of the biliary channel structure (CLF, green) and BECs (tdTomato, red) in the ductular reaction induced in the TAA (c) and DDC (d) models (n = 8 and 5 mice, respectively). The left panels show 3D reconstructed images, and center and right panels show pictures of a 2D optical section. Right panels are magnified views of the center images. Scale bars, 100 μm. e, f Representative images of intravital observation of chloromethyl fluorescein diacetate (CMFDA, green), which is metabolized in hepatocytes to form a fluorescent metabolite, and BECs (tdTomato, red) in the ductular reaction induced in the TAA (e) and DDC (f) models (n = 4 mice for each). Right panels are magnified views of the center images. Scale bars, 100 μm.
Fig. 3
Fig. 3. The extended biliary tree complements the lost bile canalicular networks upon parenchymal injury.
a Representative image of 3D visualization of bile canaliculi (CEACAM1, red), bile ducts (CK19, green), and nuclei (Hoechst3342, blue) in the liver of the TAA injury model (n = 8 mice). Positions of blood vessels of the portal vein (PV) and the central vein (CV) are highlighted in white dotted lines. Scale bars, 100 μm. See also Supplementary Fig. 6 for images from different angles of view, showing the presence of blood vessel lumens. b, c Representative images of 2D immunostaining of injured mouse livers in the TAA (b) and DDC (c) models (n = 4 mice, respectively). In (b), collapse areas of bile canaliculi around the CV are highlighted with white dotted lines. Scale bars, 100 μm.
Fig. 4
Fig. 4. Hepatocytes detached from bile canalicular networks re-establish connection with the network of the bile duct upon parenchymal injury.
a Exemplified image of immunostained liver sections used for the analysis. Bile canaliculi (CEACAM1, red), nuclei of hepatocytes (HNF4α, blue), and bile ducts (CK19, green) were visualized. Scale bar, 100 μm. b Magnified images showing typical types of hepatocytes in different categories. White dotted lines delineate the minimum distance from the center of hepatocyte nuclei to bile canalicular networks or to bile ducts. White arrow points to a hepatocyte detached from both bile canaliculi and bile ducts (total bile networks). Scale bars, 20 μm. c Classification of hepatocytes by quadrants (Q1–Q4) according to the distances from the bile-excreting network structures. d Scatter plot results showing the hepatocyte status under the normal and liver injury conditions. The horizontal and vertical axes indicate minimum distances from the nucleus of hepatocytes to the edge of bile canalicular networks and that of BECs, respectively. Blue lines indicate the 20-μm thresholds. Quantification was done at a single-cell resolution, and each dot corresponds to a single hepatocyte. For each of the conditions, the data were acquired from n = 4 mice with five randomly chosen areas in liver sections analyzed per mouse, and all of those hepatocytes analyzed were shown en bloc in the plots (n = 18821, 14855, 8735, 22529, and 12293 hepatocytes for Normal, DDC 1 wk, DDC 8 weeks, TAA 1 week, and TAA 8 weeks, respectively). e Transition of the hepatocyte status during the course of liver injury. Mean data ± standard deviation of n = 4 mice are shown (*P = 0.0304 vs. 0 week; # P = 0.0304 vs. 1 week). f Evaluation for the significance of the correlation between the detachment from bile canalicular networks and the formation of connection with bile ducts. The data of hepatocytes detached from total bile networks were analyzed. The left columns correspond to the same experimental data as shown in the right graph of (e). The right columns show assumed data that was expected if the two distances were independent.
Fig. 5
Fig. 5. Destruction of bile canaliculi by Rdx deletion in vivo in mouse hepatocytes induces the ductular reaction.
a Rdx knockout and cell-labeling strategies. Hydrodynamic tail vein injection (HTVi) was employed to deliver plasmids into mouse hepatocytes in vivo. Using R26R-tdTomato reporter mice as recipients, gene knockout and permanent cell labeling were induced simultaneously. b Validation of Rdx knockout in the mouse liver. At 2 weeks after the gene delivery, liver sections were prepared and expression of Rdx proteins (green) was analyzed by immunostaining, together with the tdTomato fluorescent signals (red) and nuclear staining by Hoechst3342 (blue). Representative image of n = 5 mice is shown. A region of interest (ROI) indicated by a white box in the left panel is magnified in the right panels. White arrows indicate tdTomato+ hepatocytes in which the Rdx expression was lost. Note that the loss of Rdx is observed solely in tdTomato+ cells. c Representative 3D images of the biliary tree in the liver of negative control mice (upper panels; n = 5 mice) and Rdx-knockout mice (lower panels; n = 5 mice). The left panels are 3D images of the biliary epithelial tissue (CK19 immunostaining), which were generated with IMARIS software (blend mode). Central panels show optical 2D sections, and magnified view thereof, of mouse livers. BECs are shown in green and gene-modified hepatocytes (tdTomato+ cells) in red. White arrows indicate the extended biliary branches that were located adjacent to the gene-modified hepatocytes. Scale bar, 100 μm. d Representative images of the biliary tree visualized by whole-mount X-gal staining in Prom1-CreERT2-nLacZ mice (n = 5 mice for each conditions). Scale bars, 1 mm.

Similar articles

Cited by

References

    1. Kopp JL, Grompe M, Sander M. Stem cells versus plasticity in liver and pancreas regeneration. Nat. Cell Biol. 2016;18:238–245. - PubMed
    1. Michalopoulos GK. Liver regeneration: alternative epithelial pathways. Int J. Biochem. Cell Biol. 2011;43:173–179. - PMC - PubMed
    1. Desmet V, Roskams T, Van Eyken P. Ductular reaction in the liver. Pathol. Res. Pr. 1995;191:513–524. - PubMed
    1. Forbes SJ, Newsome PN. Liver regeneration - mechanisms and models to clinical application. Nat. Rev. Gastroenterol. Hepatol. 2016;13:473–485. - PubMed
    1. Gouw AS, Clouston AD, Theise ND. Ductular reactions in human liver: diversity at the interface. Hepatology. 2011;54:1853–1863. - PubMed

Publication types