. 2020 Aug 3;29(13):2200-2217.
doi: 10.1093/hmg/ddaa106.

Correction of amyotrophic lateral sclerosis related phenotypes in induced pluripotent stem cell-derived motor neurons carrying a hexanucleotide expansion mutation in C9orf72 by CRISPR/Cas9 genome editing using homology-directed repair

Affiliations

Correction of amyotrophic lateral sclerosis related phenotypes in induced pluripotent stem cell-derived motor neurons carrying a hexanucleotide expansion mutation in C9orf72 by CRISPR/Cas9 genome editing using homology-directed repair

Nidaa A Ababneh et al. Hum Mol Genet. .

Abstract

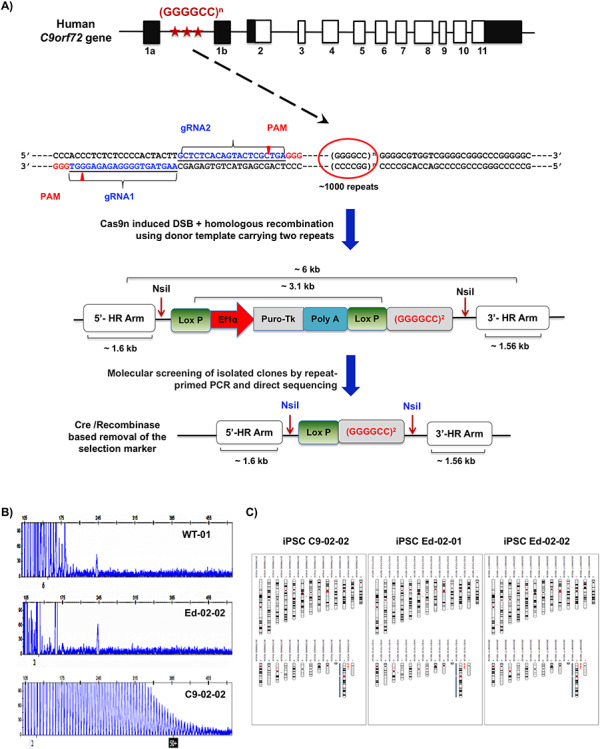
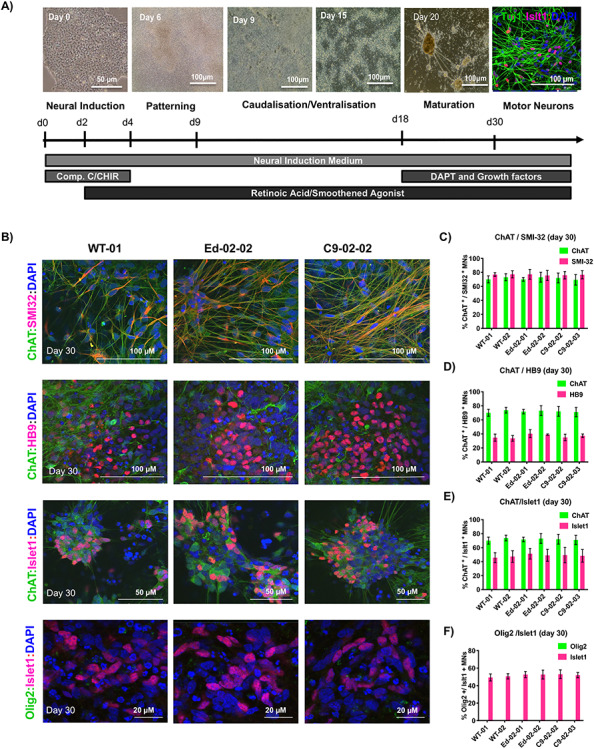
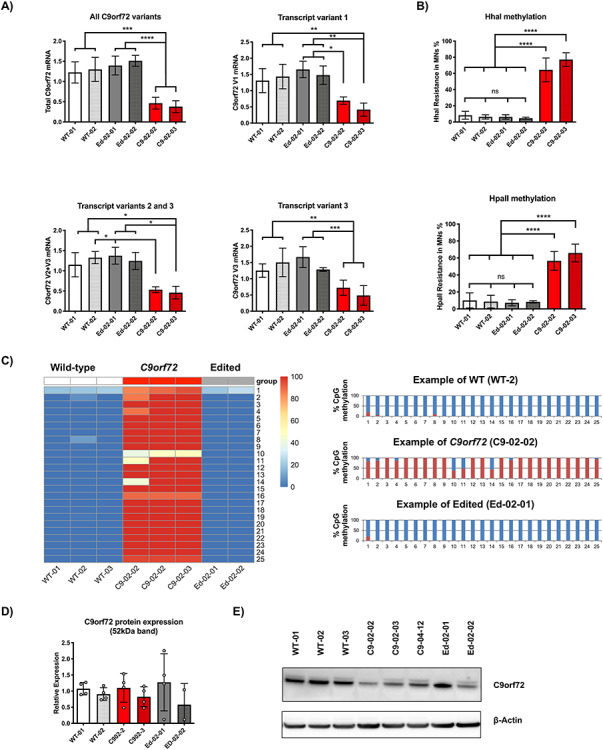
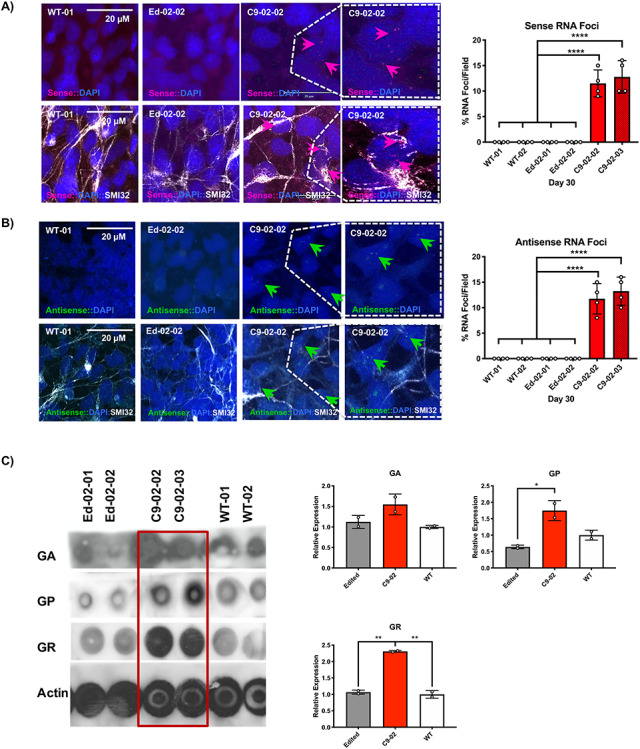
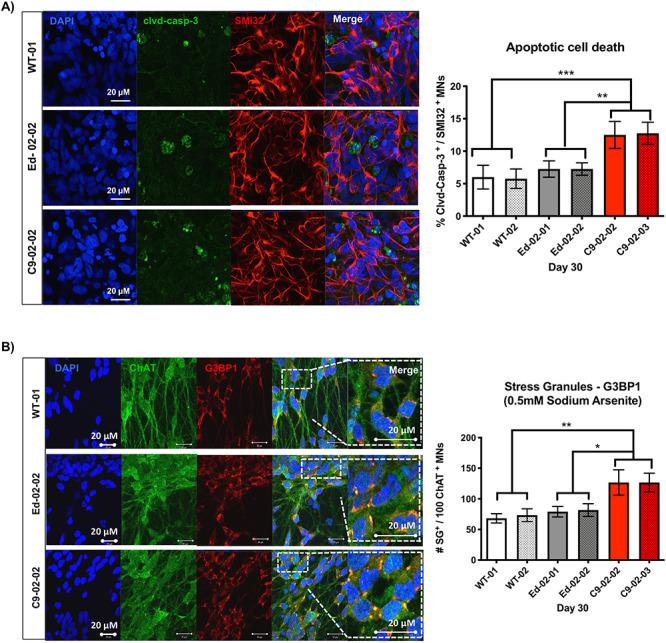
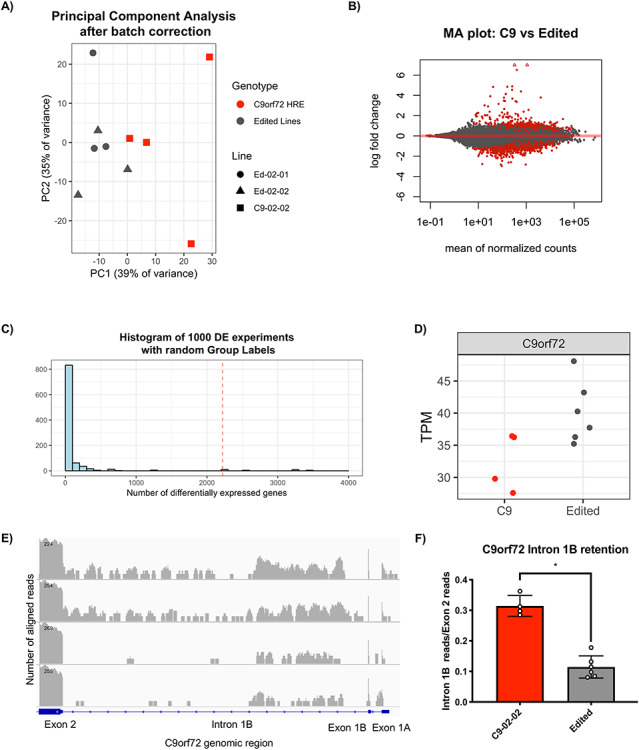
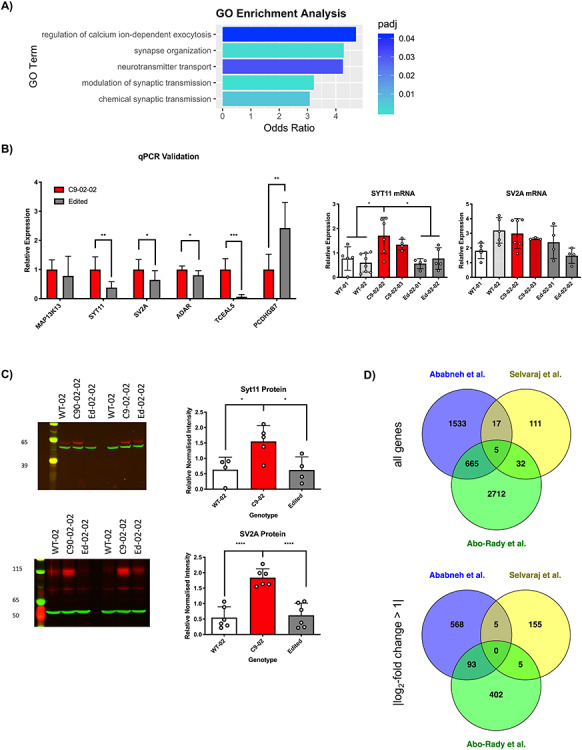
The G4C2 hexanucleotide repeat expansion (HRE) in C9orf72 is the commonest cause of familial amyotrophic lateral sclerosis (ALS). A number of different methods have been used to generate isogenic control lines using clustered regularly interspaced short palindromic repeats (CRISPR)/Cas9 and non-homologous end-joining by deleting the repeat region, with the risk of creating indels and genomic instability. In this study, we demonstrate complete correction of an induced pluripotent stem cell (iPSC) line derived from a C9orf72-HRE positive ALS/frontotemporal dementia patient using CRISPR/Cas9 genome editing and homology-directed repair (HDR), resulting in replacement of the excised region with a donor template carrying the wild-type repeat size to maintain the genetic architecture of the locus. The isogenic correction of the C9orf72 HRE restored normal gene expression and methylation at the C9orf72 locus, reduced intron retention in the edited lines and abolished pathological phenotypes associated with the C9orf72 HRE expansion in iPSC-derived motor neurons (iPSMNs). RNA sequencing of the mutant line identified 2220 differentially expressed genes compared with its isogenic control. Enrichment analysis demonstrated an over-representation of ALS relevant pathways, including calcium ion dependent exocytosis, synaptic transport and the Kyoto Encyclopedia of Genes and Genomes ALS pathway, as well as new targets of potential relevance to ALS pathophysiology. Complete correction of the C9orf72 HRE in iPSMNs by CRISPR/Cas9-mediated HDR provides an ideal model to study the earliest effects of the hexanucleotide expansion on cellular homeostasis and the key pathways implicated in ALS pathophysiology.


Figures

Figure 1
Figure 1
CRISPR gene targeting strategy for complete correction of the G4C2 repeat expansions in ALS/FTD patient iPSCs. (A) The overall scheme of the experiment is shown. The G4C2 hexanucleotide repeat region is indicated by stars. The subsequent diagram shows sequences of both guide RNAs, ~140 bp upstream of the repeat region, in blue. The homologous donor template design with LoxP-flanked Puro-TK selection cassette for the introduction of normal repeat size is shown in the next image. Cre/LoxP mediated excision was used to remove the selection cassette leaving one copy of LoxP integrated in the genome as demonstrated in the final diagram. (B) Electropherogram for a healthy control (WT-01), an edited iPSC clone (Ed-02), and the parental C9-02-02 iPSC clone. All puromycin resistant clones were assessed by RP-PCR to identify the presence or absence of the repeat expansion. Twenty-four clones showed normal electropherogram profile. (C) Karyograms produced using Karyostudio 1.3 from SNP array show no detected changes in the edited iPSC line Ed-02-01 versus the parent patient line C9-02. iPSC Ed-02-02 shows no additional detected changes, but note that the C7q amplification and C17q small amplified regions indicated in C9-02 and Ed-02-01 fall below the detection cut-off for Ed-02-02. Key (bands to left of indicated chromosome): red, loss or single copy; green, gain of copy; grey, loss of heterozygosity on autosomes, or two copies of X chromosome (i.e. this is a female line).
Figure 2
Figure 2
Characterization and MN differentiation of edited clones. (A) Schematic of the timeline of the MN differentiation protocol and morphology of the cells during the differentiation process. (B) Representative immunofluorescence images of the MN differentiation markers (Olig2, Isl1, ChAT, SMI32, HB9) derived from WT-01 (healthy control), the Ed-02-02 (edited clone) and the C9-02-02 (C9orf72 HRE positive clone). (C–F) Quantification of positive MN specific markers in iPSC-derived MN cultures from two healthy lines (WT-01 and WT-02), two edited lines (Ed-02-01 and Ed-02-02) and two patient lines (C9-02-02 and C9-02-03). On Day 30, 60–70% of MNs population showed positive staining for ChAT, 75–80% of cells stained for SMI32 and 35–40% for HB9 with no differences between the analyzed samples (P > 0.05, one-way ANOVA). Olig2 was completely absent on day 30 of differentiation, while Islet1 showed 35–40% nuclear staining. Bar graphs showing mean ± SD. Data from three independent differentiations, minimum of 100 cells per differentiation for each genotype.
Figure 3
Figure 3
Evaluation of C9orf72 promoter methylation and gene expression. (A) A reduction in Total, V1 and V2 C9orf72 RNA is seen in C9-02-02 and C9-02-03 clones compared with healthy controls and edited lines Ed-02-01 and Ed-02-02 (***P < 0.001, **P < 0.01, Bonferroni’s multiple comparison’s test). The results suggest restoration of normal transcription at the C9orf72 locus following genome editing. Data showing mean ± SD from three independent differentiations (n = 3 for every cell line). (B) Following digestion with the methylation sensitive restriction enzymes Hha1 and HpaII, CpG island hypermethylation is demonstrated in the C9orf72 promoter region of patient lines C9-02-02 and C9-02-03 compared with both controls WT-01 and WT-02 and edited lines Ed-02-01 and Ed-02-02 (****P < 0.0001, Bonferroni’s multiple comparison’s test). Data showing mean ± SD from three independent differentiations (n = 3 for every cell line). (C) Bisulfite sequencing of all CpG islands in the 5′ region upstream of the C9orf72 HRE demonstrated hypermethylation in the C9orf72 positive lines. In the two edited lines studied, this was restored to normal. The right panel displays three example plots showing the ratios of methylated (red) to unmethylated (blue) cytosines at each CpG locus (n = 1 for all lines except for line C9-02-02, for which two samples were studied as shown). (D) C9orf72 protein expression unchanged in clones from patient C9-02 compared with both edited lines and lines from healthy controls (P > 0.05 Bonferroni’s multiple comparison’s test, n = 4 independent differentiations). (E) Example western blot of C9orf72 protein expression. Note: line C9-04-12 not included in this study.
Figure 4
Figure 4
Abolition of sense and antisense RNA foci and reduction of RAN translation products. (A and B) FISH with G2C4-Cy3 and G4C2-Alexa488 probes showing G2C4 sense (red) G4C2 antisense RNA foci (green) in C9-02-02 and C9-02-03 iPSC-derived MNs. Foci are absent in healthy and edited clones (****P < 0.0001, Bonferroni’s multiple comparison’s test). Nuclear foci are indicated by arrows and SMI32 was used as a MN-specific marker. Four fields of view containing a minimum of 100 neurons each were counted (n = 4). (C) Dot-blot of GA, GP, and GR DP repeats in C9-02-02 and C9-02-03 compared with both healthy controls and edited lines. Quantification showing differences between C9orf72 HRE lines and edited lines for GP and GR DP and between C9orf72 HRE lines and WT lines for GR (*P < 0.05, **P < 0.01, Bonferroni’s multiple comparison’s test, n = 2 lines per group, 1 differentiation).
Figure 5
Figure 5
Edited iPSMNs are less susceptible to apoptotic cell death and toxicity. (A) Representative images of cleaved caspase-3 activation in iPSMNs from lines WT-01, Ed-02-02 and C9-02-02 at basal conditions. Quantification of the proportion of cleaved caspase-3 positive MNs (mean ± SD from three independent differentiations (n = 3), minimum 100 cells per line and differentiation, Day 30) demonstrates a decrease in cleaved caspase-3 frequency in Ed-02-01 and Ed-02-02 cells compared with C9-02-02 and C9-02-03 iPSMN cultures (**P < 0.01, ***P < 0.001, Bonferroni’s multiple comparison’s test). (B) G3BP1 accumulation in stress granules following 1 h 3 min of arsenite treatment was detected at higher frequency in C9-02-02 and C9-02-03 patient iPSC-MNs compared with healthy controls WT-01 and WT-02 as well as edited lines Ed-02-01 and Ed-02-02 clones (*P < 0.05, **P < 0.01, Bonferroni’s multiple comparison’s test, mean ± SD from three independent differentiations (n = 3), minimum 100 ChAT positive cells per line and differentiation, day 30).
Figure 6
Figure 6
Genome editing of C9orf72 results in significant differential expression and reduced retention of the repeat containing C9orf72 intron. (A) Principal component analysis using the 500 genes with the largest variance shows separation between the C9orf72 HRE positive parent line and both edited controls. (B) Differential expression analysis comparing the C9-02-02 clone with both edited clones reveals 1013 upregulated and 1203 downregulated genes as seen on this MA plot. Significantly differentially expressed genes are plotted in red, triangles represent datapoints outside the graphing area. (C) Histogram of permutation analysis using shuffled line labels demonstrates statistical significance of the sequencing analysis (P = 0.034). Histogram indicates frequency of having N differentially expressed genes upon permutation. Dashed red line indicates result without permutation. (D) TPM showing normalized expression for all C9orf72 transcripts combined (FDR = 0.002). (E) Representative images showing stacked reads aligned to the first three exons and corresponding introns of C9orf72 (log scale). Top two panes show two independent differentiations of line C9-02-02 and the lower two panes show reads from Ed-02-01 and Ed-02-02. The gene diagram is annotated with the used nomenclature. (F) Quantification of intron retention of the repeat containing intron divided by the number of reads in the adjacent exon 2 shows reduced intron retention after genome editing (mean ± SD, P = 0.01, Mann–Whitney test).
Figure 7
Figure 7
Geneset and overrepresentation analyses of gene expression increased in C9orf72 HRE neurons compared with edited controls reveals pathways relevant to ALS. (A) GO overrepresentation analysis of genes upregulated in C9orf72 HRE iPSMNs compared with the edited controls (FDR < 0.05) reveals enrichment of pathways of calcium-ion dependent exocytosis and synaptic transmission. (B) A number of differentially expressed targets were selected for validation of RNA sequencing. Validation was performed on six C9-02-02 lines and seven edited lines (mean ± SD; Mann–Whitney test: ***P < 0.001, **P < 0.01, *P < 0.05). For genes of interest, more extensive validation was undertaken as follows: WT-1 5 differentiations, WT-2 eight differentiations, C9-02-03 four differentiations, C9-02-02 six differentiations, Ed-02-01 five differentiations and Ed-02-02 four differentiations. (mean ± SD; Bonferroni’s post-hoc test: *P < 0.05, ***P < 0.001). (C) Six independent differentiations of patient lines (C9-02-02 and C9-02-03), edited lines (Ed-02-01 and Ed-02-02) and a control line (WT-02) were performed for western blotting using synaptotagmin 11 and SV2A antibodies. The left panels show quantification across all six differentiations (mean ± SD). Synaptotagmin 11 has increased expression in C9-02 lines compared with edited lines (P = 0.04, Bonferroni’s post-hoc test) and healthy controls (P = 0.04, Bonferroni’s post-hoc test). SV2A is increased in C9-02 lines compared with edited lines (P < 0.001, Bonferroni’s post-hoc test) and healthy controls (P < 0.001, Bonferroni’s post-hoc test). The right panels show representative western blots for both proteins (actin green, antibody of interest red). (D) Comparison with published datasets. On comparison with published datasets, there was a statistically significant overlap between this dataset and the reanalysis of Abo-Rady et al. (P < 0.001, permutation analysis with replacement). No statistical overlap was found between either of these two datasets and the results list published by Selvaraj et al. (P > 0.05).

Similar articles

Cited by

References

    1. Chio A., Mora G., Leone M., Mazzini L., Cocito D., Giordana M.T., Bottacchi E., Mutani R. and Piemonte and Valle d’Aosta Register for ALS (2002) Early symptom progression rate is related to ALS outcome: a prospective population-based study. Neurology, 59, 99–103. - PubMed
    1. Ling S.-C., Polymenidou M. and Cleveland D.W. (2013) Converging mechanisms in ALS and FTD: disrupted RNA and protein homeostasis. Neuron, 79, 416–438. - PMC - PubMed
    1. Majounie E., Renton A.E., Mok K., Dopper E.G.P.P., Waite A., Rollinson S., Chiò A., Restagno G., Nicolaou N., Simon-Sanchez J. et al. (2012) Frequency of the C9orf72 hexanucleotide repeat expansion in patients with amyotrophic lateral sclerosis and frontotemporal dementia: a cross-sectional study. Lancet Neurol., 11, 323–330. - PMC - PubMed
    1. Smith B.N., Newhouse S., Shatunov A., Vance C., Topp S., Johnson L., Miller J., Lee Y., Troakes C., Scott K.M. et al. (2013) The C9ORF72 expansion mutation is a common cause of ALS+/−FTD in Europe and has a single founder. Eur. J. Hum. Genet., 21, 102–108. - PMC - PubMed
    1. van Blitterswijk M., DeJesus-Hernandez M., Niemantsverdriet E., Murray M.E., Heckman M.G., Diehl N.N., Brown P.H., Baker M.C., Finch N.A., Bauer P.O. et al. (2013) Association between repeat sizes and clinical and pathological characteristics in carriers of C9ORF72 repeat expansions (Xpansize-72): a cross-sectional cohort study. Lancet Neurol., 12, 978–988. - PMC - PubMed

Publication types

Substances