

Risk of a second wave of Covid-19 infections: using artificial intelligence to investigate stringency of physical distancing policies in North America
- PMID: 32504213
- PMCID: PMC7411331
- DOI: 10.1007/s00264-020-04653-3
Risk of a second wave of Covid-19 infections: using artificial intelligence to investigate stringency of physical distancing policies in North America
Abstract
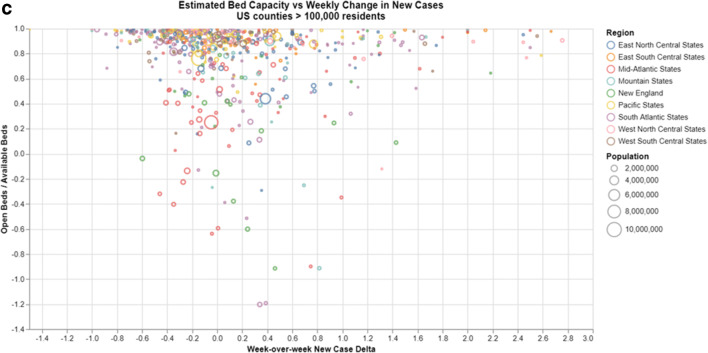
Purpose: Accurately forecasting the occurrence of future covid-19-related cases across relaxed (Sweden) and stringent (USA and Canada) policy contexts has a renewed sense of urgency. Moreover, there is a need for a multidimensional county-level approach to monitor the second wave of covid-19 in the USA.
Method: We use an artificial intelligence framework based on timeline of policy interventions that triangulated results based on the three approaches-Bayesian susceptible-infected-recovered (SIR), Kalman filter, and machine learning.
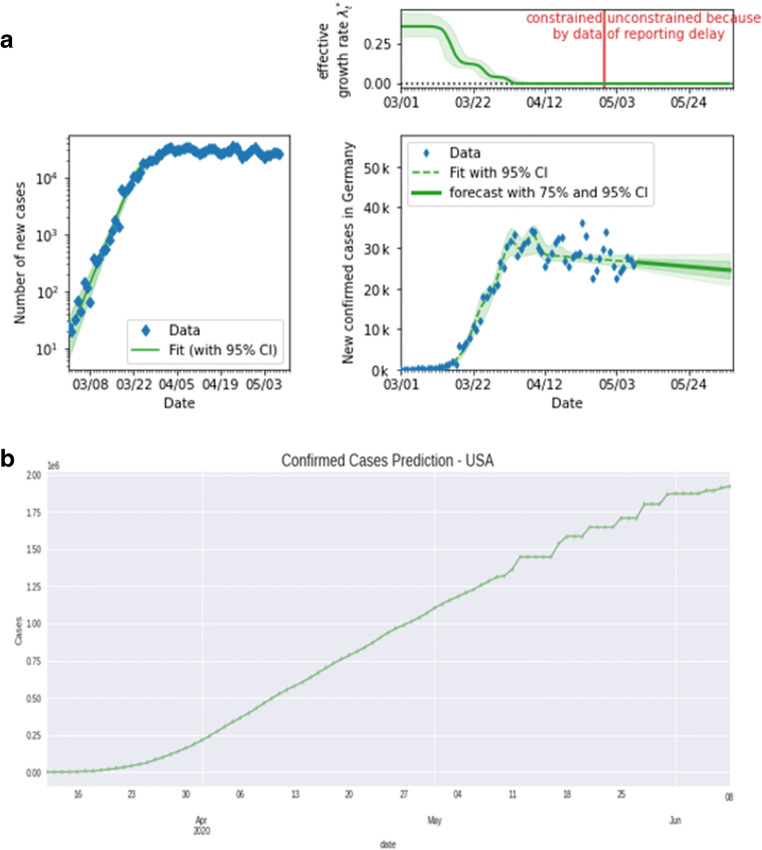
Results: Our findings suggest three important insights. First, the effective growth rate of covid-19 infections dropped in response to the approximate dates of key policy interventions. We find that the change points for spreading rates approximately coincide with the timelines of policy interventions across respective countries. Second, forecasted trend until mid-June in the USA was downward trending, stable, and linear. Sweden is likely to be heading in the other direction. That is, Sweden's forecasted trend until mid-June appears to be non-linear and upward trending. Canada appears to fall somewhere in the middle-the trend for the same period is flat. Third, a Kalman filter based robustness check indicates that by mid-June the USA will likely have close to two million virus cases, while Sweden will likely have over 44,000 covid-19 cases.
Conclusion: We show that drop in effective growth rate of covid-19 infections was sharper in the case of stringent policies (USA and Canada) but was more gradual in the case of relaxed policy (Sweden). Our study exhorts policy makers to take these results into account as they consider the implications of relaxing lockdown measures.
Keywords: Artificial intelligence; Bayesian (SIR); Covid-19; Kalman filter; Machine learning.
Conflict of interest statement
On behalf of all authors, the corresponding author states that there is no conflict of interest.
Figures


References
-
- Global economic effects of covid-19 (2020). https://fas.org/sgp/crs/row/R46270.pdf
-
- Data on covid-19 coronavirus pandemic (2020). https://coronavirus.jhu.edu/map.html
-
- WHO warns that coronavirus cases have jumped in countries that eased lockdowns (2020). https://www.cnbc.com/2020/05/11/who-warns-that-coronavirus-cases-have-ju...
-
- Whose coronavirus strategy worked best? Scientists hunt most effective policies (2020). https://www.nature.com/articles/d41586-020-01248-1 - PubMed
MeSH terms
LinkOut - more resources
Full Text Sources
Medical
