. 2020 Jul;11(7):483-504.
doi: 10.1007/s13238-020-00728-4. Epub 2020 Jun 6.

SIRT7 antagonizes human stem cell aging as a heterochromatin stabilizer

Affiliations

SIRT7 antagonizes human stem cell aging as a heterochromatin stabilizer

Shijia Bi et al. Protein Cell. 2020 Jul.

Erratum in

Abstract

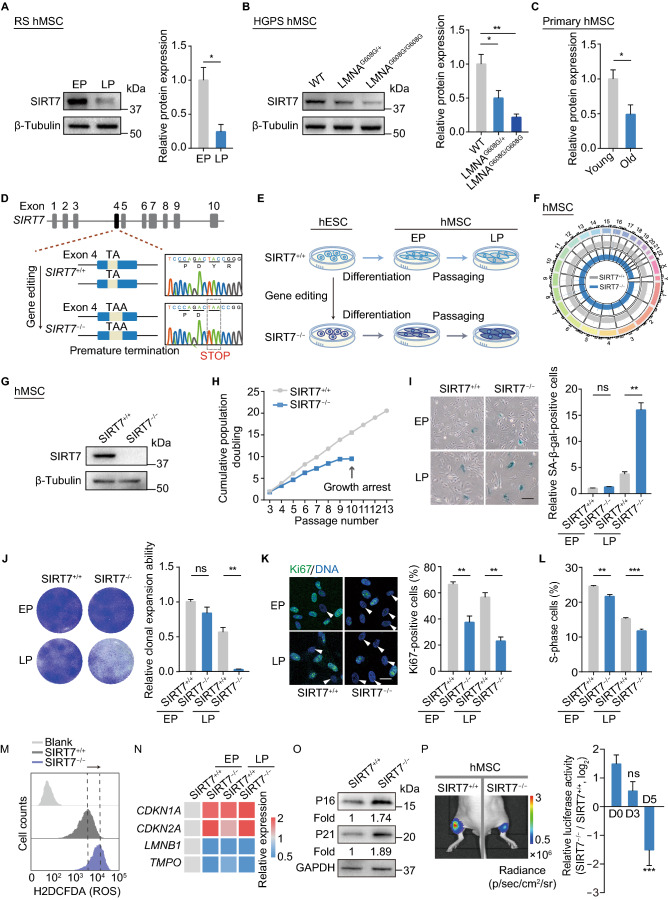
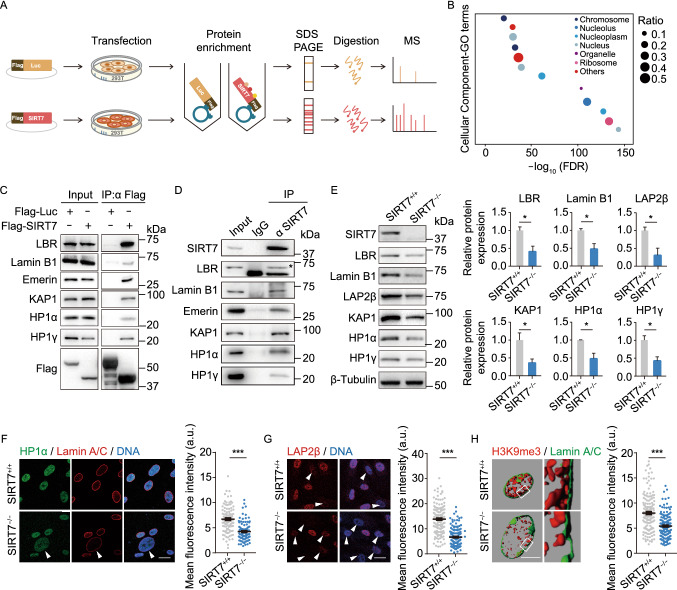
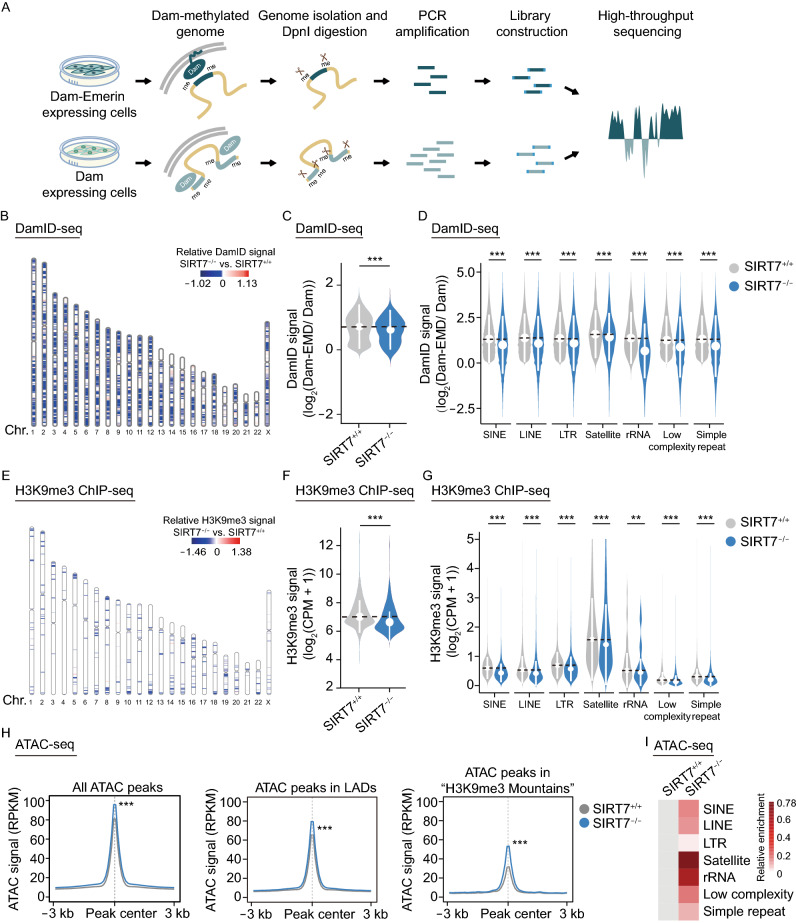
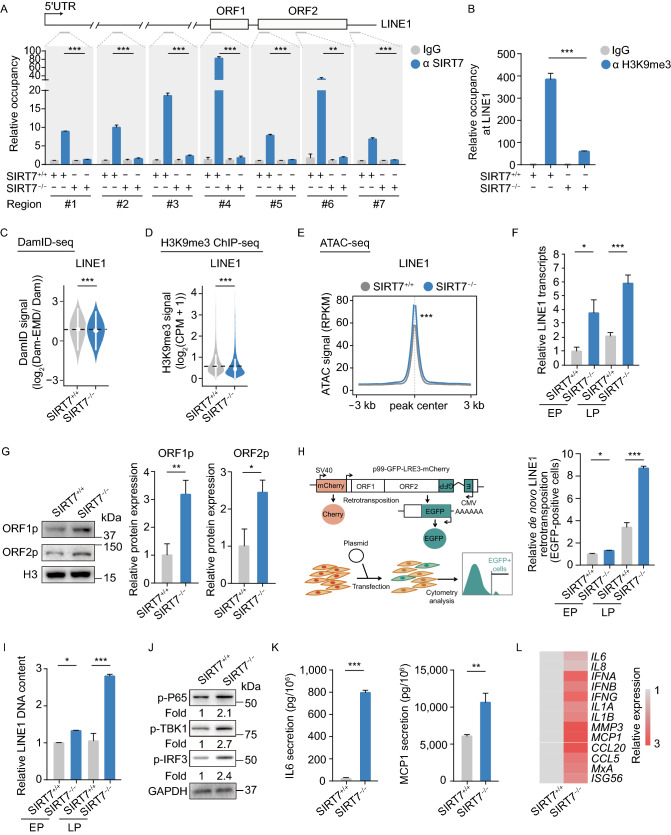
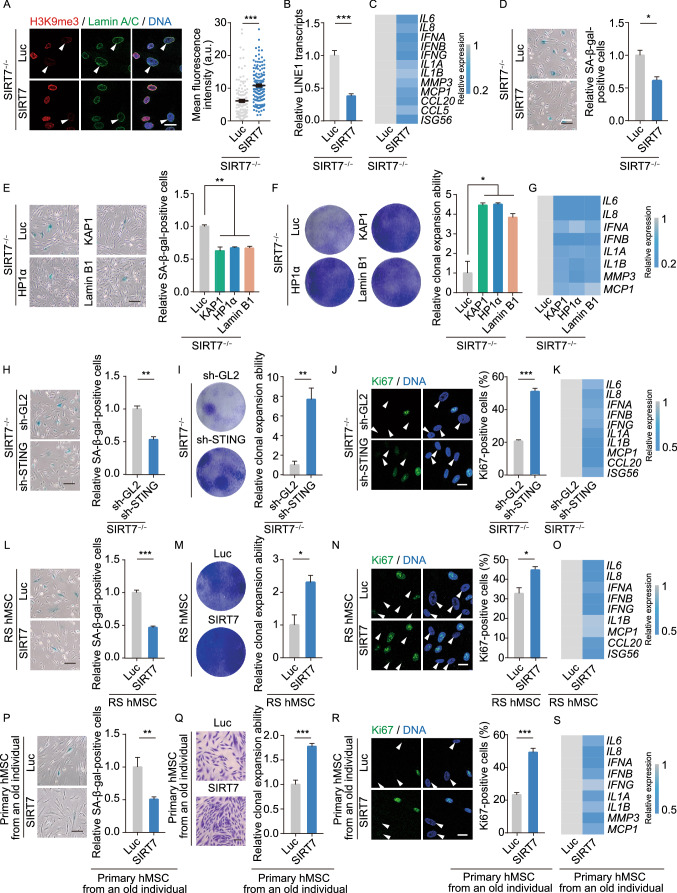
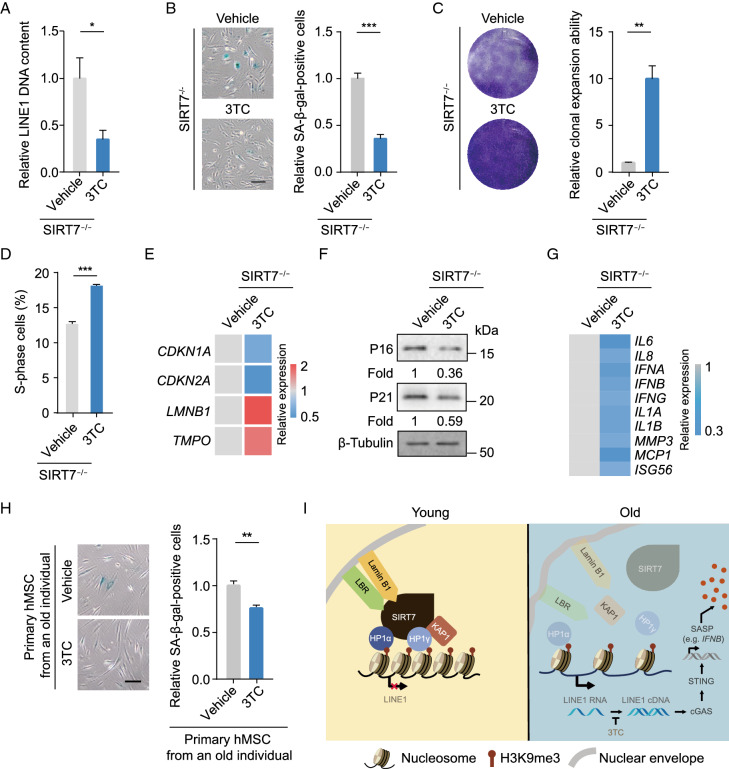
SIRT7, a sirtuin family member implicated in aging and disease, is a regulator of metabolism and stress responses. It remains elusive how human somatic stem cell populations might be impacted by SIRT7. Here, we found that SIRT7 expression declines during human mesenchymal stem cell (hMSC) aging and that SIRT7 deficiency accelerates senescence. Mechanistically, SIRT7 forms a complex with nuclear lamina proteins and heterochromatin proteins, thus maintaining the repressive state of heterochromatin at nuclear periphery. Accordingly, deficiency of SIRT7 results in loss of heterochromatin, de-repression of the LINE1 retrotransposon (LINE1), and activation of innate immune signaling via the cGAS-STING pathway. These aging-associated cellular defects were reversed by overexpression of heterochromatin proteins or treatment with a LINE1 targeted reverse-transcriptase inhibitor. Together, these findings highlight how SIRT7 safeguards chromatin architecture to control innate immune regulation and ensure geroprotection during stem cell aging.

Keywords: LINE1; SIRT7; STING; aging; cGAS; stem cell.


Figures

Figure 1
Figure 1
Generation and characterization of SIRT7-deficient hESCs. (A) Left, Western blot analysis of SIRT7 protein in replicatively senescent (RS) hMSCs at early (EP, P3) and late passages (LP, P8) with β-Tubulin as loading control. Right, statistical analysis of relative SIRT7 protein expression levels. Data are presented as the means ± SEM. n = 3. *, P < 0.05 (t test). (B) Left, Western blot analysis of SIRT7 protein in WT and HGPS-specific (LMNAG608G/+ or LMNAG608G/G608G) hMSCs at LP (P8) with β-Tubulin used as loading control. Right, statistical analysis of relative SIRT7 protein expression levels. Data are presented as the means ± SEM. n = 3. *, P < 0.05, **, P < 0.01 (t test). (C) Statistical analysis of relative SIRT7 protein expression levels in young and old primary hMSCs. Data are presented as the means ± SEM. n = 4 samples. *, P < 0.05 (t test). (D) Left, schematic illustration of SIRT7 gene editing (exon 4) using CRISPR/Cas9-mediated non-homologous end joining (NHEJ) in hESCs. Right, DNA sequence chromatogram showing the introduction of termination codon TAA by gene editing. (E) Schematic workflow showing the generation of SIRT7+/+ and SIRT7−/− hMSCs from hESCs. (F) Genome-wide analysis of copy number variations (CNVs) in SIRT7+/+ and SIRT7−/− hMSCs at middle passage (MP, P6). (G) Western blot analysis of SIRT7 protein in SIRT7+/+ and SIRT7−/− hMSCs with β-Tubulin used as loading control. (H) Growth curves of SIRT7+/+ and SIRT7−/− hMSCs. Data are presented as the means ± SEM. n = 3. (I) SA-β-gal staining of SIRT7+/+ and SIRT7−/− hMSCs at EP (P3) and LP (P8). Scale bar, 125 μm. Data are presented as the means ± SEM. n = 3. ns, not significant, **, P < 0.01 (t test). (J) Clonal expansion analysis of SIRT7+/+ and SIRT7−/− hMSCs at EP (P3) and LP (P8). Data are presented as the means ± SEM. n = 3. ns, not significant, **, P < 0.01 (t test). (K) Immunostaining of Ki67 in SIRT7+/+ and SIRT7−/− hMSCs at EP (P3) and LP (P8). Scale bar, 25 μm. Data are presented as the means ± SEM. n = 3. **, P < 0.01 (t test). (L) Bar plot showing the percentages of cells in S-phase of cell cycle in SIRT7+/+ and SIRT7−/− hMSCs at EP (P3) and LP (P8). Data are presented as the means ± SEM. n = 3. **, P < 0.01, ***, P < 0.001 (t test). (M) ROS levels were determined by staining with the free radical sensor H2DCFDA and measured by FACS in SIRT7+/+ and SIRT7−/− hMSCs at MP (P6). Data are presented as the means ± SEM. n = 3. (N) Heatmap showing quantitative RT-PCR analysis of aging-related genes in SIRT7+/+ and SIRT7−/− hMSCs at EP (P3) and LP (P8) hMSCs. Expression levels of the indicated genes in each cell type were normalized to those in SIRT7+/+ hMSCs at EP (P3). (O) Western blot analysis of cyclin-dependent kinase inhibitors P16 and P21 proteins in SIRT7+/+ and SIRT7−/− hMSCs at MP (P6) with GAPDH used as loading control. (P) Analysis of luciferase activities in TA muscles of immunodeficient mice transplanted with SIRT7+/+ (left) or SIRT7−/− hMSCs (right) at MP (P6) in Day 0, 3 and 5 after implantation. Data calculated by the ratios of log2 (SIRT7−/−/SIRT7+/+) are presented as the means ± SEM. n = 6. ns, not significant, ***, P < 0.001 (t test)
Figure 2
Figure 2
SIRT7 interacts with nuclear lamina proteins and heterochromatin proteins. (A) Schematic of mass spectrometry work flow for identifying SIRT7-interacting proteins. Luc was used as control. (B) Gene Ontology Cellular Component (GO-CC) enrichment analysis of candidate SIRT7-interacting proteins identified by mass spectrometry. (C) Co-immunoprecipitation analysis of LBR, Lamin B1, Emerin, KAP1, HP1α and HP1γ with exogenous Flag-tagged SIRT7 protein in HEK293T cells. (D) Co-immunoprecipitation analysis of LBR, Lamin B1, Emerin, KAP1, HP1α and HP1γ with endogenous SIRT7 protein in WT hMSCs. The band corresponding to LBR is indicated with an asterisk. (E) Left, Western blot analysis of heterochromatin-related proteins in hMSCs at MP (P6) with β-Tubulin used as loading control. Right, statistical analysis of the relative heterochromatin-related protein expression levels. Data are presented as the means ± SEM. n = 3. *, P < 0.05 (t test). (F) Left, immunostaining of HP1α and Lamin A/C in SIRT7+/+ and SIRT7−/− hMSCs at MP (P6). White arrowheads indicate cells with decreased expression of HP1α. Right, mean fluorescence intensity of HP1α was measured by Image J. Scale bar, 25 μm. Data are presented as the means ± SEM. n = 100 cells. ***, P < 0.001 (t test). (G) Left, immunostaining of LAP2β in SIRT7+/+ and SIRT7−/− hMSCs. White arrowheads indicate cells with decreased expression of LAP2β. Right, mean fluorescence intensity of LAP2β was measured by Image J. Scale bar, 25 μm. Data are presented as the means ± SEM. n = 150 cells. ***, P < 0.001 (t test). (H) Left, z-stack 3D reconstruction of H3K9me3 and Lamin A/C immunofluorescence images (shown in Fig. S3B) in SIRT7+/+ and SIRT7−/− hMSCs at MP (P6). Scale bar, 5 μm. Right, mean fluorescence intensity of H3K9me3 in Fig. S3B was quantified with Image J. Data are presented as means ± SEM. n = 150 cells. ***, P < 0. 001 (t test)
Figure 3
Figure 3
SIRT7 is required for heterochromatin maintenance in hMSCs. (A) Schematic diagram showing the strategy for DamID-seq library construction. When the Dam-Emerin fused protein was expressed in hMSCs, the genomic DNA region near the nuclear envelope could be methylated by DNA adenine methyltransferase (Dam) at adenines. A parallel experiment “Dam only” was used to eliminate the background Dam signal. After genome extraction, the sequence containing methylated sites could be specifically cut by DpnI and amplified by PCR. The amplified fragments were then proceeded to DNA library construction and high-throughput sequencing. (B) Chromosome ideogram showing relative DamID signals in LADs across 23 chromosomes at MP (P6). The color key from blue to red shows low to high relative DamID levels, respectively. (C) Violin plot showing the DamID signal [log2 (Dam-EMD/Dam)] in LADs in SIRT7+/+ and SIRT7−/− hMSCs at MP (P6). The white circles represent the median values, and the white lines represent the values within the IQR from smallest to largest. ***, P < 0.001 (Two-sided Wilcoxon rank-sum test). (D) Violin plot showing the DamID signal [log2 (Dam-EMD/ Dam)] in LADs located in repetitive elements, including SINE, LINE, LTR, Satellite, rRNA, low complexity and simple repeat elements, in SIRT7+/+ and SIRT7−/− hMSCs at MP (P6). The white circles represent the median values, and the white lines represent the values within the IQR from smallest to largest. ***, P < 0.001 (Two-sided Wilcoxon rank-sum test). (E) Chromosome ideogram showing the relative H3K9me3 signal in “H3K9me3 mountains” across 23 chromosomes at MP (P6). The color key from blue to red shows low to high relative H3K9me3 levels, respectively. (F) Violin plot showing the H3K9me3 signal in “H3K9me3 mountains” in SIRT7+/+ and SIRT7−/− hMSCs at MP (P6). The white circles represent median values, and the white lines represent the values within the IQR from smallest to largest. ***, P < 0.001 (Two-sided Wilcoxon rank-sum test). (G) Violin plot showing the H3K9me3 signal in “H3K9me3 mountains” located in repetitive elements, including SINE, LINE, LTR, Satellite, rRNA, low complexity and simple repeat elements in SIRT7+/+ and SIRT7−/− hMSCs at MP (P6). The white circles represent the median values, and the white lines represent the values within the IQR from smallest to largest. **, P < 0.01, ***, P < 0.001 (Two-sided Wilcoxon rank-sum test). (H) Metaplots showing the average ATAC signals for all ATAC peaks, ATAC peaks in LADs, and ATAC peaks in “H3K9me3 mountains” in SIRT7+/+ and SIRT7−/− hMSCs at MP (P6). ***, P < 0.001 (Two-sided Wilcoxon rank-sum test). (I) Heatmap showing the relative enrichment of ATAC peaks in repetitive elements, including SINE, LINE, LTR, Satellite, rRNA, low complexity and simple repeat elements in SIRT7+/+ and SIRT7−/− hMSCs at MP (P6). Enrichment of ATAC peaks in repetitive elements in SIRT7−/− hMSCs were normalized to those in SIRT7+/+ hMSCs
Figure 4
Figure 4
Depletion of SIRT7 in hMSCs induces LINE1 activation and triggers innate immune responses via cGAS-STING pathway. (A) ChIP-qPCR assessment of SIRT7 enrichment at seven LINE1 regions in SIRT7+/+ and SIRT7−/− hMSCs at MP (P6). Data are presented as the means ± SEM. n = 3. **, P < 0.01. ***, P < 0.001 (t test). (B) ChIP-qPCR assessment of H3K9me3 enrichment of LINE1 regions in SIRT7+/+ and SIRT7−/− hMSCs at MP (P6) using the fourth LINE1 primer. Data are presented as the means ± SEM. n = 4. ***, P < 0.001 (t test). (C) Violin plot showing the DamID signal [log2 (Dam-EMD/ Dam)] in LINE1 regions located in LADs in SIRT7+/+ and SIRT7−/− hMSCs at MP (P6). The white circles represent the median values, and the white lines represent the values within the IQR from smallest to largest. ***, P < 0.001 (Two-sided Wilcoxon rank-sum test). (D) Violin plot showing the H3K9me3 signal in LINE1 regions located in “H3K9me3 mountains” in SIRT7+/+ and SIRT7−/− hMSCs at MP (P6). The white circles represent the median values, and the white lines represent the values within the IQR from smallest to largest. ***, P < 0.001 (Two-sided Wilcoxon rank-sum test). (E) Metaplot showing the average ATAC signal for ATAC peaks in LINE1 regions in SIRT7+/+ and SIRT7−/− hMSCs at MP (P6). ***, P < 0.001 (Two-sided Wilcoxon rank-sum test). (F) Quantitative RT-PCR analysis of LINE1 transcript levels in SIRT7+/+ and SIRT7−/− hMSCs at EP (P3) and LP (P8). Data are presented as the means ± SEM. n = 4. *, P < 0.05. ***, P < 0.001 (t test). (G) Left, Western blot analysis of LINE1 ORF1 and ORF2 proteins in SIRT7+/+ and SIRT7−/− hMSCs at MP (P6) with H3 used as loading control. Right, statistical analysis of relative ORF1 and ORF2 protein expression levels. Data are presented as the means ± SEM. n = 3. *, P < 0.05, **, P < 0.01 (t test). (H) Left, schematic of retrotransposition assay. The plasmid p99-GFP-LRE3-Cherry lacking a CMV promoter encodes a full-length LINE1 element tagged with an indicator cassette of mEGFP1 retrotransposition and mCherry cassette. Right, quantification of de novo retrotransposition events (EGFP-positive cells) in SIRT7+/+ and SIRT7−/− hMSCs at MP (P6), normalized by live cell numbers and transfection efficiency. Data are presented as the means ± SEM. n = 3. *, P < 0.05. ***, P < 0.001 (t test). (I) RT-qPCR analysis of the relative LINE1 genomic DNA content in SIRT7+/+ and SIRT7−/− hMSCs at EP (P3) and LP (P8). Data are presented as the means ± SEM. n = 4. *, P < 0.05. ***, P < 0.001 (t test). (J) Western blot analysis of the phosphorylation levels of P65, TBK1 and IRF3 in SIRT7+/+ and SIRT7−/− hMSCs at MP (P6) with GAPDH used as loading control. (K) ELISA analysis of IL6 and MCP1 levels in culture medium of SIRT7+/+ and SIRT7−/− hMSCs at MP (P6). IL6 levels were normalized to cell number. Data are presented as the means ± SEM. n = 5. MCP1 levels were normalized to cell number. n = 3. **, P < 0.001. ***, P < 0.001 (t test). (L) Heatmap showing quantitative RT-PCR analysis of IFN-I and SASP genes in SIRT7+/+ and SIRT7−/− hMSCs at MP (P6). Expression levels of these indicated genes in SIRT7−/− hMSCs were normalized to those in SIRT7+/+ hMSCs
Figure 5
Figure 5
SIRT7-heterochromatin-cGAS-STING axis protects hMSCs against senescence. (A) Left, immunostaining of H3K9me3 and Lamin A/C in SIRT7−/− hMSCs transduced with lentiviruses expressing Luc or SIRT7. White arrowheads indicate cells with decreased expression of H3K9me3. Scale bar, 25 μm. Right, mean fluorescence intensity of H3K9m3 was measured by Image J. Data are presented as the means ± SEM. n = 150 cells. ***, P < 0.001 (t test). (B) Quantitative RT-PCR analysis of LINE1 transcript levels in SIRT7−/− hMSCs transduced with lentiviruses expressing Luc or SIRT7. Data are presented as the means ± SEM. n = 4. ***, P < 0.001 (t test). (C) Heatmap showing quantitative RT-PCR analysis of IFN-I and SASP genes in SIRT7−/− hMSCs transduced with lentiviruses expressing Luc or SIRT7. Expression levels of these indicated genes in SIRT7 lentivirus-transduced hMSCs were normalized to those in Luc lentivirus-transduced hMSCs. (D) SA-β-gal staining of SIRT7−/− hMSCs transduced with lentiviruses expressing Luc or SIRT7. Scale bar, 125 μm. Data are presented as means ± SEM. n = 3. *, P < 0.05 (t test). (E) SA-β-gal staining of SIRT7−/− hMSCs transduced with lentiviruses expressing KAP1, HP1α or Lamin B1. Scale bar, 125 μm. Data are presented as the means ± SEM. n = 3. **, P < 0.01 (t test). (F) Clonal expansion analysis of SIRT7−/− hMSCs transduced with lentiviruses expressing KAP1, HP1α or Lamin B1. Data are presented as the means ± SEM. n = 3. *, P < 0.05 (t test). (G) Heatmap showing quantitative RT-PCR analysis of IFN-I and SASP genes in physiologically senescent hMSCs from old donor transduced with lentiviruses expressing KAP1, HP1α or Lamin B1. Expression levels of these indicated genes in KAP1, HP1α or Lamin B1-transduced hMSCs were normalized to those in Luc-transduced hMSCs. (H) SA-β-gal staining of SIRT7−/− hMSCs transduced with lentiviruses expressing sh-GL2 or sh-STING. Scale bar, 125 μm. Data are presented as the means ± SEM. n = 3. **, P < 0.01 (t test). (I) Clonal expansion analysis of SIRT7−/− hMSCs transduced with lentiviruses expressing sh-GL2 or sh-STING. Data are presented as the means ± SEM. n = 3. **, P < 0.01 (t test). (J) Immunostaining of Ki67 in SIRT7−/− hMSCs transduced with lentiviruses expressing sh-GL2 or sh-STING. White arrowheads indicate cells with decreased expression of Ki67. Scale bar, 25 μm. Data are presented as the means ± SEM. n = 3. ***, P < 0.001 (t test). (K) Heatmap showing quantitative RT-PCR analysis of IFN-I and SASP genes in SIRT7−/− hMSCs transduced with lentiviruses expressing sh-GL2 or sh-STING. Expression levels of these indicated genes in sh-STING lentivirus-transduced hMSCs were normalized to those in sh-GL2 lentivirus-transduced hMSCs. (L) SA-β-gal staining of RS hMSCs transduced with lentiviruses expressing Luc or SIRT7. Scale bar, 125 μm. Data are presented as the means ± SEM. n = 3. ***, P < 0.001 (t test). (M) Clonal expansion analysis of RS hMSCs transduced with lentiviruses expressing Luc or SIRT7. Data are presented as the means ± SEM. n = 3. *, P < 0.05 (t test). (N) Immunostaining of Ki67 in RS hMSCs transduced with lentiviruses expressing Luc or SIRT7. White arrowheads indicate cells with decreased expression of Ki67. Scale bar, 25 μm. Data are presented as the means ± SEM. n = 3. *, P < 0.05 (t test). (O) Heatmap showing quantitative RT-PCR analysis of IFN-I and SASP genes in RS hMSCs transduced with lentiviruses expressing Luc or SIRT7. Expression levels of these indicated genes in SIRT7 lentivirus-transduced hMSCs were normalized to those in Luc lentivirus-transduced hMSCs. (P) SA-β-gal staining of old primary hMSCs from an 80-year-old individual (Old #2) transduced with lentiviruses expressing Luc or SIRT7. Scale bar, 125 μm. Data are presented as the means ± SEM. n = 3. **, P < 0.01 (t test). (Q) Clonal expansion analysis of old primary hMSCs from an 80-year-old individual (Old #2) transduced with lentiviruses expressing Luc or SIRT7. Data are presented as the means ± SEM. n = 5. ***, P < 0.001 (t test). (R) Immunostaining of Ki67 in old primary hMSCs from an 80-year-old individual (Old #2) transduced with lentiviruses expressing Luc or SIRT7. White arrowheads indicate cells with decreased expression of Ki67. Scale bar, 25 μm. Data are presented as the means ± SEM. n = 3. ***, P < 0.001 (t test). (S) Heatmap showing quantitative RT-PCR analysis of IFN-I and SASP genes in old primary hMSCs from an 80-year-old individual (Old #2) transduced with lentiviruses expressing Luc or SIRT7. Expression levels of these indicated genes in SIRT7 lentivirus-transduced hMSCs were normalized to those in Luc lentivirus-transduced hMSCs
Figure 6
Figure 6
3TC attenuates SIRT7-deficient hMSCs senescence by antagonizing LINE1’s effects. (A) RT-qPCR analysis of the relative LINE1 genomic DNA content in SIRT7−/− hMSCs treated with vehicle or 3TC. Data are presented as the means ± SEM. n = 4. *, P < 0.05 (t test). (B) SA-β-gal staining of SIRT7−/− hMSCs treated with vehicle and 3TC. Scale bar, 125 μm. Data are presented as means ± SEM. n = 3. ***, P < 0.001 (t test). (C) Clonal expansion analysis of SIRT7−/− hMSCs treated with vehicle and 3TC. Data are presented as means ± SEM. n = 3. **, P < 0.01 (t test). (D) Bar plot showing the percentages of cells in S-phase of cell cycle in SIRT7−/− hMSCs treated with vehicle or 3TC. Data are presented as the means ± SEM. n = 3. ***, P < 0.001 (t test). (E) Heatmap showing quantitative RT-PCR analysis of aging-related markers in SIRT7−/− hMSCs treated with vehicle or 3TC. Expression levels of these indicated genes in 3TC-treated hMSCs were normalized to those in vehicle-treated hMSCs. (F) Western blot analysis of P16 and P21 proteins in SIRT7−/− hMSCs treated with vehicle or 3TC with β-Tubulin used as loading control. (G) Heatmap showing quantitative RT-PCR analysis of IFN-I and SASP genes in SIRT7−/− hMSCs treated with vehicle or 3TC. Expression levels of these indicated genes in 3TC-treated hMSCs were normalized to those in vehicle-treated hMSCs. (H) SA-β-gal staining of old primary hMSCs from an 80-year-old individual (Old #2) treated with vehicle or 3TC. Scale bar, 125 μm. Data are presented as means ± SEM. n = 3. **, P < 0.01 (t test). (I) A model illustrating SIRT7-mediated heterochromatin stabilization in hMSCs. In young hMSCs, SIRT7 functions as a stabilizer for nuclear lamina proteins Lamin B1, LBR, and heterochromatin proteins KAP1, HP1α and HP1γ, which together form a complex at LADs to ensure chromatin spatial organization and silence LINE1. In old hMSCs, SIRT7 downregulation leads to the detachment of the complex from LADs and promotes the transcription and accumulation of LINE1 DNA, which in turn triggers activation of the cGAS-STING pathway and an immune response. 3TC is used to inhibit LINE1 reverse transcription and thus rescue senescence phenotypes

Comment in

References

    1. Anders S, Pyl PT, Huber W. HTSeq—a Python framework to work with high-throughput sequencing data. Bioinformatics (Oxford, England) 2015;31:166–169. - PMC - PubMed
    1. Araki S, Izumiya Y, Rokutanda T, Ianni A, Hanatani S, Kimura Y, Onoue Y, Senokuchi T, Yoshizawa T, Yasuda O, et al. Sirt7 contributes to myocardial tissue repair by maintaining transforming growth factor-beta signaling pathway. Circulation. 2015;132:1081–1093. - PubMed
    1. Bao X, Liu Z, Zhang W, Gladysz K, Fung YME, Tian G, Xiong Y, Wong JWH, Yuen KWY, Li XD. Glutarylation of Histone H4 Lysine 91 regulates chromatin dynamics. Mol Cell. 2019;76(660–675):e669. - PubMed
    1. Barber MF, Michishita-Kioi E, Xi Y, Tasselli L, Kioi M, Moqtaderi Z, Tennen RI, Paredes S, Young NL, Chen K, et al. SIRT7 links H3K18 deacetylation to maintenance of oncogenic transformation. Nature. 2012;487:114–118. - PMC - PubMed
    1. Bickmore WA, van Steensel B. Genome architecture: domain organization of interphase chromosomes. Cell. 2013;152:1270–1284. - PubMed

Publication types